Technical Communication
DOI: http://dx.doi.org/10.1590/2446-4740.0680*e-mail: [email protected]
Received: 03 November 2014 / Accepted: 08 December 2014
Survey and analysis of optical density of dental ilms processed
manually in portable dark chambers
Cristiano Miguel*, Frieda Saicla Barros, Walmor Cardoso Godoi, João Gilberto Tilly Junior, Anna Silvia Penteado Setti Rocha, Cláudio Domingues de Almeida
Abstract Introduction: Intraoral ilm processing can be performed manually using chambers manufactured from opaque material to prevent light from entering and consequently blurring images. The aim of this study was to evaluate whether portable darkrooms used in ofices, clinics and educational institutions prevent the entry of light during the processing of intraoral ilms. Methods: To this end, tests were carried out and images were analyzed by measuring the optical base-plus-fog densities (ODs) upon imaging. Results: Review of the OD measurements revealed that in 70.7% of the evaluated manual portable revelation cameras, the base-plus-veil density of intraoral ilms was not in accord with that of the protocol reference. Discussion: The results of this work can be used to identify chambers that are commonly exposed to light from luorescent lamps and solar lighting.
Keywords: Intraoral radiography, Portable dark chambers, Dental ilm processing, Quality control.
Introduction
Intraoral radiographs ilms can be processed manually in portable chambers manufactured from opaque material (Freitas et al., 2004; Whaites, 2009). However, to ensure the quality and standardization of the procedure, image development must be performed using a timer, thermometer and development table. Chemical processing should follow the manufacturer’s guidelines to ensure quality processing and lifetime radiography (Brasil, 1998).
The handheld chambers used in dental ofices consist fully or partially of acrylic polymers, which serve as a ilter for protecting ilm against the effects of light (Freitas et al., 2004). However, because they are portable and are subject to various environmental lighting conditions, it is necessary to properly evaluate and establish the parameters of the illumination spot. These lighting conditions concern both the type of light source and the intensity of the source in question. The three light sources used in most dental ofices are natural sunlight, artiicial light from ilament lamps and artiicial light from luorescent lamps. These sources are usually chosen, in most cases, due to their low installation cost, low power consumption and their ability to provide pleasant lighting indoors (Tamburús et al., 1999).
The light input into a developing chamber can cause opaciication in radiographic ilm, damaging contrast, introducing artifacts and deteriorating the
image quality. Radiographic ilms have marked sensitivity to ultraviolet and visible light, corresponding to colors in the blue and green regions. The base-veil OD is a measure of the transparency of base ilms and the result of exposing ilm to light and/or chemical contamination. Attaining excellence in radiology depends on accurate acquisition and image processing. The correct interpretation of an image is important for planning, analysis, controlling patient conditions and radioprotection (Damian, 2008; Tilly, 2010).
The aim of this paper is to present the analytical results of a survey of the optical base-plus-veil densities (ODs) measured for sample ilms in portable dental darkrooms used in ofices, clinics and educational institutions in the city of Curitiba.
Methods
A survey of the optical base-plus-veil densities of ilms developed in dental darkrooms was conducted between August 2013 and April 2014 in educational institutions, clinics and dental ofices in the city of Curitiba/PR; samples were chosen by random sampling. The tests were performed on the lighting conditions that professionals use to process the acquired images. Films provided by dentists and available chemicals were used to ensure that the conditions of the reviews would be identical to the processing conditions used in radiographic examinations.
Dental ilm’s processed manually
Forty-one portable dental darkroom samples were analyzed under conditions that dentists and dental assistants use daily in 28 workplaces. In 48.7% of the chambers, we could not identify the brand of the product; the other 51.3% were divided into 4 brands. Overall, 76.5% of the boxes were identiied to be from the same brand. The manufacturers of the chambers were not cited in this work. Among the 41 chambers evaluated, 27 were exposed to luorescent light and indirect sunlight from ofice windows, 8 were used in conventional darkrooms with the door open, 3 were used in a room outside the ofice with the lights off and 3 were protected from sunlight and exposed to incandescent light.
To assess whether the portable darkrooms prevented light from disturbing the conditions under which they were used, a method called the “coin test” was employed. We used a digital stopwatch, thermometer, a coin and intraoral ilms with type E sensitivity. The temperature of the developer was measured, and with the chamber closed, each ilm was removed from the casing left on the base of the chamber. A coin was placed at the center of the ilm to prevent light from entering the chamber and sensitizing that region of the ilm; thus, only the region surrounding the coin was sensitized. The sample ilms were allowed to be exposed to light from within the developing chamber for a period of 1 minute. After this period, the ilms were developed according to the time indicated by the table and temperature indicated within the ilm box, taking into account the temperature of the developer. The test ilms were washed with pure water and left
for 5 minutes in ixative. The brands and models of the ilms and chemicals used for ilm development varied among professionals. This condition of non-standard processing may relect the speciicities of each clinical diagnosis, which was of interest in this work.
After drying, the films were identified and catalogued. The analysis was performed visually by reading the optical densities (ODs) at the center of the ilms and the arithmetic average ODs along the four edges of the ilms. The measurements were performed using a densitometer from Nuclear Associates (model 07-443; calibrated). As a reference for assessing the compliance of the outcome measures in this study, a base-plus-veil limit of 0.3 OD established by the Protocolo Español de Control de Calidad en Radiodiagnóstico (Sociedad…, 2011) was used.
Results
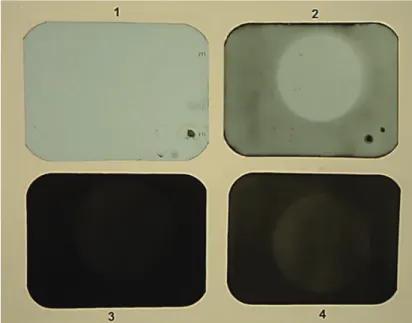
Figure 1 shows the types of images obtained by the method used in this study; the ODs of the images ranged from acceptable to very high. Images considered to be unacceptable could be visually identiied due to the difference in OD between the central region that was covered by the coin and the sides of the ilms that were exposed to light during development within the chambers.
The graph in Figure 2 compares the OD readings obtained at the center of the ilms and at the edges of the ilms. Readings below 0.3 OD were considered to be within the range of acceptance.
Figure 1. Film images processed from different cameras. Images 2, 3 and 4 were considered to lie outside the range of acceptability. 79
Miguel C, Barros FS, Godoi WC, Tilly JG Jr, Rocha ASPS, Almeida CD
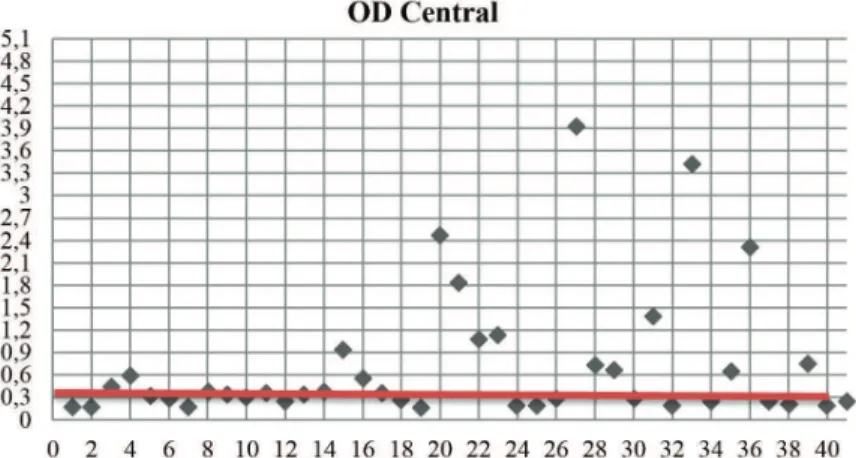
Figure 4. Comparison of the optical densities (vertical axis) observed at the center of the ilms developed in the assessed chambers (horizontal
axis). The red line indicates the reference value used to assess acceptability (0.3 OD).
Figure 2. Comparison between the optical densities (vertical axis) observed at the center and sides of the ilms developed in the assessed
chambers (horizontal axis). The red line indicates the reference value used to assess acceptability (0.3 OD.)
Figure 3. Comparison between the mean optical densities (vertical axis) observed on the sides of the ilms developed in the assessed
chambers (horizontal axis). The error bars are the standard deviation measures of the samples. The red line indicates the reference value used to assess acceptability (0.3 OD).
The graphs presented in Figures 3 and 4 show the mean values of the optical density (vertical axis) measured along the edges of the ilms in the
Dental ilm’s processed manually
measure: even if the average OD value of a given chamber is above the OD value considered acceptable (0.3 OD), standard deviations within this value can be used as a criterion for accepting a given chamber. The standard deviation can also be used as a quality parameter in conjunction with the mean OD value. To aid visualization of the results, the red line in the graphs presented in Figures 2, 3 and 4 indicates the reference optical density value of 0.3 OD.
Discussion
According to Yacovenco (2001), in portable darkrooms, the development process requires regular care, such as checking for the penetration of light through cracks and wearing sleeves. In this study, it was observed that most of the portable darkrooms were exposed to sunlight, and light from luorescent lamps penetrated the darkrooms to some extent. The best results were observed for light-protected chambers, i.e., in dark chambers and ofices that do not use luorescent lamps. However, dental ofices do not typically feature darkrooms.
In a study conducted in Rio de Janeiro, 90 dentists rated their chambers using the coin test. Among the sample, 56.4% of the dentists were considered non-compliant (Almeida, 2005), whereas our research conducted in Curitiba indicated that 70.7% of professionals were in non-conformity regarding portable darkroom use. Thus, only 12 of the 41 portable darkrooms evaluated provided development equipment with base-plus-veil OD values considered acceptable. The main factor that affected the outcome of this study was the lighting conditions of the rooms where ilms were developed. This effect was observed because
the materials used to manufacture the chambers were not considered suitable.
References
Almeida CD. Levantamento estatístico de 10 critérios estabelecidos pela portaria 453 MS para os odontólogos que utilizam raios X [Internet]. Rio de Janeiro; 2005. [cited 2014 Out 14]. Available from: http://www.iaea.org/inis/collection/ NCLCollectionStore/_Public/44/079/44079069.pdf. Brasil. Ministério da Saúde. Secretaria de Vigilância Sanitária. Diretrizes de proteção radiológica em radiodiagnóstico médico e odontológico. Portaria nº 453. Diário Oficial da União, Brasília, dez 1998.
Damian MF. Avaliação visual como um programa de controle de qualidade em radiologia odontológica. Revista Odonto Ciência. 2008; 23(3):268-72.
Freitas A, Rosa JE, Souza IF. Radiologia Odontológica. 6. ed. São Paulo: Artes Médicas, 2004.
Sociedad Española de Física Médica. Sociedad Española de Protección Radiológica. Sociedad Española de Radiología Médica. Protocolo Español de Control de Calidad en Radiodiagnóstico. Madrid: Senda Editorial, 2011. Revisión 2. Tamburús JR, Lavrador MAS, Oliveira AC. Processamento radiográfico - câmara escura portátil: relação entre filtro de luz e densidade de base + véu. Revista de Odontologia da Universidade de Sao Paulo. 1999; 13(1):93-100. http:// dx.doi.org/10.1590/S0103-06631999000100018. Tilly JG Jr. Física Radiológica, 1. ed. Rio de janeiro: Guanabara Koogan, 2010.
Whaites E. Princípios de Radiologia Odontológica. 4. ed. Rio de Janeiro: Elsevier, 2009.
Yacovenco AA. Análise dos Problemas mais frequentes da radiografia na Prática Odontológica. Revista da ABRO. 2001; 2(1):29-39.
Authors
Cristiano Miguel1*, Frieda Saicla Barros1
, Walmor Cardoso Godoi
1, João Gilberto Tilly Junior2,
Anna Silvia Penteado Setti Rocha3, Cláudio Domingues de Almeida1
1Universidade Tecnológica Federal do Paraná – UTFPR, Av. Sete de Setembro, 3165, CEP 80230-901, Curitiba, PR, Brazil.
2Hospital de Clínicas – HC, Universidade Federal do Paraná – UFPR, Curitiba, PR, Brazil.
3Instituto de Radioproteção e Dosimetria – IRD, Rio de Janeiro, RJ, Brazil.
81