ABSTRACT: In this study, incompressible, unsteady and turbulent low over an airfoil with pitching and plunging oscillations is numerically studied in order to investigate the effect of reduced frequency on stability derivatives of oscillating airfoil. Linear k – ε model called Launder-Sharma and Rhie and Chow model are used for turbulence modeling and overcoming pressure checkerboard problem. This means that a co-located approach is proposed in this paper to study a moving grid problem, and the results demonstrate the high accuracy of the method. Control volume and Crank-Nicholson discretization method are also used for the numerical solution. It is shown that the longitudinal stability derivatives of plunging and pitching motions trend change intensively beyond the stall angle of attack while pitching rate has a completely opposite behavior. The results also show that increasing reduced frequency leads to stability reduction in plunging oscillation but it does not have signiicant effect on pitching oscillation case in pre-stall, stall and post-stall conditions. Grid convergence is examined to assess the accuracy of the numerical method that shows the high accuracy of it and this is a prominent achievement of the present study. The results of the proposed method in forces and moment show a good agreement with the experimental data.
KEYWORDS: Oscillating airfoil, Pitching oscillation, Plunging oscillation, Stability derivatives, Co-located method.
Numerical Study of Reduced Frequency Effect
on Longitudinal Stability Derivatives of Airfoil
under Pitching and Plunging Oscillations
Vahid Nasr Esfahani1, Mahmoud Mani1
INTRODUCTION
One of the most important problems in the aerodynamics theory is analyzing the stability of aircrat in order to be assured of its controllability and safety. The accurate prediction of moment and forces applied on aircraft plays a prominent role in determining its stability. Unsteady aerodynamics of oscillating airfoils has received attention in order to analyze the aerodynamic forces on aircrats.
Glauert (1935), in the 1930s, commenced studying oscillating airfoils. Following him, in 1940, heodorsen and Garrick (1948) started much more accurate investigations on lutter problem of aircrat wings and paved the way for future studies on inviscid and incompressible lows over low-amplitude oscillating airfoils. Although plenty of numerical and experimental studies have been carried out to determine aerodynamic coeicients of static airfoils, more investigations on unsteady aerodynamics of oscillating airfoils are demanded. Among experimental studies, there are the papers by Panda and Zaman (1994), who investigated the flow field and estimation of lift from wake survey on a pitching airfoil. he Reynolds numbers were 44,000 and 22,000 based on chord length and the airfoil was NACA 0012 with sinusoidal oscillation. Tolouei et al. (2004) studied the low around a pitching airfoil in a frequency range of 0.022 – 0.066. hey particularly investigated the pressure distribution of an oscillating airfoil. Sadeghi et al. (2010) also experimentally studied unsteady wake of a pitching airfoil and investigated pitching amplitude efect on the wake thickness.
Tuncer (1986), in the 1980s, started a numerical investigation on rapidly pitched airfoils. He studied unsteady ields over
1.Amirkabir University of Technology – Aerospace Engineering Department – Tehran/Iran.
Author for correspondence: Vahid Nasr Esfahani | Amirkabir University of Technology – Aerospace Engineering Department | 1591634311, 424 Hafez Ave | Tehran/Iran | Email: [email protected]
pitching airfoil and dynamic stall in his paper. In the 1990s, Tuncer (1997) used overset grid method to numerically study a plunging airfoil and compared the results with single grid solution. In that paper, he used Baldwin-Brath as a turbulence modeling and the Mach 0.3 low was considered. Guilmineau and Queutey (1999) numerically studied dynamic stall on diferent airfoil sections. hey used Baldwin-Brath and k – ω
SST turbulence models. hese studies are devoted to ind a numerical approach to deal with oscillating airfoils. However, there is still a compelling desire to achieve highly accurate numerical method on this subject.
Additionally, plenty of experimental and numerical investigations have been carried out on stability derivatives and stability of aircrafts. Bak et al. (2000) experimentally investigated force coefficients and stability derivatives of NACA 63-415 airfoil in wind tunnel tests. Park et al. (2003) predicted stability coeicients using Euler equations in pitching motion. hey used multi-grid method to calculate pitch and roll moments. Altun and İyigün (2004) measured the dynamic stability derivatives of a generic combat aircraft model in wind tunnel applying force oscillation on their model. Gopinath and Jameson (2005) used time-spectral method to study force and moment coeicients on 2-D and 3-D bodies. hey used multi-grid method to solve Navier-Stokes equations for pitching airfoils and pitching wings. Schmidt and Newman (2010) also numerically investigated stability derivatives of a generic combat aircrat model. In recent studies Bhagwandin and Sahu (2014) numerically calculated stability derivatives for inned projectiles in subsonic and transonic regimes. Considering these papers, more investigations are required to study parameters that have signiicant efects on stability derivatives and oscillating motions such as oscillation amplitude or reduced frequency.
In the present research, a co-located numerical method is proposed to a moving grid problem. he purpose is to accurately estimate the stability derivatives of an oscillating airfoil and investigate the reduced frequency efect on the aerodynamics of oscillating airfoils. he proposed method is highly accurate; therefore, it can be a solution for the most common issue of numerical methods in unsteady aerodynamics, which is low accuracy. Moreover, the proposed method is applied to a 2-D problem and is able to be applied on more complex 3-D problems either. Numerical inite volume method with linear
k – ε, Launder-Sharma turbulence model is used to study unsteady, incompressible and turbulent low over a pitching and a plunging NACA 63-415 airfoil. Ater computing force
and moment coeicient diagrams against time, longitudinal stability derivatives are obtained using curve itting in both oscillations. his curve itting is based on standard approaches that help the method to be able to model non-linear responses on lying vehicles. In another remarkable point of this numerical study, Rhie and Chow (1983) method is devoted to overcome pressure-velocity luctuations (pressure checkerboard problem). Ater obtaining stability derivatives, the reduced frequency effects in pre-stall, stall and post-stall conditions on these derivatives are studied. Grid convergence index (GCI) and order of accuracy are also obtained to verify the numerical method and approve its accuracy.
GOVERNING EQUATIONS
Continuity and momentum equations in Reynolds-Averaged Navier-Stokes (RANS) equations for unsteady incompressible low are as follows:
where: t represents time; x is the space direction; U is the mean velocity; i and j are indexes, with i, j = 1, 2, 3; P is the pressure; Ui is the mean velocity of the low; ρ is density; ν is viscosity; uiuj is called Reynolds stress terms that are unknowns of the problem and have to be modeled.
Due to the oscillation motion, the source term Si is zero. Boussinesq (1987) proposed a method in which Reynolds stress could be modeled using an equivalent turbulent viscosity and is expressed as:
(1)
(2)
(3)
(4)
where: δij is the Kronecker delta; vt is the turbulent kinematic viscosity and is calculated as:
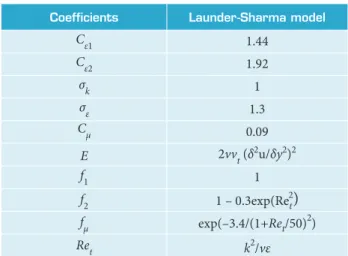
Coeficients Launder-Sharma model
Cε1 1.44
Cε2 1.92
σk 1
σε 1.3
Cμ 0.09
E 2vvt (δ2u/δy2)2
f1 1
f2 1 – 0.3exp(Re2t
)
fμ exp(–3.4/(1+Ret/50)
2)
Ret k2
/vε
Table 1. Turbulence modeling coeficients.
In order to model Reynolds stress terms, linear k – ε
turbulence model called Launder-Sharma is used. Turbulence kinetic energy (k) and dissipation rate (ε) equations are:
where: V and s are integral volume and surface, respectively; dnj is the diferential component of surface normal vector.
Note that, for a moving mesh problem, these equations are changed in some ways to model new control volume shapes. hese corrections are made using Leibnitz rule. Let Wj be the boundary velocity of a control volume. Using Leibnitz rule, integrated continuity and momentum equations are considered just like the previous section; the only diference is that it is written for a moving mesh and a control volume.
(5)
(11)
(12)
(13) (7)
(8)
(9)
where: σk, σε, Cε1, Cε2, f1, f2 and E are given in Table 1. In these relations, P* is the production term in turbulence low and is calculated as:
where: Sij is the mean rate of stress tensor and is calculated this way:
NUMERICAL METHOD
In order to solve low equations in this paper, control volume method is used. For stationary control volumes, integrated continuity and momentum equations for incompressible low are:
In the proposed numerical method, Crank-Nicholson method is used for discretization. To prevent pressure and velocity ield luctuation, Rhie and Chow method for incompressible low is utilized. In this co-located method, velocity components on moving control volume boundaries are given as:
where: u shows the velocity on volume boundaries while
U indicates the velocity at the center of the control volume;
e indexes are related to the east of the control volume and
E indexes are related to the neighboring control volume centers; P indexes indicate the particular control volume that is being solved.
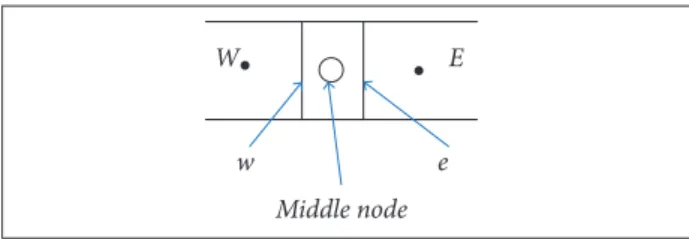
Figure 1 shows the scheme of a cell.
Transporting velocity is also modeled to prevent pressure checkerboard problem:
(6)
(10)
Comparing diferent solutions, the most appropriate value for k΄ is obtained; k΄ = 1 is selected for Eq. 14 for an accurate and smooth solution. For boundary conditions in this numerical method, at inlet, velocity, kinetic turbulent energy, dissipation rate, and molecular viscosity are set, and, at outlet, pressure is applied.
where: α · is the variation rate of angle of attack and q is the pitch rate; Cmais the pitch damping that can be neglected because of its small value.
Substituting Eq. 15 for α(t) in Eq. 17, Eq. 18 is obtained:
(21)
(15)
(16)
(17)
(18)
(19)
(20)
SIMULATION OF PITCHING AND
PLUNGING OSCILLATIONS
In order to calculate longitudinal stability derivatives, unsteady aerodynamics are considered. Moreover, force and moment coeicients against time in diferent angles of attack have to be computed. Two types of oscillating motions are used in this paper: (1) pitching and (2) plunging. hus, a harmonic oscillating motion with constant amplitude is applied on airfoil. Pitching motion with sinusoidal variation in angle of attack is described as:
where: αm is the mean angle of attack; αA is the oscillation amplitude; ω is the circular frequency and is determined using the reduced frequency relation kc = ωl/2V , where l is the chord length and V is the freestream velocity.
In addition, for plunging oscillation, the equation of motion is:
Ater applying pitching and plunging oscillations to the airfoil, force and drag coeicients are computed in time; then, using curve itting, the following equation is assumed for the pitching moment:
where: CmA is the amplitude; Cm0 is the initial pitching moment;
δ is the phase diference that is assumed by moment coeicient variations and IEEE-std-1050 standard for curve itting.
Comparing Eq. 19 with Eq. 18, the following equation is obtained:
Additionally, in order to use the previous equation for plunging airfoil, an equivalent angle of attack is deined:
Figure 1. Control volume and its direction indexes. W and E indicate the center of control volumes on the western and eastern sides of the cell, respectively; w and e indicate the boundaries on the western and eastern sides of the cell, respectively.
W
Middle node E
e w
This way, damping stability derivatives Cmα·+Cmq are
obtainable using curve fitting. Noting that the pitch rate is negligible for plunging airfoil, Cmα· can be calculated for plunging
airfoil and net value of Cmq is achieved.
GRID AND INITIAL CONDITIONS
Airlow Reynolds number is . he NACA 63-415 airfoil that is used in this study has chord length of 0.6 m and the inlet air velocity is 40 m·s–1. Density is considered constant
and is set at 1.225 kg·m–3; the pressure at the outlet is set at
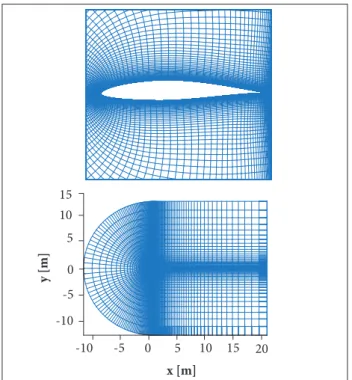
1 bar. Since the reduced frequency efects on the stability longitudinal derivatives are investigated, constant mean angle of attack and oscillation amplitude are determined, and the values are 1.5° and 1.3°, respectively. he reduced frequency interval for this study is 0.09 to 0.16, C-type grid is used for the airfoil and the domain is shown in Fig. 2. hree diferent where: a is the mean oscillation amplitude.
Figure 2. C-type mesh for numerical study.
y
[m]
-10 -5 0 5 10 15 20 -5
5
-10 0 10 15
x [m]
grids with 11,200, 21,600, and 25,200 cells are used for grid reinement. he 21,600-cells grid is used for numerical solution. Note that the y plus value for the grid is about 1.1 and the wall distance is about 10−5 m. he grid convergence study has also
been done and it is proposed in the next section. he time step for transient study is 0.001 s.
dV 1.8E-12 1.77586E-12 1.75172E-12 1.72759E-12 1.70345E-12 1.67931E-12 1.65517E-12 1.63103E-12 1.6069E-12 1.58276E-12 1.55862E-12 1.53448E-12 1.51034E-12 1.48621E-12 1.46207E-12 1.43793E-12 1.41379E-12 1.38966E-12 1.36552E-12 1.34138E-12 1.31724E-12 1.2931E-12 1.26897E-12 1.24483E-12 1.22069E-12 1.19655E-12 1.17241E-12 1.14828E-12 1.12414E-12 1.1E-12
Figure 3. Contours of velocity magnitude variation after 3 s (dV = V − 0).
GRID CONVERGENCE STUDY
For grid study convergence, Richardson extrapolation is used to calculate a higher-order estimation of the low ields from a series of lower-order discrete values (f1, f2, …, fn). For the case of grid reinement study, the value estimated from the Richardson extrapolation is the one that would result when the cell grid size is tended to zero.
(22)
(23)
(24)
Considering h1, h2 2 grid spacing, with h1 being the iner grid, r is the grid reinement ratio, r = h2
/
h1; p΄ is the order of accuracy of the numerical method and 3 diferent solutions are needed for this term, which is calculated as (Stern et al. 2001):Roache (1994) also suggests a GCI to provide a consis-tent manner in reporting the results of grid convergence. To compute the GCI, 3 levels are recommended in order to accurately estimate the order of convergence and to check that the solutions are within the asymptotic range of con- vergence:
RESULTS AND DISCUSSION
GEOMETRIC CONSERVATION LAWSince a moving grid is considered in the present paper, in this section, a test case is introduced to demonstrate the correct performance of the algorithm on moving grids. The case is defined to prove that grid motions would not affect the solution. For this purpose, the fluid is initially stationary with the following parameters: P = 1 bar and
ρ = 1.225 kg·m–3. With these initial conditions, fluid flow
equations are solved in the domain while the elements oscillate with the motion of displacement. After 3 s, with the time step of 0.001 s, the contours of dV (V − 0), variation of velocity magnitude after 3 s, that is physically expected to remain zero, are plotted in Fig. 3. As can be seen, they are almost zero. This demonstrates the correct implementation of Geometric Conservation Law in the solution.
Table 2 shows grid convergence study results for the proposed numerical method. Since moment coeicient is a signiicant parameter in this paper, it is used to study grid convergence and obtain the order of accuracy. he convergence is studied for moment coeicient in 2.1o and 0.5o angles of attack.
As Table 2 shows, the order of accuracy for the numerical method is about 1.92 while the theoretical order of accuracy is 2. he diference is most likely due to grid stretching or turbulence modeling. here is a reduction in GCI value for the successive grid reinements (GCI12 < GCI23). he GCI for iner grid (GCI12) is relatively low if compared to the coarser grid (GCI23), indicating that the dependency of the numerical method on the cell size has been reduced. Additionally, as the
GCIreduction from the coarser grid to the iner grid is relatively high, the grid independent solution can be said to have been nearly achieved. Further reinement of the grid will not give much change in the results. So, it can be said that the solution on the proper grid resolution is nearly grid-independent.
Figure 4 indicates the independency of solution from grids for lit and moment coeicients of a plunging airfoil. In Fig. 5, lit
and drag coeicient diagrams in diferent angles of attack for 3 diferent time steps are shown to demonstrate the independency of results from time step. As Fig. 5 shows, 0.001 s is assumed for the time step of the solution. Note that the results are shown for a pitching airfoil in this igure.
NUMERICAL RESULTS
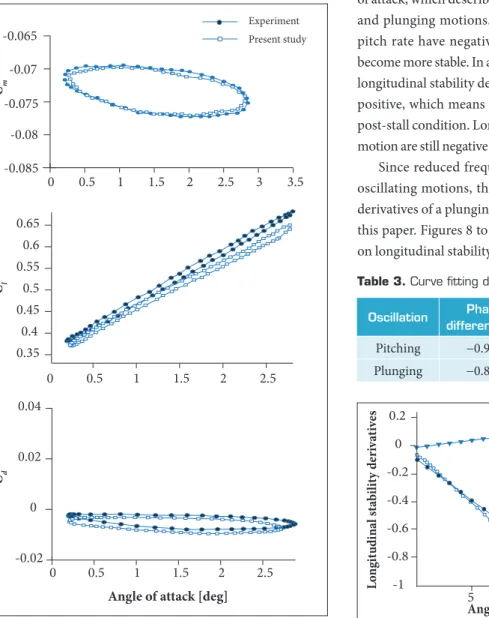
As Figs. 4 and 5 show, lit, drag and moment coeicient diagrams against angle of attack have hysteresis loop in a 0.25 to 2.75 interval. Due to sinusoidal oscillations in airfoil motion, force and moment coeicients have hysteresis loops in particular intervals of angles of attack for both pitching and plunging airfoils. Figure 6 shows forces and moment coeicients for mean angle of attack of 1.5°, reduced frequency of 0.09 and pitching amplitude of 1.3° for a pitching NACA 63-415 airfoil. Hysteresis loops are clearly observed in these diagrams. his igure also compares the results of this research with wind tunnel test results found in Bak et al. (2000) to validate the proposed numerical method. It is shown that the results of the present study have good accuracy in comparison with the existing experimental results. Numerical method errors are 3.2, 1.4 and 3.9 percent for lit, moment and drag coeicient,
Angle of attack
ε
12
ε
23 fexactGCl12
(%)
GCl23
(%) p’
0.5o 0.0005 0.002 −0.076 0.312 1.203 1.926
2.1o 0.0008 0.003 −0.078 0.455 1.757 1.931 Table 2. Grid convergence index and order of accuracy for C
m .
Figure 4. C
m and Cl against angle of attack for different grids. Figure 5.Cd and Cl against angle of attack for different time steps. Angle of attack [deg]
0 0.5 1 1.5 2 2.5
0 0.5 1 1.5 2 2.5 -0.01
-0.005 0 0.005
0.01 dt = 0.0005
dt = 0.001 dt = 0.005
Cl Cd
0.35 0.4 0.45 0.5 0.55 0.6
Angle of attack [deg]
Cl
0 0.5 1 1.5 2 2.5 0.35
0.4 0.45 0.5 0.55 0.6
Cm
0 0.5 1 1.5 2 2.5 -0.085
-0.08 -0.075 -0.07 -0.065 -0.06 -0.055
Figure 7. Variation of longitudinal stability derivatives with angle of attack.
Angle of attack [deg]
L
o
ng
it
ud
in
al
st
ab
ilit
y
d
er
iv
at
iv
es
5 10 15
-1 -0.8 -0.6 -0.4 -0.2 0 0.2
Cmq Cmἀ + Cmq
Cmἀ
Kc= 0.09 deg
respectively. hese errors are calculated by comparing areas of hysteresis loops.
In order to predict the time variation of longitudinal stability derivatives, force and moment diagrams against time have to be determined. Curve itting these diagrams using Eq. 19, longitudinal stability derivatives can be calculated by Eq. 20. Ater this procedure, longitudinal stability derivative variations with diferent angles of attack can be obtained. Figure 6 shows the variation for longitudinal stability derivatives in diferent angles of attack. For this case, the mean angle of attack is 1.5° and the reduced frequency is 0.09 for both pitching and plunging airfoils. Table 3 also shows curve itting data for stability derivatives in an angle of attack equal to 1.5°.
Oscillation Phase
difference (δ) CmA Cmα + Cmq
Pitching −0.949 0.002 −0.000
Plunging −0.812 0.003 −0.172
Figure 6. Comparison of present numerical and experimental results (Bak 2000).
0 0.5 1 1.5 2 2.5
0.35 0.4 0.45 0.5 0.55 0.6 0.65
0 0.5 1 1.5 2 2.5 3 3.5
-0.085 -0.08 -0.075 -0.07 -0.065
Experiment
Present study
Angle of attack [deg] Cd
Cl Cm
0 0.5 1 1.5 2 2.5
-0.02 0 0.02 0.04
Table 3. Curve itting data for angle of attack of 1.5°.
Longitudinal stability derivative variations for pitching (Cmα·+ Cmq) and plunging airfoil (Cmα·) with angle of attack are shown in Fig. 7. Numerical results show that the longitudinal stability derivatives of pitching and plunging airfoils have the same trend in diferent angles of attack, whilst the longitudinal stability of pitch rate (Cmq) has a completely diferent attitude in pre- and post-stall conditions. In other words, longitudinal stability derivatives for pitching and plunging airfoils values are increased in pre-stall condition and decreased in post-stall condition. Longitudinal stability derivatives of pitch rate have an opposite trend.
Figure 9. Reduced frequency effect on longitudinal stability derivatives in stall condition.
Figure 10. Reduced frequency effect on longitudinal stability derivatives in post-stall condition.
Figure 8. Reduced frequency effect on longitudinal stability derivatives in pre-stall condition.
0.09 0.1 0.11 0.12 0.13 0.14 0.15 -0.8
-0.6 -0.4 -0.2 0
Reduced frequency
Longitudinal stability derivatives
Cmq
Cmἀ + Cmq Cmἀ
αm= 11 deg
Reduced frequency Longitudinal stability derivatives -0.1 0.1 0.11 0.12 0.13 0.14 0.15
-0.05 0
0.05 Cmq
Cmἀ + Cmq Cmἀ
αm= 18 deg
0.05 0.1 0.15
-0.2 -0.15 -0.1 -0.05
Reduced frequency
Longitudinal stability derivatives
Cmq Cmἀ + Cmq
Cmἀ
αm= 1.5 deg
increased from 0.09 to 0.16 and longitudinal stability derivative variations and trends are studied in 3 diferent conditions: pre-stall, stall and post-stall.
For these 3 conditions, 3 particular mean angles of attack are determined: 1.5°, 11° and 18° for pre-stall, stall and post-stall conditions, respectively. As shown in Fig. 8, by increasing
the reduced frequency from 0.09 to 0.16, longitudinal stability derivative values for plunging airfoil move toward positive values, which leads to unstable oscillations in higher reduced frequencies. This can be justified by fluid displacement effect on airfoil. On the other hand, the increasing in the reduced frequency does not have significant influence on longitudinal stability derivatives of pitching airfoil. Longitudinal stability of pitch rate is also stable in the studied reduced frequency interval. In plunging motion, by increasing the reduced frequency to 0.06, negative damping effects of wake on moment coefficient become evident and, by increasing further, these effects are more severe. In pitching airfoil, longitudinal stability derivatives in low reduced frequency have a different trend in comparison to plunging airfoil due to the pitch rate.
In Fig. 9, which is stall condition, with mean angle of attack equal to 11°, the situation is as the same as the pre-stall condition. he only notable diference is that the variation of longitudinal stability derivatives of plunging and pitching airfoils is not signiicant as in the pre-stall condition.
he mean angle of attack equal to 18° shows the post-stall condition in Fig. 10. In this condition, as in the previous ones, longitudinal stability derivatives of plunging and pitching airfoils have negative signs, which means they are stable. However, by increasing the reduced frequency, longitudinal stability derivatives of plunging airfoil move toward the positive values and become more unstable. It is important to note that the variation of longitudinal stability derivatives of plunging airfoil is more than that of the pitching airfoil. In other words, plunging airfoil is more sensitive to reduced frequency than pitching airfoil.
Studying pitch rate in all of the conditions shows the reduced frequency efect on the stability of the oscillation. Figure 8 shows that the pitch rate efect is elevated by increasing the reduced frequency and the negative value of Cmq is also increased, which means it is always in stable condition.
CONCLUSION
utilized to solve a moving grid problem. Grid convergence was also examined for numerical method and results indicated that the grid convergence index was below 5%, which demonstrates the high accuracy of the numerical approach. he Reynolds number was 1.6 × 10⁶, linear k – ε model was used as turbulence
model and Rhie and Chow method was also devoted to overcome pressure checkerboard problem.
he paper investigated the behavior of stability derivatives in diferent conditions. Furthermore, it is shown that the stability of a plunging airfoil was decreased by increasing the reduced frequency, primarily in pre- and post-stall conditions. Finally, the research shows that the pitching airfoil stability is relatively independent of reduced frequency especially in low angles of attack due to the existence of the pitch rate in this motion.
REFERENCES
Altun M, İyigün İ (2004) Dynamic stability derivatives of a maneuvering combat aircraft model. Journal of Aeronautics and Space Technologies 1(3):19-27.
Bak C, Fuglsang P, Johansen J, Antoniou I (2000) Wind tunnel tests of the NACA 63-415 and a modiied NACA 63-415 airfoil. Risø National Laboratory, Roskilde, Denmark; [accessed 2016 Jun 27]. http://orbit.dtu. dk/fedora/objects/orbit:88085/datastreams/ile_7729395/content
Boussinesq, J. (1987) Essai sur la théorie des eaux courantes, Mémoires présentés par divers savants à l’Académie des Sciences 23 (1): 1-680.
Bhagwandin VA, Sahu J (2014) Numerical prediction of pitch damping stability derivatives for inned projectiles. J Spacecraft Rockets 51(5):1603-1618. doi: 10.2514/1.A32734
Glauert H (1935) Airplane propellers. In: Durand WF, editor. Division L of aerodynamic theory. Vol. 6. Berlin: Springer. p. 169-360.
Gopinath AK, Jameson A (2005) Time spectral method for periodic unsteady computations over two- and three-dimensional bodies. Proceedings of the 43rd AIAA Aerospace Sciences Meeting and Exhibit; Reno, USA.
Guilmineau E, Queutey P (1999) Numerical study of dynamic stall on several airfoil sections. AIAA J 37(1):128-130. doi: 10.2514/2.677
Panda J, Zaman KBMQ (1994) Experimental investigation of the low ield of an oscillating airfoil and estimation of lift from wake surveys. J Fluid Mech 265:65-95. doi: 10.1017/S0022112094000765
Park SH, Kim Y, Kwon JH (2003) Prediction of damping coeficients using the unsteady Euler equations. J Spacecraft Rockets 40(3):356-362. doi: 10.2514/2.3970
Rhie CM, Chow WL (1983) Numerical study of the turbulent low past an airfoil with trailing edge separation. AIAA J 21(11):1525-1532. doi: 10.2514/3.8284
Roache PJ (1994) Perspective: a method for uniform reporting of grid reinement studies. J Fluids Eng 116(3):405-413. doi: 10.1115/1.2910291
Ronch AD, McCracken A, Badcock KJ (2011) Modeling of unsteady aerodynamic loads. AIAA Atmospheric Flight Mechanics Conference; Portland, USA.
Sadeghi H, Mani M, Alighanbari H (2010) An experimental study of the unsteady wake of an Eppler-361 airfoil. Proceedings of the 40th Fluid Dynamics Conference and Exhibit; Chicago, USA.
Schmidt S, Newman DM (2010) Estimation of dynamic stability derivatives of a generic aircraft. Proceedings of the 17th Australasian Fluid Mechanics Conference; Auckland, New Zealand.
Stern F, Wilson RV, Coleman HW, Paterson EG (2001) Comprehensive approach to veriication and validation of CFD simulations — Part 1: Methodology and procedures. J Fluids Eng 123(4):793-802. doi: 10.1115/1.1412235
Theodorsen T, Garrick IE (1948) Mechanism of lutter: a theoretical and experimental investigation of the lutter problem. Technical Report N.A.C.A. Report No. 685.
Tolouei E, Mani M, Soltani MR, Boroomand M (2004) Flow analysis around a pitching airfoil. Proceedings of the 22nd Applied Aerodynamics Conference and Exhibit; Providence, USA.
Tuncer IH (1986) Unsteady aerodynamics of rapidly pitched airfoil. Proceedings of the 4th Joint Fluid Mechanics, Plasma Dynamics and Lasers Conference; Atlanta, USA.