ISSN 0104-6632 Printed in Brazil
www.abeq.org.br/bjche
Vol. 23, No. 02, pp. 259 - 266, April - June, 2006
Brazilian Journal
of Chemical
Engineering
EXTRACTION OF HO-SHO (Cinnamomum camphora
NEES AND EBERM VAR. Linaloolifera fujita)
ESSENTIAL OIL WITH SUPERCRITICAL CO
2
:
EXPERIMENTS AND MODELING
E. Steffani
1*, A. C. Atti-Santos
2, L. Atti-Serafini
2and L. T. Pinto
31Departamento de Engenharia Química, Centro de Ciências Exatas e Tecnologia,
Phone: +(55) (54) 3218-2100, Ext. 2266, Fax: +(55) (54) 32182100 Ext. 2253, Universidade de Caxias do Sul, CEP 95001-970, Caxias do Sul - RS, Brazil.
E-mail: [email protected]
2Instituto de Biotecnologia, Universidade de Caxias do Sul, CEP 95001-970, Caxias do Sul - RS, Brazil.
3Departamento de Engenharia Química e de Alimentos, Centro Tecnológico,
Universidade Federal de Santa Catarina, CEP 88040-900, Florianópolis - SC, Brazil.
(Received: October 20, 2004 ; Accepted: March 6, 2006)
Abstract - Supercritical CO2 extraction of essential oil from the leaves of a variety of camphor tree known as
Ho-Sho was studied. Experiments were carried out within the following ranges: CO2 flow rate (1 - 4 mL/min);
pressure (80 - 100 bar); temperature (40 - 60 oC) and particle size (0.37 - 1.0 mm). The equipment used was
an HP 8670 T extractor module with an extraction cell volume of 7 mL. Two mathematical models of the process were proposed. Model 1 was a modified version of the traditional shrinking core model with effective
diffusivity and the external mass transfer coefficient as the fitting parameters. Model 2 used an additional kinetic parameter based on an Arrhenius-like expression. Both models took into account the cell pressurization step. The best fit between the extraction model curves and the experimental data was obtained using model 2.
Keywords: Supercritical extraction; Essential oil; Ho-sho; Mathematical modeling.
INTRODUCTION
Linalool is an important intermediary in the manufacture of vitamin E and, like geranial, is raw material for the production of vitamin A (Bauer and Garbe, 1985). Linalool can be synthesized by different chemical routes from α-pinene or from isoprene. The world consumption of linalool in 1988 was estimated at six million metric tons (Clark, 1988) and it is growing year after year, because it is used not only for the production of vitamins, but also in the fragrance industry. An alternative for the production of linalool from a natural source is the
essential oil obtained from a plant known as ho-sho
(Cinnamomum camphora Nees and Eberm var.
linaloolifera Fujita), which is a tree native to China,
Formosa and Japan. The main component of ho-sho essential oil is linalool (80-90%). Natural sources of linalool are of interest, mainly to the fragrance industry, because the smell of plant materials is usually the result of complex interactions among the components of the mixture (Reverchon, 1997).
MATERIALS AND METHODS
Ho-sho leaves from exemplars of plants at the Biotechnology Institute of the University of Caxias do Sul were picked and dried under controlled conditions (temperature 20-22 oC and relative air humidity 50-60%) during a period of seven days. After the drying period the leaves were ground using a Tecnal TE-650 mill (Tecnal, Brazil). Tyler sieves
were used to classify particles by desired size fractions (average diameters of 0.37 mm, 0.50 mm and 1.0 mm). Then the particles were introduced into the extraction cell, whose internal volume was about 7 mL.
The experimental extraction runs with supercritical CO2 were carried out in a Hewlett-Packard 7680 T extraction module and followed a 3x3 graeco-latin square design type, according to the experimental matrix presented in Table 1:
Table 1: Experimental matrix
Run Flow Rate
(mL/min)
Pressure (bar)
Temperature (oC)
Particle Size (mm)
1 1.0 80 40 0.37 2 1.0 90 50 0.50 3 1.0 100 60 1.00 4 2.5 80 50 1.00 5 2.5 90 60 0.37 6 2.5 100 40 0.50 7 4.0 80 60 0.50 8 4.0 90 40 1.00 9 4.0 100 50 0.37
For each run, the oil obtained at predefined time intervals was collected in separate flasks and the data points were used to plot the extraction curves.
Gas chromatography using an internal standard was the method used for quantification of the essential oil extracted. This method consists in adding a given amount of a substance (which is called the standard) to the extract before the chromatographic analysis. This substance must have a response factor similar to that of the main components of the extract. In accordance with this criterion, 3-octanol (Aldrich, USA, 97% purity) was chosen as internal standard for having a molar mass close to that of linalool, the main component in the extracted essential oil. It was also assumed that the other oil components had the same response factor. Thus, the total amount of essential oil extracted was calculated using the results of the chromatographic analysis and the extract yield was determined. All the analyses were carried out in a gas chromatograph HP GC 6890 Series, equipped with a data acquisition software (HP Chemstation), an FID detector (Flame Ionization Detector) and a fused silica capillary
column HP-Innowax (30 m x 320 μm). The column
temperature varied from 40 °C (8 minutes) to 180 °C at 3 °C/min, from 180 to 230°C at 20 °C/min, 230 °C (20 minutes). The injector temperature was 250 °C; the split ratio was 1:50; H2 was the carrier gas; the column head pressure was 34 kPa and the injected sample volume was1.0 μL.
The density of the porous solid matrix and the tortuosity of the solid were determined with a mercury intrusion assay using Poresizer 9320 equipment (Micromeritics, USA), obtaining the values of 544.5 kg/m3 and 6.71, respectively. The skeletal density of the solid was determined using a helium pycnometer (Ultrapycnometer 1000, Quantachrome, USA), and the value obtained was 1314 kg/m3. From the density of the porous solid and the skeletal density it was possible to determine the porosity of the solids as being 0.58.
MATHEMATICAL MODELING
(
)
1 1 1
1 f1
1 p 1 r R
dC (t) C (t) d (t)
dt (t) dt
3k (t)
(1 )
C (t) C (r, t)
R =
ρ
= − ⋅ −
ρ
− ε
− −
ε
(1)
where C is the solute concentration in CO1 2 in the bed void volume, ρ1 is the density of CO2, ε is the voidage of the extraction bed, k is the external film mass f1 transfer coefficient,
R
is the particle radius, Cp1 r R= is
the solute concentration in the pore volume of solid at the surface of the particle and
t
is time.Initial condition:
1
C (0) 0= (2)
For the extraction stage, the fluid phase equation is obtained assuming the axial dispersion term and the process occurring under isothermal and isobaric conditions. The resulting equation is
(
)
2
L 2
f
p r R
C(z, t) C(z, t) C(z, t)
D
t z z
3k
(1 )
C(z, t) C (z,r, t)
R =
∂ = ∂ − ν∂ −
∂ ∂ ∂
− ε
− −
ε
(3)
where C is the solute concentration in CO2 in the bed void volume in the extraction stage, D is the axial L dispersion coefficient, ν is the interstitial velocity of solvent in the bed, k is the external film mass f transfer coefficient in the extraction stage, Cp r R
= is
the solute concentration in the pore volume of solid at the surface of the particle in the extraction stage and
z
is the axial coordinate.Initial condition:
1
C(z,0) C (t pressurization time)= = ( z)∀ (4)
Boundary conditions:
L
C(z, t)
z 0, vC(z, t) D 0 ( t)
z
∂
= − = ∀
∂ (5)
C(z, t)
z L, 0 ( t)
z
∂
= = ∀
∂ (6)
For the mass balance in the solid phase, two distinct models based on differential method of rate analysis are proposed. Model 1 is based on the shrinking core model, traditionally used in the chemical reactor area, where it is known as the “non-reacted core model”, initially adapted by Roy et al. (1996) and improved by Spricigo (1998). The model assumes the existence of a solute core inside a spherical particle that will decrease continuously during extraction. The equation that governs mass transfer inside the particle pores assumes an effective diffusivity for the oil in the CO2. The solute diffuses inside the pores in the region between core surface (r r= c) and particle surface (r R)= . It is assumed that, on the core surface, the solvent is always saturated. The solubility of the essential oil was calculated from the results of Chang and Chen (1999), assuming the oil to be pure linalool. When the core vanishes, the boundary condition for the pore oil concentration becomes a symmetry condition. Thus, the model obtained for the solid phase can be written as
Pressurization stage:
2
p 1 ef1 p 1 p 1
2 p
p 1 1
1
C (r, t) D (t) C (r, t) 2 C (r, t)
t r r r
C (r, t) d (t)
(t) dt
⎛ ⎞
∂ ∂ ∂
⎜ ⎟
= + −
⎜ ⎟
∂ ε ⎝ ∂ ∂ ⎠
ρ −
ρ
(7)
where Def1 is the effective diffusivity in the
extractor pressurization stage, εpis the porosity of the solid and r is the radial coordinate.
Initial condition:
p 1
C (r,0) 0 ( r)= ∀ (8)
Boundary conditions:
c 1
r r= ; C (r, t) Cp 1 = sat 1(t)
(9) if rc 1≠0
c 1
r r= ; C (r, t)p 1 0 r
∂
=
∂ (symmetry)
r R;=
(11)
(
)
p 1
ef1 f1 1 p 1 r R
r R
C (r,t)
D (t) k (t) C (t) C (r,t) ( t)
r =
=
∂
= − ∀
∂
Extraction stage:
2
p ef p p
2 p
C (z,r, t) D C (z,r, t) 2 C (z,r, t)
t r r r
⎛ ⎞
∂ ∂ ∂
⎜ ⎟
= +
⎜ ⎟
∂ ε ⎝ ∂ ∂ ⎠ (12)
where D is the effective diffusivity in the ef
extraction stage and C is the solute concentration in p the pore volume of solid in the extraction stage.
Initial condition:
p p1
C (z,r,0) C (r, t pressurization time)= = ( z)∀ (13)
Boundary conditions:
c
r r= ; C (z,r, t) Cp = sat if rc ≠0 (14)
c
r r= ; C (z,r, t)p 0 r
∂
=
∂ (symmetry) if rc =0 (15)
r R;=
(16)
(
)
p
ef f p r R
r R
C (z,r,t)
D k C(z,t) C (z,r,t) ( t)
r =
=
∂
= − ∀
∂
The present proposal for calculation of the shrinkage of the core differs from that of Spricigo (1998). In this work it is assumed that the variation in oil mass in the core is equal to the oil mass flow rate at the surface of core multiplied by the surface area of the core. After the algebraic calculation the equations obtained for both stages of the process become
Pressurization stage:
c1
c 1 ef1 1 p 1
N s r r
dr (t) D (t) (t) C (r, t)
dt C r =
∂ ρ
= ⋅ ⋅
ρ ∂ (17)
where C is the initial solid phase concentration N and ρs is the density of the porous solid matrix.
Initial condition:
c 1
r (0) R= (18)
Extraction stage:
c
p
c ef
N s r r
C (z,r, t) r (z, t) D
t C r =
∂
∂ ρ
= ⋅ ⋅
∂ ρ ∂ (19)
where ρ is the density of CO2 in the extraction stage.
Initial condition:
c c1
r (z,0) r (t pressurization time)= = ( z)∀ (20)
Model 2 makes use of a differential equation for diffusion inside the pores that is applied to the whole particle domain (different from model 1 where diffusion takes place outside the core region) and an equation for mass transfer from solid to fluid based on oil solid concentration and the distance from saturation in the fluid phase. A radial gradient of solid oil concentration, instead of an average concentration value as is usually seen in the literature was assumed. Therefore, the equations for the solid phase in model 2 are
Pressurization stage:
2
p 1 ef1 p 1 p 1
2 p
p 1 1 s 1
1 p 1
C (r,t) D (t) C (r,t) 2 C (r,t)
t r r r
C (r,t) d (t) q (r,t)
(t) dt (t) t
⎛ ⎞
∂ ∂ ∂
⎜ ⎟
= + −
⎜ ⎟
∂ ε ⎝ ∂ ∂ ⎠
ρ
ρ ∂
− −
ρ ε ρ ∂
(21)
(
)
1
1
1 sat1 p1
q (r, t)
K(T) (t)
t
q (r, t) C (t) C (r, t)
∂ = − ρ
∂
− (22)
where q is the solute concentration in the solid 1 phase in the extractor pressurization stage and K is a kinetic parameter.
Initial conditions:
p 1
C (r,0) 0 ( r)= ∀ (23)
1 N
Boundary conditions:
r 0= ; C (r, t)p1 0 r
∂
=
∂ (symmetry) (25)
r R;=
(26)
(
)
p1
ef1 f1 1 p1 r R
r R
C (r,t)
D (t) k (t) C (t) C (r,t) ( t)
r =
=
∂
= − ∀
∂
Extraction stage:
2
p ef p p
2 p
s p
C (z,r,t) D C (z,r,t) 2 C (z,r,t)
t r r r
q(z,r,t) t
⎛ ⎞
∂ ∂ ∂
⎜ ⎟
= + −
⎜ ⎟
∂ ε ⎝ ∂ ∂ ⎠
ρ ∂ −
ε ρ ∂
(27)
(
sat p)
q(z,r, t)
K(T) q(z,r, t) C C (z,r, t) t
∂ = − ρ −
∂ (28)
where q is the solute concentration in the solid phase in the extraction stage.
Initial conditions:
p p1
C (z,r,0) C (r, t pressurization time)= = ( z)∀ (29)
1
q(z,r,0) q (r, t pressurization time)= = ( z)∀ (30)
Boundary conditions:
r 0= ; C (z,r, t)p 0 r
∂
=
∂ (symmetry) (31)
r R= (32)
(
)
p
ef f p r R
r R
C (z,r,t)
D k C(z,t) C (z,r,t) ( t).
r =
=
∂
= − ∀
∂
The axial dispersion coefficient was estimated by a correlation proposed by Tan and Liou (1989). The models were solved by the method of lines, through spatial discretization using finite differences followed by an integration in time using Euler’s method.
RESULTS AND DISCUSSION
In the simulations performed, the external film mass transfer coefficient (kf), the effective diffusivity
(Def) and, in case of model 2, the kinetic coefficient (K) were used as the fitting parameters. The initial estimates for the external film mass transfer coefficient were obtained by Wakao and Kaguei’s (1982) correlation. For the effective diffusivity the starting value was obtained with the equation proposed by Pinto (1994). The initial estimates for the kinetic parameter (K) were obtained as a function of temperature, using an Arrhenius-like expression.
The parameters were optimized without using a specific algorithm, i.e., by a process of trial and error, by minimizing an objective function (F), defined by
n
2 calc,i exp,i i
F=
∑
(M −M ) (33)where n is the number of experimental points for each run, Mcalc,i is the accumulated extracted oil
mass up to the time corresponding to point i,
obtained by simulation and Mexp,i is the
accumulated oil mass extracted up to the time corresponding to point i, obtained experimentally.
During the optimization process, in both models a low sensitivity to the external film mass transfer coefficient was verified, indicating that extraction is controlled by intraparticle mass transfer. Thus, the option was to keep the values of these parameters obtained directly by Wakao and Kaguei’s (1982) correlation. Related to the effective diffusivity parameter, the final values obtained for each experiment were from one to two orders of magnitude smaller than the initial estimates. The difficulty faced in this parameter prediction is associated with the fact that different vegetal structure types have different mass transfer resistances, which makes it more difficult to correlate the effective diffusivity with the oil-CO2 binary diffusivity, as reported by Gaspar et al. (2003).
Table 2: Values of optimized model parameters
Run kf x 10
4
(m/s) Def (m
2
/s) Model 1
Def (m2/s)
Model 2 K (m
3
kg-1s-1)
1 3.351 4.105 x 10⁻¹² 2.085 x 10⁻¹¹ 2.047 x 10⁻⁴
2 2.525 8.537 x 10⁻¹² 3.309 x 10⁻¹¹ 2.489 x 10⁻⁴
3 1.513 7.834 x 10⁻¹¹ 7.700 x 10⁻¹¹ 1.340 x 10⁻¹
4 2.316 4.631 x 10⁻¹¹ 4.308 x 10⁻¹¹ 6.728 x 10⁻³
5 4.895 4.024 x 10⁻¹¹ 6.163 x 10⁻¹¹ 2.058 x 10⁻²
6 2.302 7.146 x 10⁻¹² 5.287 x 10⁻¹² 6.141 x 10⁻³
7 4.991 9.717 x 10⁻¹¹ 1.580 x 10⁻¹⁰ 3.087 x 10⁻²
8 2.182 2.127 x 10⁻¹¹ 1.634 x 10⁻¹¹ 1.433 x 10⁻²
9 5.406 2.269 x 10⁻¹¹ 1.771 x 10⁻¹¹ 3.700 x 10⁻²
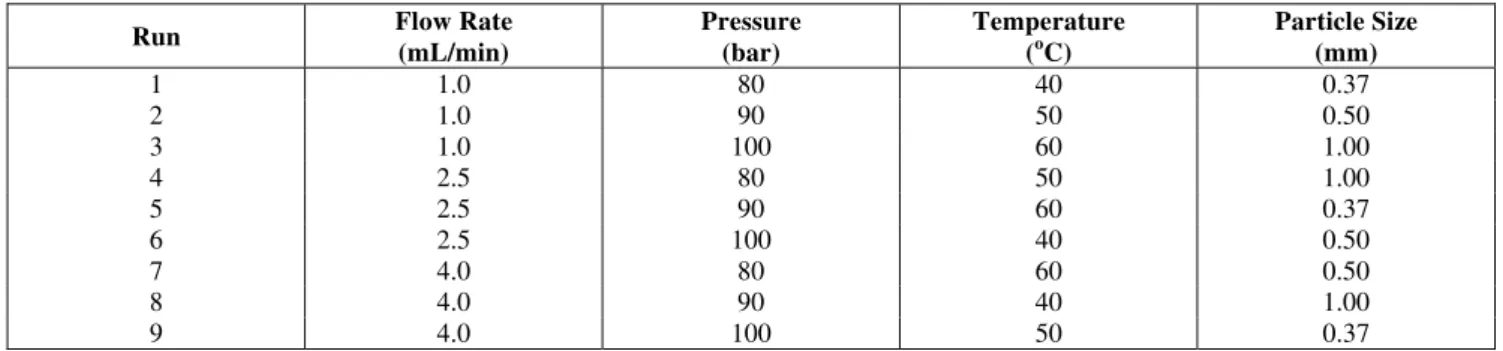
The extraction curves for run 2 are shown in Figure 1, where the results for both models were obtained with the optimized parameters. In general, the best agreement between the experimental data and the calculated values was obtained with model 2.
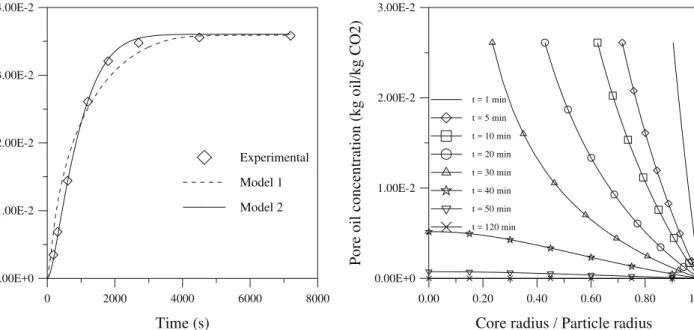
Figures 2 and 3 show respectively the concentration profiles in the pores of the particles at the inlet of the extractor (z = 0) for run 4 in model 1
and model 2. In Figure 2, a change in the curves due to the gradual reduction of the core can be noted.
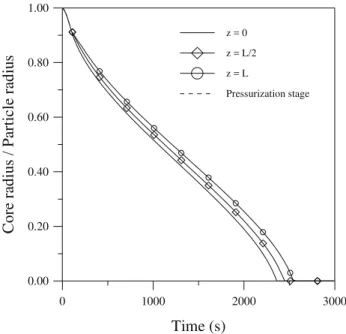
The variation in core size (Model 1) with time and axial position in the extractor for run 4 is shown in Figure 4. It includes the pressurization stage besides the extraction stage. The depletion of oil in the particles begins at the inlet of the extractor, where the solid is in contact with pure CO2 and extends in the direction of the outlet.
0 2000 4000 6000 8000
Time (s)
0.00E+0 1.00E-2 2.00E-2 3.00E-2 4.00E-2
Mass of extracted o
il
/ M
ass of p
la
nt fe
d
Experimental
Model 1
Model 2
0.00 0.20 0.40 0.60 0.80 1.00
Core radius / Particle radius
0.00E+0 1.00E-2 2.00E-2 3.00E-2
Pore oil concentration (kg oil/kg CO2)
t = 1 min t = 5 min t = 10 min t = 20 min t = 30 min t = 40 min t = 50 min t = 120 min
Figure 1: Superposition of experimental and model extraction curves for run 2.
Figure 2: Profiles for pore concentration in the extraction stage at the inlet of the extractor generated
0.00 0.20 0.40 0.60 0.80 1.00
Dimensionless radial position in the particle (r/R)
0.00E+0 1.00E-2 2.00E-2 3.00E-2
Pore oil conce
ntration (kg oil/kg CO2)
t = 1 min t = 5 min t = 10 min t = 20 min t = 30 min t = 40 min t = 50 min t = 120 min
0 1000 2000 3000
Time (s)
0.00 0.20 0.40 0.60 0.80 1.00
Core ra
dius / Particle
radiu
s
z = 0 z = L/2 z = L
Pressurization stage
Figure 3: Profiles for pore concentration in the extraction stage at the inlet of the extractor generated
by Model 2 (run 4).
Figure 4: Dimensionless core radius in different axial positions as a function of time generated by Model 1
(run 4).
CONCLUSIONS
In this work, two mathematical models were proposed to represent the process of supercritical extraction of essential oil from leaves of a plant known as ho-sho, using CO2 as solvent. Both models contemplated the initial stage of extractor pressurization, which differentiates this work from previous research found in the literature. This can be important in the scale-up of the process, depending on the volume of the extractor and the capacity of the pump. The model that best reproduced the extraction curves was model 2, which used a nonconventional kinetic parameter based on an Arrhenius-like equation. It was found that extraction is controlled by intraparticle mass transfer. Additional work has to be done for correlate the effective diffusivity with
the oil-CO2 binary diffusivity. For the set of
experiments performed, the largest essential oil yield obtained (4.31% w/w dry weight basis) occurred under the following conditions: a pressure of 90 bar, a temperature of 60 oC, a CO
2 flow rate of 2.5 mL/min and a particle size of 0.37 mm.
NOMENCLATURE
Latin Letters
1
C (t) solute concentration in CO2 in the bed void volume in the extractor
(kg oil/kg CO2)
pressurization stage C(z, t) solute concentration in
CO2 in the bed void volume in the extraction stage
(kg oil/kg CO2)
N
C initial solid phase
concentration
(kg oil/kg solid)
p 1
C (r, t) solute concentration in the pores of the solid in the extractor
pressurization stage
(kg oil/kg CO2)
p
C (z,r, t) solute concentration in the pores of the solid in the extraction stage
(kg oil/kg CO2)
sat 1
C (t) saturation concentration of solute in the fluid phase in the extractor pressurization stage
(kg oil/kg CO2)
sat
C saturation concentration
of solute in the fluid phase
(kg oil/kg CO2)
ef1
D (t) effective diffusivity in the extractor
pressurization stage
(m2/s)
ef
D effective diffusivity in
the extraction stage
(m2/s)
L
D axial dispersion
coefficient (m
2/s)
f1
k (t) external film mass transfer coefficient in the
extractor pressurization stage
f
k external film mass
transfer coefficient in the extraction stage
(m/s)
K kinetic parameter (m3 kg-1s-1)
L bed length (m)
1
q (r, t) solute concentration in the solid phase in the extractor pressurization stage
(kg oil/kg solid)
q(z,r, t) solute concentration in the solid phase in the extraction stage
(kg oil/kg solid)
r radial coordinate in the
particle
(m)
c 1
r (t) core radius in the extractor pressurization stage
(m)
c
r (z, t) core radius in the extraction stage
(m)
R particle radius (m)
t time (s)
T temperature (K)
z axial coordinate (m)
Greek Letters
ε voidage of the extraction
bed
(dimensionless)
p
ε porosity of the solid (dimensionless)
v interstitial velocity of
solvent in the bed
(m/s)
1(t)
ρ density of CO2 in the
extractor pressurization stage
(kg/m3)
ρ
density of CO2 in theextraction stage
(kg/m3)
s
ρ density of the porous
solid matrix
(kg/m3)
REFERENCES
Bauer, K. and Garbe, D., Common Fragrance and Flavor Materials: Preparation, Properties and Uses, VHC, Weinheim (1985).
Chang, C. M. J. and Chen, C. C., High-pressure Densities and P-T-x-y Diagrams for Carbon Dioxide + Linalool and Carbon Dioxide + Limonene, Fluid Phase Equilibria, 163, p.119 (1999).
Clark, G. S., Linalool, Perfumer & Flavorist, 13, p. 49 (1988).
Gaspar, F., Lu, T., Santos, R. and Al-Duri, B., Modelling the Extraction of Essential Oils with Compressed Carbon Dioxide, Journal of Supercritical Fluids, 25, p. 247 (2003).
Pinto, L. T., Um Estudo do Transiente da Difusão Gasosa em Meios Porosos. D. Sc. diss., COPPE-Federal University of Rio de Janeiro, Rio de Janeiro-RJ, Brazil (1994).
Reverchon, E., Supercritical Fluid Extraction and Fractionation of Essential Oils and Related Products, Journal of Supercritical Fluids, 10, p. 1 (1997).
Roy, B. C., Goto, M. and Hirose, T., Extraction of Ginger Oil with Supercritical Carbon Dioxide: Experiments and Modeling, Ind. Eng. Chem. Res., 35, p. 607 (1996).
Spricigo, C. B., Extração de Óleo Essencial de Noz Moscada com Dióxido de Carbono a Altas Pressões. M. Sc. thesis, Federal University of Santa Catarina, Florianópolis-SC, Brazil (1998). Tan, C. S. and Liou, D. C., Axial Dispersion of
Supercritical Carbon Dioxide in Packed Beds, Ind. Eng. Chem. Res., 28, p. 1246 (1989).