Article
J. Braz. Chem. Soc., Vol. 25, No. 11, 2016-2025, 2014. Printed in Brazil - ©2014 Sociedade Brasileira de Química 0103 - 5053 $6.00+0.00
A
*e-mail: [email protected]
Single Drop Microextraction: a Sensitive Multiresidue Method for Determination of
Pesticides in Water Using GC/ECD
Carlos E. S. Soares,a Antônio A. Neves,*,a Maria E. L. R. de Queiroz,a André F. Oliveira,a Anna I. G. Costa,a Roberta C. Assisa and Carlos E. O. Andradea,b
aDepartamento de Química, Universidade Federal de Viçosa, Viçosa-MG, Brazil
bCentro Federal de Educação e Tecnologia de Minas Gerais (CEFET-MG), Campus Timóteo,
Timóteo-MG, Brazil
O monitoramento de pesticidas em amostras ambientais em baixas concentrações é necessário devido aos riscos que estes compostos representam a saúde humana e ao meio ambiente. Neste trabalho, o método microextração em gota única (SDME) foi otimizado e validado para a determinação das concentrações traço de oito pesticidas em água utilizando cromatografia gasosa com detector por captura de elétrons (GC/ECD). A cinética de transferência de matéria da fase aquosa para a fase orgânica durante o processo de extração também foi avaliada. O método mostrou recuperações entre 89,5 e 122,7%, com coeficientes de variação menores que 22,9%, e os limites de detecção entre 5,9 e 58,9 ng L−1. O método foi aplicado a amostras fortificadas em diferentes
níveis de concentração, e recuperações entre 50,5 e 148% foram obtidas. O processo de extração pode ser descrito pelo modelo de difusão de Noyes-Whitney, e a parationa metílica apresentou a maior taxa de transferência entre as duas fases.
The monitoring of pesticides in environmental samples at low concentrations is needed due to the risks that these compounds can pose to human health and the environment. In this work, a single drop microextraction (SDME) method was optimized and validated for the determination of trace concentrations of eight pesticides in water, using gas chromatography with electron capture detector (GC/ECD). The kinetics of the transfer of material from the aqueous phase to the organic phase during the extraction process was also evaluated. The method showed recoveries between 89.5 and 122.7%, with coefficients of variation smaller than 22.9%, and detection limits between 5.9 and 58.9 ng L−1. The method was applied to spiked samples at different concentration levels,
and recoveries between 50.5 and 148% were obtained. The extraction process could be described by the Noyes-Whitney diffusion model, and methyl parathion showed the highest rate of transfer between the two phases.
Keywords: single drop microextration, pesticides, sensitive method, kinetics
Introduction
The contamination of aquatic systems by pesticides can occur in several ways, including leaching from soil1,2
and surface run-off during precipitation.3 When present in
contaminated water, these pollutants can easily reach the human population because conventional water treatment stations are unable to eliminate pesticides.4 The World
Health Organization (WHO) has established concentration limit values for a range of substances including some
pesticides (Table 1). In Brazil, these values are set out in Ordinance No. 2914 MS (December 2011), and are equal to the values established by WHO.5
In order to meet the increasing demands of legislation, pesticide research has focused on developing methods of analysis that are sufficiently sensitive to quantify these compounds at very low concentrations. The techniques used to extract pesticides from water include liquid-liquid extraction, solid phase extraction,6,7 bar sorptive extraction,8
solid phase microextraction,9,10 dispersive liquid-liquid
microextraction,11 liquid-liquid extraction with low
temperature partitioning,12 and single drop microextraction
In SDME, the extraction phase is a small drop of a water-immiscible solvent, which is suspended on the tip of the needle of a syringe and immersed in a solution (usually the sample itself).14 The SDME procedure consists of two
steps. In the first step, the analytes are extracted from the matrix into the drop. In the second step, the analytes present in the drop are injected into the instrument for detection.14
The process of SDME is simple and inexpensive once no sophisticated device is needed for the formation of the single drop. It can be applied for determination of different analytes in different samples, such as pesticides in vegetables15,16
and fruit,17 chlorobenzenes, trihalomethane and metals in
water13,18-20 and organophosphate in soil.21 This technique
shows some advantages over conventional liquid-liquid extraction as a low consumption of organic solvents and high enrichment factor.22 In addition, the procedure allows for their
combination with various analytical techniques such as gas chromatography, high performance liquid chromatography, capillary electrophoresis, among others. On the other hand, a limitation of this technique is the instability of the single drop at high agitation speeds.14
The aim of this study was to adapt the SDME extraction technique for the extraction of the pesticides trifluraline, alachlor, lindane, methyl parathion, endosulfan, dieldrin, endrin, and 4,4’-DDT present in water samples. Evaluation was also made of the kinetics of pesticide transfer during the extraction.
Experimental
Standards, samples and reagents
The standards used in this work were trifluraline (99.3%, m/m), alachlor (99.0%, m/m), lindane (99.8%, m/m), methyl parathion (99.9%, m/m), dieldrin (97.9%, m/m), endrin (99.3%, m/m), and 4,4’-DDT (98.8%, m/m),
all obtained from Sigma-Aldrich. The physico-chemical properties of these pesticides are listed in Table 2. The HPLC-grade solvents used for extraction were acetonitrile, ethyl acetate, and n-hexane, all purchased from Vetec (Brazil). The water used in the experiments was obtained from a Milli-Q system (Millipore).
Preparation of standard solutions and samples
Stock 1000.0 mg L−1 standard solutions of each
pesticide were prepared by solubilization of the standards in acetonitrile. Working solutions containing all the pesticides were prepared at a concentration of 10.0 mg L−1
by dilution of the stock standard solutions in acetonitrile. These solutions were stored in a freezer at a temperature of approximately −20 °C.
The analytical curves were constructed from dilutions of the working solution in acetonitrile.
Chromatographic analysis
A gas chromatograph (Shimadzu GC-17A) fitted with an electron capture detector (ECD) and a manual injector was used. The capillary column used to separate the compounds was an Agilent HP-5 (30 m length, 0.25 mm internal diameter, and 0.1 µm film thickness), with a stationary phase consisting of 5% diphenyl and 95% dimethyl siloxane. Nitrogen was used as the carrier gas, at a flow rate of 1.2 mL min−1. The column temperature
program was an initial temperature of 150 °C, maintained for 1 min, an increase at 40 °C min−1 to 200 °C, a hold at
this temperature for 2 min, then an increase at 5 °C min−1
to 210 °C, a hold at 210 °C for 3 min, then an increase at 3 °C min−1 to 220 °C followed by an increase at 40 °C min−1
to 290 °C and a hold for 2 min. The total analysis time was 16.5 min. The injector and detector temperatures were maintained at 280 °C and 300 °C, respectively. A volume of 1 µL of organic extract was injected into the chromatograph, using a split ratio of 1:5. Figure 1 shows a chromatogram of a 30 µg L−1 standard solution, identifying
the compounds according to the retention times.
Extraction of pesticides in water by single drop microextraction
The extraction method consisted of placing the aqueous sample in contact with one microdrop of organic solvent that had low miscibility in the aqueous phase. Several variables can interfere in the efficiency of extraction of active compounds from the aqueous phase to the organic phase. Here, univariate analysis was made of the effects of the time of contact between the phases, the aqueous Table 1. Maximum allowable values for some pesticides in water
established by the World Health Organization and Ordinance No. MS 2914
Pesticide Maximum allowable
values / (µg L−1)
Trifluraline 20.0
Alachlor 20.0
Lindane 2.0
Methyl parathion 9.0
phase stirring speed, and the volume of the microdrop. A 23 factorial design was used to evaluate the effects of
temperature (17 °C and 25 °C), salt (with and without the addition of Na2HPO4), and extraction solvent (toluene and
n-hexane). The experiments were performed in triplicate. The optimized and validated direct extraction method consisted of placing a 30.00 mL sample of water spiked with pesticides in a glass jar (40 mL) fitted with a polytetrafluoroethylene (PTFE) and silicone septum cap. The dimensions of the vessel were 10 cm (height) by
2.5 cm (diameter), and the height of the water column was 6.5 cm. A 10 µL microsyringe with a steel needle (RN 701, Hamilton, USA) containing n-hexane was introduced into the flask, and the tip of the needle was immersed in the aqueous sample at a depth of 2.5 cm. The piston was depressed slowly in order to produce a 1.6 µL microdrop in the solution. The microdrop was maintained in contact with the sample and the flask was shaken at 155 rpm for 30 min at 17 °C. The drop was then retrieved and a 1.0 µL volume was injected into the gas chromatograph. Prior Table 2. Physical and chemical properties of the pesticides
Pesticide Chemical structure Chemical group log Kow pH = 7
20 °C
Solubility in water 20-25 °C / (mg L−1)
Trifluraline dinitroaniline 5.27 0.194
Alachlor chloroacetanilide 3.09 148
Lindane organochlorine 3.61 7.3
Methyl parathion organophosphate 3.0 55
Endosulfan organochlorine 4.75 0.32
Endrin organochlorine 5.06 0.25
Dieldrin organochlorine 5.37 0.19
to each extraction, the microsyringe was washed with extraction solvent to ensure thorough cleaning and the removal of air bubbles.
Validation of the analytical method
The figures of merit evaluated for the SDME-GC/ECD method were: selectivity, linearity, limits of detection (LOD) and quantification (LOQ), accuracy and precision (repeatability and intermediate precision), and enrichment factors.
Kinetics of transfer of compounds between the aqueous phase and the microdrop
The behavior and kinetics of transfer of the compounds from the aqueous phase to the organic phase was investigated by fortifying contaminant-free water samples with the pesticides. The exposure time of the microdrop in the samples was varied (5, 10, 15, 20, 25, and 30 min), and the agitation speed was kept constant at 155 rpm. After each exposure time, the extracts were injected into the GC/ECD and the peak areas were measured for each compound. The data obtained were then fitted using first and second order models, the intraparticle diffusion model, and the Noyes-Whitney diffusion model in order to identify the model that best explained the extraction of the analytes into the organic phase. The best model was then used to determine the diffusion constant and the saturation concentration.
Water samples
The optimized and validated SDME technique was applied in the analysis of three water samples from the
St. Bartholomew River. These samples were collected at two locations at the Federal University of Viçosa (Viçosa, Minas Gerais) and one location on the BR 482 highway between the towns of Viçosa and Porto Firme (Minas Gerais). Sample 1 was obtained at the capture point of the city’s water treatment station, sample 2 was collected at a point outside the city, and sample 3 was from an artificial stabilization pond along the course of the river. The water samples were fortified at two concentration levels (LOQ and 3×LOQ) for each pesticide, and the percentage recoveries were calculated.
Statistical analyses
The statistical analyses were performed using the Statistica software (version 8, StatSoft Corp., Tulsa, EUA).
Results and Discussion
Optimization of SDME experimental conditions
The SDME procedure was optimized by univariate evaluation of the agitation rate, the microdrop volume, and the microdrop exposure time. Agitation speeds of between 60 and 250 rpm were used with an exposure time of 30 min, in order to assess the stability of the microdrop at the needle tip. The microdrop was lost from the end of the needle at speeds exceeding 155 rpm. A speed of 155 rpm was therefore used in all subsequent experiments, because the extraction efficiency increases with the stirring speed. The pH variable was not evaluated, once pesticides studied did not present acid-base behavior. The absence of acid-base character of the compounds was confirmed through software online ACD-Lab23 and SPARC.24 Thus,
the extraction of these analytes were not significantly influenced by this variable.
Different microdrop volumes (1.4, 1.6, 2.0, and 2.4 µL) were exposed for a time of 20 min for extraction of the compounds. The extracts were then injected into the GC/ECD and the areas obtained for each compound were compared. No significant differences were observed in the chromatographic responses, using ANOVA at a 95% confidence level (Figure 2), and a volume of 1.6 µL was selected for use in the subsequent experiments, a described previously.25,26
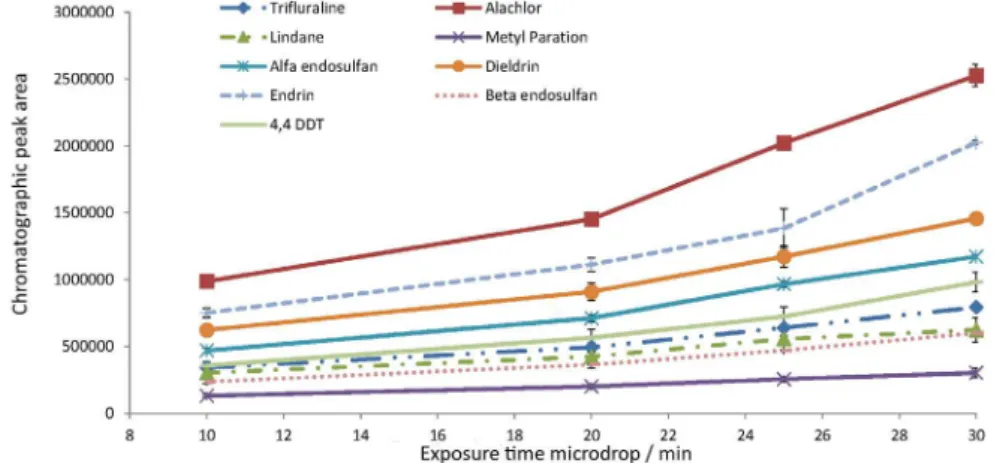
The effect of the exposure time of the drop was evaluated using deionized water samples spiked with pesticides at a concentration of 100 µg L−1. This
concentration was selected in order to ensure a good chromatographic response for each analyte. The 1.6 µL microdrop was exposed for different times (10, 20, 25, Figure 1. Chromatogram of a 30 µg L−1 standard solution of pesticides
30, and 35 min) in an attempt to determine the time required to achieve equilibrium between the organic and aqueous phases. However, it was observed that the areas of the chromatographic peaks increased progressively as the contact time was increased (Figure 3), showing that equilibrium was not reached. At exposure times ≥ 35 min, there was loss of the microdrop in the aqueous phase, so the maximum time was restricted to 30 min in all subsequent studies.
These results are in agreement with the findings of Carlos et al.,13 Cortada et al.,25 and Ahmadi et al.,26 who
found that the chromatographic response increased as a function of the exposure time of the microdrop.
Optimization of extraction solvent type, salt addition, and temperature, in terms of the chromatographic response, was carried out using the full 23 factorial design, in
triplicate. Analysis using Pareto charts (Figure 4) revealed that for most of the compounds, the effects of ionic strength and temperature were significant at the 95% confidence level (α < 0.05), while the effect of solvent type was not significant for any of the compounds studied. The efficiency of extraction decreased when the ionic strength was changed by adding NaH2PO4, and was also poorer at
the higher temperature (25 °C). The results for the addition
of salt to the sample are consistent with the findings of Carlos et al. for analysis of organochlorine,13 Ahmadi et al.
for analysis of organophosphorus,26 and Cordata et al. for
analysis of organochlorine compounds in water.25
The addition of salt to the sample usually increases the efficiency of extraction of polar compounds due to the increased ionic strength of the solution.27 However, adverse
effects have been observed for SDME.25,29 It is likely that
in addition to the “salting-out” effect, the presence of salt causes changes in physical properties such as the surface tension of the extraction phase, which could reduce the rate of diffusion of the analyte into the organic phase.
Analyte extraction was not significantly affected by the type of extraction solvent (n-hexane or toluene), so n-hexane was selected due to its lower solubility in water, which increases the stability of the microdrop. Similar findings were reported by Carlos et al.,13 for the
determination of trihalomethanes in water.
In the case of 4,4’-DDT, there was a significant positive effect of the second order interaction between the variables added salt and temperature, indicating that both factors should be used at the same level, whether positive or negative. Since there were significant negative (−) main effects, all subsequent tests used (−) levels of each factor.
Figure 2. Variation of the chromatographic peak area for each pesticide, according to the volume of the microdrop used in the SDME extraction.
Validation of the analytical method
Selectivity
About the chromatographic conditions used, the chromatograms obtained for the samples showed no interfering peaks at the retention times of the pesticides (Figure 5), when compared with the chromatograms for spiked sample at a concentration of 20 µg L−1, which
confirmed the satisfactory selectivity of the proposed method.
Linearity
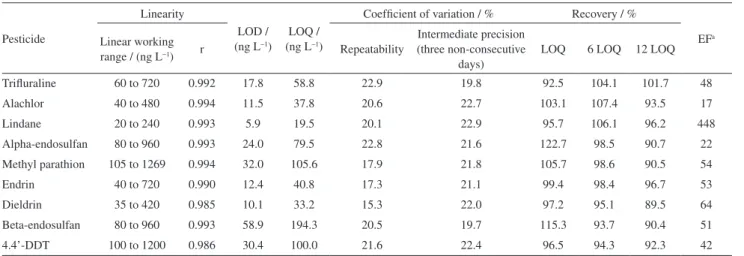
The linearity of the analytical method was evaluated by constructing curves with 5 points, measured in triplicate (n = 15). The linear regression correlation coefficients (r) ranged from 0.985 (dieldrin) to 0.994 (methyl parathion), indicating a good correlation between concentrations and peak areas (Table 3). Evaluation of the residuals graph confirmed the good fit.
Limits of detection and quantification
The minimum detectable concentrations were obtained from the signal/noise ratio by comparing the signals
measured for extracts obtained from water sample containing low analyte concentrations with that of the blank. This procedure is valid for analytical procedures that exhibit a baseline, and signal/noise ratios of 3:1 and 10:1 Figure 4. Pareto diagram for the factors adding salt, solvent extractor, and sample temperature for the pesticides.
Figure 5. Chromatograms of water samples (a) free sample contamination pesticides (b) sample fortified with pesticides at concentrations equal to 20 µg L−1: trifluraline (1); alachlor (2); lindane (3); methyl parathion (4);
are accepted as estimates of the detection and quantification limits, respectively. The values found for the detection and quantification limits ranged from 5.9 to 58.9 ng L−1 and
from 19.5 to 194.3 ng L−1, respectively (Table 3).
Higher quantification limits were found by Carlos et al.,13
for the compounds endrin (50 ng L−1) and lindane (30 ng L−1)
in water. The value for dieldrin obtained in the present work was higher than that found for the method proposed by Carlos (10 ng L−1),13 and lower than that reported by
Cortada et al. (74 ng L−1) for dieldrin in water.22 For methyl
parathion in water, the lowest value (3 µg L−1) was reported
by Pinheiro et al..29 For the compounds alpha-endosulfan,
beta-endosulfan, 4,4’-DDT, and endrin, the quantification limits found in the present study were lower than the values of 213, 237, 337, and 227 ng L−1, respectively, reported by
Cortada et al..23
Accuracy and precision
The accuracy of the method was investigated using recovery assays at three concentration levels (LOQ, 6×LOQ, and 12×LOQ). The percentage recoveries varied between 89.5 and 122.7% (Table3).
The precision of the analytical method was evaluated in terms of repeatability and intermediate precision. The repeatability of the SDME method for the pesticides in water samples was estimated by calculating the coefficient of variation of seven repetitions of the optimized methodology. This involved the preparation, injection, and analysis (on the same day) of seven extracts of reagent water fortified with the pesticides at concentrations equal to six times the limit of quantification of each compound (Table 3).
The intermediate precision of the method was established using the peak areas obtained for the analytes and the
corresponding coefficients of variation obtained from the preparation and analysis of extracts of reagent water fortified with pesticides at concentrations equal to six times the limit of quantification. These analyses were performed using the optimized extraction technique on three different days (1st,
3rd, and 7th day), with seven replicates (Table 3).
Even with a manual method, deviations obtained are always lower than 23%, which is the acceptable limit by Ministério da Agricultura, Pecuária e Abastecimento (MAPA)30 for this concentration range.
Enrichment factor
The enrichment factors were determined by constructing calibration curves using the concentrations of the pesticides in the solvent drop and the concentrations calculated for the water samples. The enrichment factors were mostly between 42 and 64 (Table 3), with the lowest values for alachlor (17) and methyl parathion (22), and a very high value for lindane (448), indicative of its very low affinity for the aqueous phase. The behavior of lindane can be explained by its low molecular weight and lack of oxygen atoms or other species able to promote solvation by water; these species are more prevalent in the polar groups of the other analyte.
Kinetics of transfer of the pesticides from the aqueous phase to the organic phase
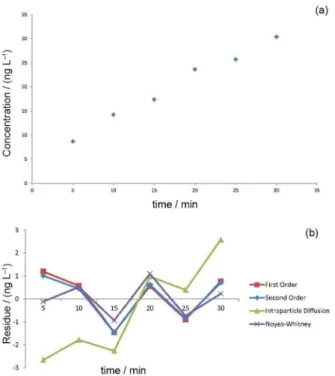
The first order, second order, intraparticle diffusion, and Noyes-Whitney diffusion models were applied in order to identify the model that best explained the transfer of the analytes from the aqueous sample to the n-hexane microdrop. An example is provided for lindane (Table 4).
Table 3. Main figures of merit for the validation of SDME method in water
Pesticide
Linearity
LOD / (ng L−1)
LOQ / (ng L−1)
Coefficient of variation / % Recovery / %
EFa
Linear working
range / (ng L−1) r Repeatability
Intermediate precision (three non-consecutive
days)
LOQ 6 LOQ 12 LOQ
Trifluraline 60 to 720 0.992 17.8 58.8 22.9 19.8 92.5 104.1 101.7 48
Alachlor 40 to 480 0.994 11.5 37.8 20.6 22.7 103.1 107.4 93.5 17
Lindane 20 to 240 0.993 5.9 19.5 20.1 22.9 95.7 106.1 96.2 448
Alpha-endosulfan 80 to 960 0.993 24.0 79.5 22.8 21.6 122.7 98.5 90.7 22
Methyl parathion 105 to 1269 0.994 32.0 105.6 17.9 21.8 105.7 98.6 90.5 54
Endrin 40 to 720 0.990 12.4 40.8 17.3 21.1 99.4 98.4 96.7 53
Dieldrin 35 to 420 0.985 10.1 33.2 15.3 22.0 97.2 95.1 89.5 64
Beta-endosulfan 80 to 960 0.993 58.9 194.3 20.5 19.7 115.3 93.7 90.4 51
4.4’-DDT 100 to 1200 0.986 30.4 100.0 21.6 22.4 96.5 94.3 92.3 42
The model fits were assessed using the coefficients of determination, the residual standard deviations (Sres), and
the residual plots generated for each kinetic model and each pesticide. The data obtained for lindane are illustrated in Figure 5. It was found that the Noyes-Whitney model gave the best fits for all the compounds, with higher values of R2 and lower values of the standard deviations of the
residuals. Graphical residual analysis showed that use of this model resulted in the lowest dispersion, compared to the other models. Nonetheless, the data obtained for alachlor, 4,4’-DDT, and dieldrin could not be explained by any of the models evaluated.
Table 5 shows the results for the kinetic constants (k), with the highest value for methyl parathion indicating that the transfer rate was fastest for this compound. There was an inverse relationship between the rate constant and the saturation concentration in the microdrop. The saturation concentration is the estimated concentration in
the microdrop when the time approaches infinity according to the equation provided by the fit of the kinetic model of diffusion Noyes-Whitney. The rate constant obtained for endrin was much lower, compared to the other compounds, and its equilibrium concentration was much higher.
Application of the analytical method using water samples
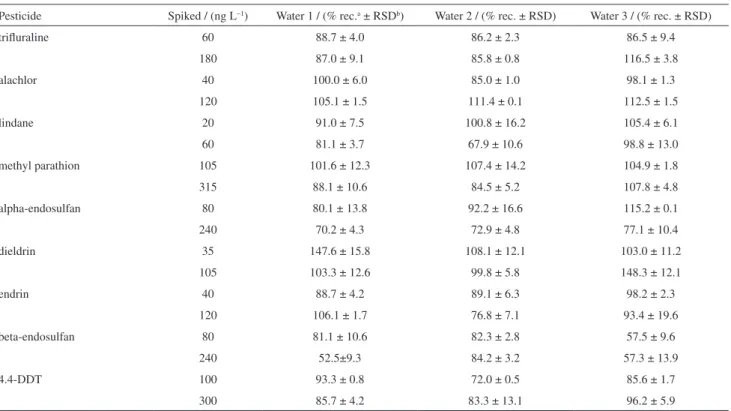
The procedure was applied for the analysis of three water samples collected in the city of Viçosa. The results showed that the samples were not contaminated by the pesticides. The possible existence of matrix effects during the extraction of the pesticides was investigated by fortifying the samples at levels equal to 1 and 3 times the limit of quantification of each pesticide.
For most analytes, the extraction recoveries ranged from 67.9 to 115.2% (Table 6), showing that the method is suitable for determination of pesticides in water samples. Exceptions were beta-endosulfan and dieldrin, which showed recoveries between 52.5 and 147.6% (for water samples 1 and 3). Differences between the values obtained in these experiments and those found in the validation procedure resulted from the use of concentrations that were closer to the LOQ of the method. These results are similar those obtained by Lambropoulou et al.,31 which
have higher coefficients of variation possibly attributed to the presence of organic matter and suspended solids in water samples. The small matrix effect observed for some compounds in the results can also be attributed to the Table 4. Equations, coefficients of determination, standard deviation of the residue and k values for the models studied for the pesticide lindane
Model Equation R2 s
res / (ng L−1) k / (min−1)
first order Y= 43.9(1 − e−kt) 0.97834 1.18 0.03734
second order Y= 69.485t/(0.0144k−1 + t) 0.98072 1.11 0.000357
intraparticle diffusion Y= 5.071 t0.5 0.92801 2.41 −
Noyes-Whitney Y= 75.977 − ( 72.517) e−kt 0.9846 0.86 0.01528
Table 5. Kinetic parameters obtained transfer material by the Noyes-Whitney model for pesticides in SDME
Pesticide
Saturation concentration /
(ng L−1)
k / (min−1) R2
trifluraline 69.71 0.0161 0.9897
lindane 75.98 0.0153 0.9846
alpha-endosulfan 23.04 0.0321 0.9531
methyl parathion 39.98 0.0418 0.9624
endrin 22125.83 1.99 × 10⁻⁵ 0.9457
beta-endosulfan 253.52 0.00716 0.9853
presence of organic matter and suspended solids present in the water samples.
Conclusions
A method based on single drop microextraction and gas chromatography was developed for the multiresidue analysis of pesticides in water. The technique offers low cost, reduced solvent volumes, and a small number of sample manipulation steps. The method was shown to be linear, selective, precise, and accurate, with a high enrichment factor and low limits of detection and quantification.
No evidence was found for the presence of the pesticides in samples of river water collected in Viçosa.
The kinetic model that best fit was broadcast Noyes-Whitney and kinetic constants for transfer of the analytes to the organic phase were inversely proportional to the saturation concentrations, and among the compounds investigated, methyl parathion showed the highest rate of transfer from the sample (aqueous phase) to the microdrop (organic phase), as well as the lowest saturation concentration.
Acknowledgments
To CAPES and FAPEMIG (CEX-APQ-01155-13), for financial support.
References
1. Labite, H.; Holden, N. M.; Richards, K. G.; Kramers, G.; Premrov, A.; Coxon, C. E.; Cummins, E.; Sci. Total Environ.
2013, 463-464, 432.
2. Ribeiro, M. L.; Lourencetti, C.; Pereira, S. Y.; Marchi, M. R. R. D.; Quim. Nova 2007, 30, 688.
3. Tournebize, J.; Passeport, E.; Chaumont, C.; Fesneau, C.; Guenne, A.; Vincent, B.; Ecol. Eng. 2013, 56, 51.
4. Tankiewicz, M.; Fenik, J.; Biziuk, M.; TrAC, Trends Anal. Chem.
2010, 29, 1050.
5. World Health Organization (WHO); Guidelines for Drinking-Water Quality, Geneva, 2011.
6. Rodrigues, A. M.; Ferreira, V.; Cardoso, V. V.; Ferreira, E.; Benoliel, M. J.; J. Chromatogr. A 2007, 1150, 267.
7. Latrous El Atrache, L.; Ben Sghaier, R.; Bejaoui Kefi, B.; Haldys, V.; Dachraoui, M.; Tortajada, J.; Talanta 2013, 117, 392. 8. Margoum, C.; Guillemain, C.; Yang, X.; Coquery, M.; Talanta
2013, 116, 1.
9. Raposo-Júnior, J. L.; Ré-Poppi, N.; Talanta 2007, 72, 1833. 10. Merib, J.; Simão, V.; Dias, A. N.; Carasek, E.; J. Chromatogr. A
2013, 1321, 30.
11. Chen, H.; Chen, R.; Li, S.; J. Chromatogr. A 2010, 1217, 1244. 12. Goulart, S. M.; Alves, R. D.; Neves, A. A.; de Queiroz, J. H.; de
Assis, T. C.; de Queiroz, M. E. L. R.; Anal. Chim. Acta 2010,
671, 41.
Table 6. Percentage of recovery for spiked water samples
Pesticide Spiked / (ng L−1) Water 1 / (% rec.a ± RSDb) Water 2 / (% rec. ± RSD) Water 3 / (% rec. ± RSD)
trifluraline 60 88.7 ± 4.0 86.2 ± 2.3 86.5 ± 9.4
180 87.0 ± 9.1 85.8 ± 0.8 116.5 ± 3.8
alachlor 40 100.0 ± 6.0 85.0 ± 1.0 98.1 ± 1.3
120 105.1 ± 1.5 111.4 ± 0.1 112.5 ± 1.5
lindane 20 91.0 ± 7.5 100.8 ± 16.2 105.4 ± 6.1
60 81.1 ± 3.7 67.9 ± 10.6 98.8 ± 13.0
methyl parathion 105 101.6 ± 12.3 107.4 ± 14.2 104.9 ± 1.8
315 88.1 ± 10.6 84.5 ± 5.2 107.8 ± 4.8
alpha-endosulfan 80 80.1 ± 13.8 92.2 ± 16.6 115.2 ± 0.1
240 70.2 ± 4.3 72.9 ± 4.8 77.1 ± 10.4
dieldrin 35 147.6 ± 15.8 108.1 ± 12.1 103.0 ± 11.2
105 103.3 ± 12.6 99.8 ± 5.8 148.3 ± 12.1
endrin 40 88.7 ± 4.2 89.1 ± 6.3 98.2 ± 2.3
120 106.1 ± 1.7 76.8 ± 7.1 93.4 ± 19.6
beta-endosulfan 80 81.1 ± 10.6 82.3 ± 2.8 57.5 ± 9.6
240 52.5±9.3 84.2 ± 3.2 57.3 ± 13.9
4.4-DDT 100 93.3 ± 0.8 72.0 ± 0.5 85.6 ± 1.7
300 85.7 ± 4.2 83.3 ± 13.1 96.2 ± 5.9
13. Carlos, E. A.; Alves, R. D.; de Queiroz, M. E. L. R.; Neves, A. A.; J. Braz. Chem. Soc. 2013, 24, 1217.
14. Xu, L.; Basheer, C.; Lee, H. K.; J. Chromatogr. A 2007, 1152, 184.
15. Zhang, M.; Huang, J.; Yu, W. B.; Yang, X.; Chen, X.; Talanta
2008,74, 599.
16. Amvrazi, E. G.; Tsiropoulos, N. G.; J. Chromatogr. A2009,
1216, 2789.
17. Amvrazi, E. G.; Tsiropoulos, N. G.; J. Chromatogr. A2009,
1216, 7630.
18. Chisvert, A.; Román, I. P.; Vidal, L.; Canals, A.; J. Chromatogr. A
2009, 1216, 1290.
19. Herrador-Aguilera, E.; Lucena, R.; Cárdenas, S.; Valcárcel, M.;
J. Chromatogr. A2008, 1209, 76.
20. Pena, F.; Lavilha, I.; Bendicho, C.; Spectrochim. Acta, Part B
2008, 63, 498.
21. Salemi, A.; Rasoolzadeh, R.; Nejad, M. M.; Vosugh, M.; Anal. Chim. Acta2013,769, 121.
22. ALOthman, Z. A.; Dawod, M.; Kim, J.; Chung, D. S.; Anal. Chim. Acta2012, 739, 14.
23. https://ilab.acdlabs.com/iLab2/ acessed in June 2014. 24. http://archemcalc.com/sparc.html acessed in June 2014. 25. Cortada, C.; Vidal, L.; Tejada, S.; Romo, A.; Canals, A.; Anal.
Chim. Acta 2009, 638, 29.
26. Ahmadi, F.; Assadi, Y.; Hosseini, S. M. R. M.; Rezaee, M.;
J. Chromatogr. A 2006, 1101, 307.
27. Psillakis, E.; Kalogerakis, N.; TrAC, Trends Anal. Chem. 2002,
21, 54.
28. dos Anjos, J. P.; de Andrade, J. B.; Microchem. J. 2013, 112, 119.
29. Pinheiro, A. S.; de Andrade, J. B.; Talanta 2009, 79, 1354. 30. Ministério da Agricultura Pecuária e Abastecimento; Manual
de Garantia da Qualidade Analítica, Ministério da Agricultura Pecuária e Abastecimento. Secretaria de Defesa Agropecuária, Brasília: MAPA/ACS, 2011.
31. Lambroupoulou, D. A.; Psillaks, E.; Albanis, T. A.; Kalogerakis, N.; Anal. Chim. Acta2004,516, 205.