doi: 10.1590/0101-7438.2016.036.01.0067
THE USE OF ARTIFICIAL INTELLIGENCE FOR THE PREDICTION OF PRODUCTIVITY PARAMETERS IN SWINE CULTURE
Luiz Fernando Sangoi
1, Alexandre de Mello Kessler
2,
Alvaro Luiz Neuenfeldt J´unior
3*, Julio Cezar Mairesse Siluk
3,
Andr´ea Machado Leal Ribeiro
2and Marlon Soliman
3Received September 28, 2014 / Accepted February 29, 2016
ABSTRACT.In similar conditions of food handling and genetics, there are large differences in the final productivity of farms, resulting from inherent factors of the production system. This fact predisposes the need of studies on optimizing the rearing conditions of the farms, in order to verify the main limitations for the producers. Therefore, the present study aims to generate predictions of the swine productivity in the finishing phase, using variables related to their profiles and the production results achieved. 107 farmers belonging to a swine cooperative were considered in the study, located in 47 counties at the Taquari valley region, Brazil. Predictions were generated through the aid of neural networks, and the findings show that Artificial Neural Networks (ANN) can predict the productivity variables Feed Conversion, Mortality and Average Daily Gain for the proposed case.
Keywords: swine culture, Artificial Neural Networks, competitiveness.
1 INTRODUCTION
Currently, swine meat is the most consumed protein in the world, being more than half of it pro-duced by China and the European Union (ABIPECS, 2013; USDA, 2010). Brazil occupies the fourth place with 3% of this production, a prominent place in relation to the global context, hav-ing an annual growth in production and export of approximately 10%, considerhav-ing the absolute numbers of the last ten years (ABIPECS, 2013).
According to the report 2012/13 of the Brazilian Association of Producers and Exporters of Swine Meat (Associac¸˜ao Brasileira da Ind´ustria Produtora e Exportadora de Carne Su´ına:
*Corresponding author.
1Col´egio Polit´ecnico, UFSM, Santa Maria, RS, Brasil. E-mail: [email protected]
2P´os-Graduac¸˜ao em Zootecnia, Universidade Federal do Rio Grande do Sul – UFRGS, Porto Alegre, RS, Brasil. E-mails: [email protected]; [email protected]
ABIPECS), in 2012, the international commerce in the sector dealt 5.81 million tons of meat, mainly exported to Japan, Russia, Ukraine, Mexico, South Korea and Hong Kong. Even strug-gling with sanitary barriers, the increase in European subsidies, and the increase in international competition, Brazil holds 10% of the market share, with approximate revenues of 1.49 billion dollars.
The swine culture is an important national zootechnics sector and presents one of the best eco-nomical performances in the international scenario. Technological and organizational advances in breeding, nutritional status, sanitary management, genetic quality and productivity of the herd are the main drivers which pose Brazil in this condition (Coelho et al., 2011; Costa et al., 2015). Even so, under similar conditions of diet and genetics, there are large differences in the final productivity of farms. This can be mainly associated to weather factors, management, and mate-rial and human resources, which turns complex the behavior of the swine culture concerning the optimization of the resources allocated.
Melo et al. (2007), Rodrigues et al. (2008), Pandorfi et al. (2011) and Vieira et al. (2010) re-ported that artificial intelligence, in particular Artificial Neural Networks (ANN), have been in-creasingly used in an attempt to more accurately assess which factors in the creation of animals can significantly contribute to increase productivity, in order to predict the main limitations of cooperative producers.
In view of the facts, this research aims to generate predictions of the productivity data: Feed Conversion, Mortality and Average Daily Gain rate of swine in the finishing phase, to producers belonging to a cooperative. These predictions were obtained from the variables related to their profiles and the production results achieved, with the aid of neural networks.
2 MATERIALS AND METHODS
The development of the research was realized through the fulfillment of eight methodological steps proposed by the authors, as shown in Figure 1. It was started by the contextualization regarding swine culture, performed based on the studies from Beattie et al. (2000), Ferreira (2012), Gonc¸alves & Palmeira (2006), Guivant & Miranda (2004) and Sangoi et al. (2015), whereby a consensus was reached that the profile of the national production system is heavily based on a vertical organizational structure. This is basically due to the vast size of the country, the production of key inputs (corn and soybeans), and the use of advanced technology. As a result, domestic production costs are lower than the main international competitors.
Figure 1– Methodological steps of the research.
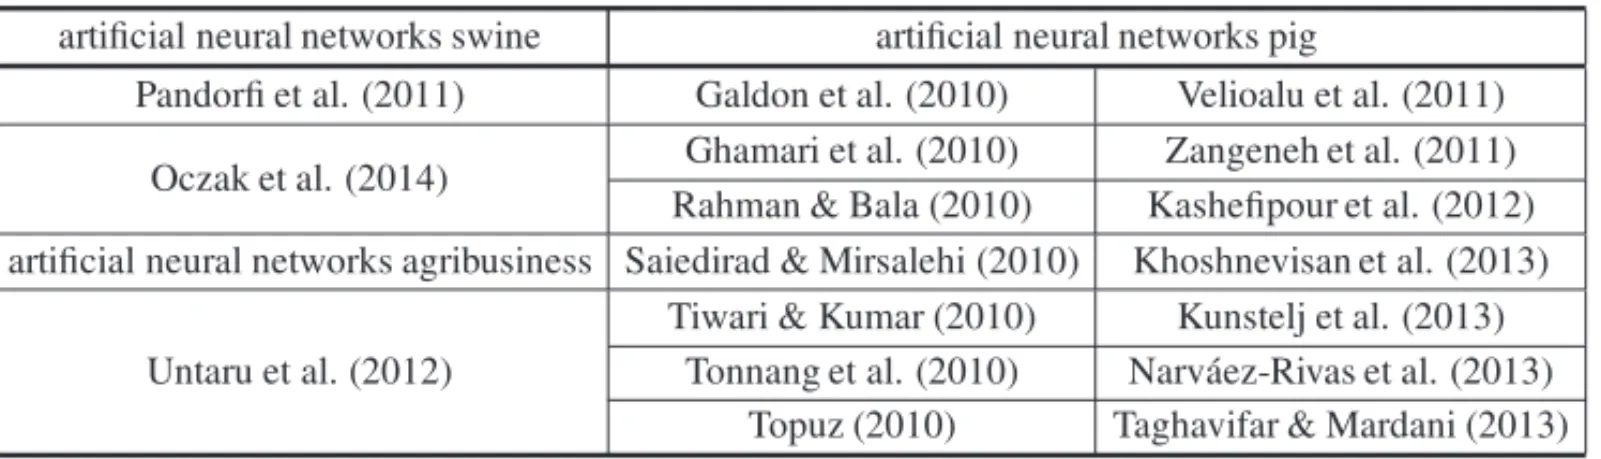
Table 1– Bibliographic survey of the most relevant scientific articles in the field.
artificial neural networks swine artificial neural networks pig
Pandorfi et al. (2011) Galdon et al. (2010) Velioalu et al. (2011)
Oczak et al. (2014) Ghamari et al. (2010) Zangeneh et al. (2011) Rahman & Bala (2010) Kashefipour et al. (2012) artificial neural networks agribusiness Saiedirad & Mirsalehi (2010) Khoshnevisan et al. (2013)
Tiwari & Kumar (2010) Kunstelj et al. (2013) Untaru et al. (2012) Tonnang et al. (2010) Narv´aez-Rivas et al. (2013)
Topuz (2010) Taghavifar & Mardani (2013)
Seventeen main articles were identified that generically address the issues of the theme, and none of them used artificial intelligence for the prediction of productivity parameters in swine culture. Therefore, this is one of the points that justify the present study.
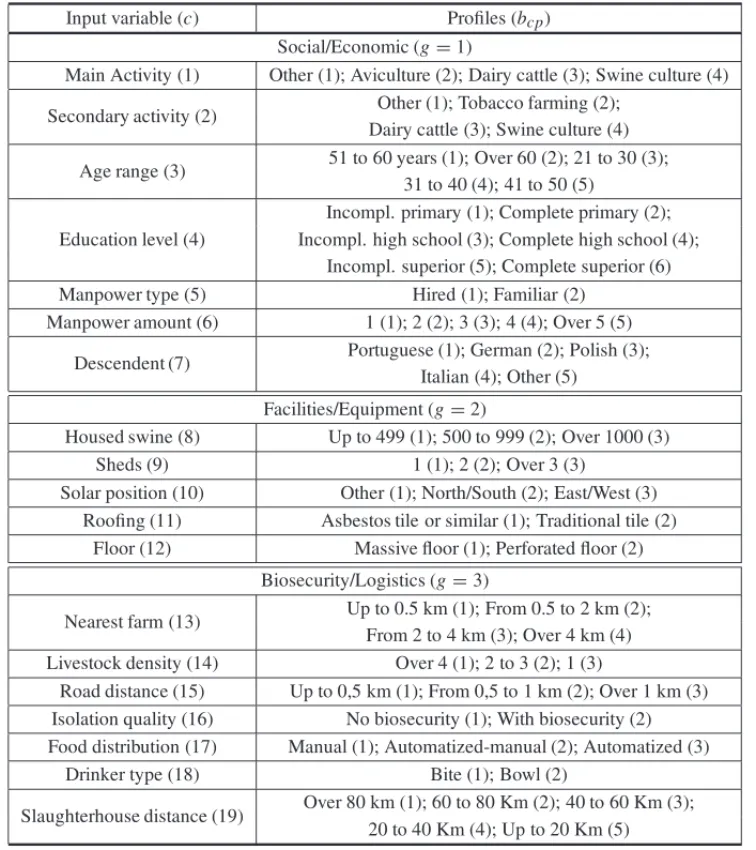
Later, we determined nineteen input(2)variables (c), where each one is consisted of a series of profiles (bcp), being divided into three groups (g), as shown in Table 2. This allows visualizing the results of the predictions in a more accurate way, based on the literature review and practical experience of the researchers involved. Thus, it is possible define the profile of each producer (p) according to the variables selected to be study.
Regarding the output variables, we selected three zootechnical data (s): Feed conversion (ct), Mortality (ms) and Average Daily Gain (ADG) (md), relative to the swine production corre-sponding to the producers of each profile.
Table 2– Input variable and its respective groups.
Input variable (c) Profiles (bcp)
Social/Economic (g=1)
Main Activity (1) Other (1); Aviculture (2); Dairy cattle (3); Swine culture (4)
Secondary activity (2) Other (1); Tobacco farming (2); Dairy cattle (3); Swine culture (4)
Age range (3) 51 to 60 years (1); Over 60 (2); 21 to 30 (3); 31 to 40 (4); 41 to 50 (5)
Education level (4)
Incompl. primary (1); Complete primary (2); Incompl. high school (3); Complete high school (4);
Incompl. superior (5); Complete superior (6)
Manpower type (5) Hired (1); Familiar (2)
Manpower amount (6) 1 (1); 2 (2); 3 (3); 4 (4); Over 5 (5)
Descendent (7) Portuguese (1); German (2); Polish (3); Italian (4); Other (5)
Facilities/Equipment (g=2)
Housed swine (8) Up to 499 (1); 500 to 999 (2); Over 1000 (3)
Sheds (9) 1 (1); 2 (2); Over 3 (3)
Solar position (10) Other (1); North/South (2); East/West (3) Roofing (11) Asbestos tile or similar (1); Traditional tile (2)
Floor (12) Massive floor (1); Perforated floor (2)
Biosecurity/Logistics (g=3)
Nearest farm (13) Up to 0.5 km (1); From 0.5 to 2 km (2); From 2 to 4 km (3); Over 4 km (4) Livestock density (14) Over 4 (1); 2 to 3 (2); 1 (3)
Road distance (15) Up to 0,5 km (1); From 0,5 to 1 km (2); Over 1 km (3) Isolation quality (16) No biosecurity (1); With biosecurity (2) Food distribution (17) Manual (1); Automatized-manual (2); Automatized (3)
Drinker type (18) Bite (1); Bowl (2)
Slaughterhouse distance (19) Over 80 km (1); 60 to 80 Km (2); 40 to 60 Km (3); 20 to 40 Km (4); Up to 20 Km (5)
first containing the observations for training (70% of the total), and the second used to test the network (30% of total).
Bicciato et al. (2003), Haykin (2008), Pandorfi et al. (2011) and Vieira et al. (2010), suggest that a previous statistical treatment of the data can result in improvements, especially when the extent of collected values is relatively large. Therefore, it was proposed the profilesbcp data standardization (N bcp) in discrete variables (4), described by Equation (1), according to the producers pcharacteristics as, in order to allow the application of the ANN,
N bcp=N bcmax− N b
cmax−N bcmin Tc−bcp
N bcmax ∝bcmax=1×10⁻⁴
in a manner that:
bcmax: Upper limit, according to the best profile value for criteriac; bcmin: Lower limit, according to the worst profile value for criteriac; N bcmax: Standardized and proportional value ofbcmax;
N bcmin: Standardized and proportional value ofbcmin; Tc: Sum of allbcpcontained in eachc.
Independently of the absolutebcp values found in each criteria, the same are standardized in order to be contained within the upper limit (N bcmax = 1×10⁻⁴) and the lower (N bcmin = 0.65×10⁻⁴), previously assessed to the application by the involved researches.
The determination of the structural characteristics of the ANN(5)follows the neural paradigm approach proposed according the feedfoward perceptron concepts and is distributed in multiple layers (Multilayer Perpetron). Each input variables are processed in intermediate layers, gener-ating the predictions used for comparison with the real values.
To minimize the errorEds, the backpropagation method was used to conceive the network learn-ing in a supervised way, enables the adjustment of synaptic weights and its respective level of bias, according to its intrinsic ability to reduce the error function of the system (Haykins, 2008). Also, we opted to use a total of three different network topologies: one input, one output and another intermediate, arranged in a hidden nonlinear manner, filled with a total of four neurons. Based on the results of various simulations, the activation function that returned the best accuracy was the hyperbolic tangent (γ
N bcp), both in the intermediate and output layers, calculated through Equation (2) according to Uykan et al. (2000),
γ
N bcp=t angh(N bcp)=
eN bcp−ecpN b
eN b cp +ecpN b
→γ
N bcp∈(−1,1) (2)
where:
eN bcp: Exponential value for profile data standardization (N bcp);
t angh(N bcp): Hyperbolic tangent value ofN bcp.
The upper and lower limits to theN bcp, converted to the tangent function, are contained within the interval−1 to+1, respectively. The verifications were separated into three parts, to allow individual viewing of how each input variable behaves. In the end, graphs were obtained to identify how much the estimates are distant to the real values provided.
To the training phase (6)70% of the researched universe was submitted to repeated stimulus coming from the parameters previously determined in its structural architecture, along with a list of weights randomly determined.
Concluded the network improvements, the prediction test(7)for the 30% remaining data served to verify the performance level of the network in real use situations. The last two methodological steps were conducted using the software SPSS Statistics 19, in specific its neural network interface.
Later, it was measured the accuracy of the different ANN architectures(8), calculating the sum of the squared errors (Eds), after processing the standard real input data (N bcp) and the output obtained according to the predictions (N′b
cp), as shown by Equation (3),
Eds = M
c=1 N
p=1
N bcp−N′bcp 2
(3)
where:
d: Index used to identify whether the measured set belongs to the test (d =1) or training (d =2); c∈ M: Criteriacselected according to allM options available in this study (M=19);
p∈ N: Profile pselected according to allNoptions available inside eachc; s: Type of output, equal toct,msormd.
In a general way, Equation (3) represents the sum of errors found between predictions, for all profiles and criteria used for this research. After the verification, it is expected that the result is comprised in the range between zero and 1.50 (0 < Eds ≤ 1.50), in accordance with the addressed context, so that the error does not deviate from a value considered as ideal for the prediction of producer profiles.
3 RESULTS AND DISCUSSION
3.1 Characterization of population
Inserted to the context of the 120 producers studied, the cooperative divide them into seven regions, disposing one exclusive technician to serve each region. In relation to the general char-acteristics of the producers, it is possible to affirm that approximately 96% of them are male, being 64% involved, principally, with activities directed to swine culture. This fact is considered normal, since many proprieties have conditions to realize multiple production activities. Regarding the education level, only 6.6% of the respondents are attending or already have an undergraduate degree, while 58.3% are found in the other extreme, of those who have completed or not the primary school.
Finally, about 56.6% of the producers are 41 to 60 years old. The sum of the values found on the extremes of the curve (21 to 30 and over 61 years) fulfills only 25.8% of the adopted universe.
3.2 Application of the ANN
Once these definitions were set, the network processing was performed. The first result observed was the summary of universe data available, in order to check if the split profile established in methodological step was processed correctly. The results generated are shown in Table 3. The training was conceived through the use of approximately 70% of the considered universe, having three exclusions for Feed conversion and one for Average Daily Gain (ADG). For the three exclusions, the consecutive repeat of the mean square error have been the responsible criteria for stopping the iterations cycles.
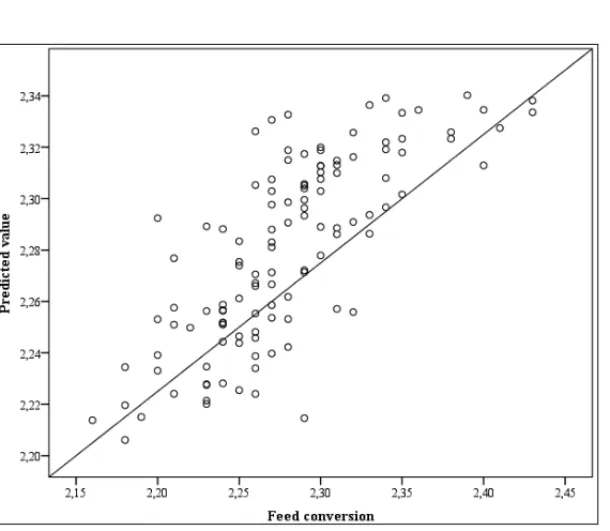
The predictions for Feed conversion remained in the range between 2.20 and 2.34, as shown by Figures 2 and 3. It was possible to observe that the squared errors may be considered as low significance, both to the test (E1ct=0.858) and to the training (E2ct=0.126). A polarization of the data occurred mostly (71%) in the quadrants located in the top of the trend line plotted by Equation (4), concentrated in central region of the graphic.
yct(N bcp)=0.5×N bcp+1.3 (4)
Figure 2– Predictions for Feed conversion.
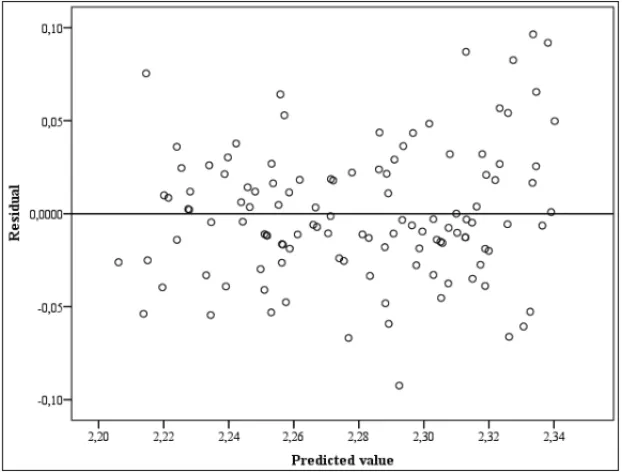
Figure 3– Residuals for Feed conversion.
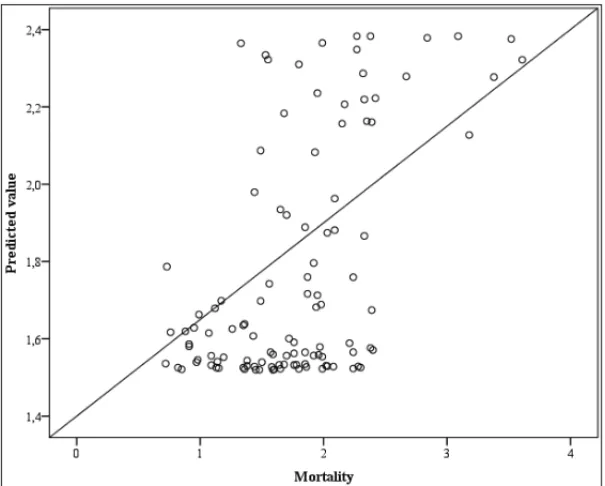
The predictions to Mortality remained in the range of 2% and 3%, as shown by Figures 4 and 5. It was perceived a polarization in the distribution of the data located in the left lower and top right quadrants, if considered the trend line proposed by Equation (5). A major concentration of values was found in the first (62%) in relation to the second (20%). This way, it was found that the established criteria strongly influence either of these two extremes.
ymd(N bcp)=0.5×N bcp+1.3 (5)
In the measurement of the error, the values to the test (E1ms =1.187), differently to the found for training (E2ms =0.357), does not approaches to zero, but it is still comprised in the range considered as acceptable.
To the residuals, there was again a major dispersion to the points located in the predictions farther than zero. The same recommended to the producers, where both to lowest (−1.2) and the uppermost (+1.4) are comprised in 2.2<ms <2.4, being possible to affirm that the worst performances are to those who presented higher inaccuracy.
To the predictions for Mean Daily Gain, these remained in the range between 0.855 g and 0.903 g, as shown by Figures 6 and 7. 85% of the values were found concentrated above the trend line of Equation (6), denoting a strong tendency of the producers in presenting a performance approxi-mately uniform. This fact is confirmed by the low variation of both the real data (0.04) and the predictions (0.10) to the normal distribution of the series.
Figure 4– Predictions for Mortality.
Figure 5– Residuals for Mortality.
Figure 6– Predictions for ADG.
Figure 7– Residuals for ADG.
4 CONCLUSION
According to the results obtained, the use of artificial intelligence can be considered feasible to predict the swine culture zootechnics parameters Feed conversion, Mortality and Average Daily Gain (ADG). The results obtained from the sum of the squared errors converged to values closer to zero, from the input criteria and output variables previously defined to the study.
The ANN allowed predicting productivity data, and to realize simulations to measure the behav-ior of each variable adopted in relation to the context.
It also serves for the managers in swine culture as a support tool, using only the profile in which the producers can be characterized to make decisions, according to the measurement criteria established and the outputs selected in the present analysis.
Therefore, there is no need to full scan the production data of producers, and the cooperative managers can reduce the analysis time of the potential production profile of each cooperated. For future studies, we expect to apply to the same universe of producers other techniques of prediction models, such as Autoregressive Integrated Moving Average (ARIMA), Autoregres-sive Conditional Heteroskedasticity (ARCH) and Generalized AutoregresAutoregres-sive Conditional Het-eroskedasticity (GARCH), in order to note whether these results in relation to ANN have con-vergence or not.
REFERENCES
[1] ABIPECS. 2013. Brazilian association of producers and exporters of swine meat ABIPECS Report 2012/2013 (Associac¸˜ao Brasileira da Ind´ustria Produtora e Exportadora de Carne Su´ına Relat´orio ABIPECS 2012/2013). Available in:<http://www.abipecs.org.br/pt/ documentos.html>[Accessed: Jun. 18, 2014].
[2] BEATTIEVE, O’CONNELLNE & MOSSBW. 2000. Influence of environmental enrichment on the behavior, performance and meat quality of domestic pigs.Livestock Prod. Sc.,65: 71–79.
[3] BICCIATOS, PANDINM, DIDONEG & DIBELLOC. 2003. Pattern identification and classification in gene expression data using an auto associative neural networks model.Biotechnology Bioengineer-ing,81(5): 594–606.
[4] COELHO L, L ´EGAE, MARTINS JR, MARQUESPA, SILVEIRA ALG & MENEZES MC. 2011. Semen quality evaluation and cortisol serum levels in two swine reproduces in different periods of the day.Nucleus Animalium,3(1): 17–30.
[5] COSTARP, SILUKJCM, NEUENFELDTJ ´UNIORA, SOLIMANM & NARAEOB. 2015. A gest˜ao da competitividade industrial por meio da aplicac¸˜ao dos m´etodos UP e multicrit´erio no setor frigor´ıfico de bovinos.Ingeniare. Revista Chilena de Ingenier´ıa (En l´ınea),23: 383–394.
[6] FERREIRARA. 2012. Swine culture: practical manual (Suinocultura: manual pr´atico de criac¸˜ao). Vic¸osa: Aprenda F´acil.
[8] GHAMARIS, BORGHEIAM, RABBANIH, KHAZAEIJ & BASATIF. 2010. Modeling the termi-nal velocity of agricultural seeds with Artificial Neural Networks.African Journal of Agricultural Research,5(5): 389–398.
[9] GUIVANTJS & MIRANDACR. 2004. Challenges to the sustainable development of swine culture (Desafios para o desenvolvimento sustent´avel da suinocultura). Chapec ´o: Editora Argos.
[10] GONC¸ALVESRG & PALMEIRAEM. 2006. Brazilian swine culture (Suinocultura brasileira).Revista Acadˆemica de Economia,71: 1.
[11] HAYKINSO. 2008. Neural networks and learning machines. Upper Saddle River: Prentice Hall.
[12] KASHEFIPOURSM, SADRMK & NASERIAA. 2012. Modelling drainage water salinity for agricul-tural lands under leaching using Artificial Neural Networks.Irrigation and Drainage,61(1): 99–106.
[13] KHOSHNEVISANB, RAFIEES, OMIDM, MOUSAZADEHH & SEFEEDPARIP. 2013. Prognosti-cation of environmental indices in potato production using Artificial Neural Networks.Journal of Cleaner Production,52: 402–409.
[14] KUNSTELJN, ZNIDARCICD & STERB. 2013. Employing Artificial Neural Networks and regression in analysis on knowledge about sweet potato (ipomoea batatas l.) in Slovenia.Italian Journal of Food Science,25(3): 263–274.
[15] NARVAEZ´ -RIVAS M, GALLARDO E, JURADO JM, VIERA-ALCAIDE I, PABLOS F & LEON´ -CAMACHOM. 2013. Application of Artificial Neural Networks to determine the authentication of fattening diets of Iberian pigs according to their triacylglycerol profiles.Grasas y Aceites, 64(2): 127–137.
[16] MELOB, MILIONIAZ & NASCIMENTOJ ´UNIORCL. 2007. Daily and monthly sugar price fore-casting using the mixture of local expert models.Pesquisa Operacional,27(2): 235–246.
[17] OCZAKM, VIAZZIS, ISMAYILOVAG, SONODALT, ROULSTONN, FELSM, BAHRC, HARTUNG J, GUARINOM, BERCKMANSD & VRANKENE. 2014. Classification of aggressive behaviour in pigs by activity index and multilayer feed forward neural network.Biosystems Engineering,119: 89(9).
[18] PANDORFIH, SILVAIJO, SARNIGHAUSENVCR, VIEIRAFMC, NASCIMENTOST & GUISELINI C. 2011. Use of artificial neural networks on the prediction of zootechnical indexes on gestation and farrowing stages of swines.Revista Brasileira de Zootecnia,40(3): 676–681.
[19] RAHMANMM & BALABK. 2010. Modelling of jute production using Artificial Neural Networks.
Biosystems Engineering,105(3): 350(7).
[20] RODRIGUESTB, MACRINIJLR & MONTEIROEC. 2008. Selec¸˜ao de vari´aveis e classificac¸˜ao de padr˜oes por redes neurais como aux´ılio ao diagn´ostico de cardiopatia isquˆemica.Pesquisa Opera-cional,28(2): 285–302.
[21] SAIEDIRADMH & MIRSALEHIM. 2010. Prediction of mechanical properties of cumin seed using Artificial Neural Networks.Journal of Texture Studies,41(1): 34(15).
[22] SANGOILF, KESSLER AM, SILUKJCM, NEUENFELDTJ ´UNIOR AL & RIBEIROAML. 2015. Uso da otimizac¸˜ao de desempenho interativa na identificac¸˜ao do perfil ideal de produtores termi-nadores de su´ınos.Revista Brasileira de Engenharia Agr´ıcola e Ambiental,35: 1809–4430.
[24] TIWARI MK & CHATTERJEEC. 2010. Agricultural and Food Engineering Department. Uncer-tainty assessment and ensemble flood forecasting using Bootstrap-based Artificial Neural Networks (BANNs).Journal of Hydrology,382(1-4): 20–33.
[25] TONNANGHEZ, NEDOREZOVLV, OWINOJO, OCHANDAH & L ¨OHRB. 2010. Host-parasitoid population density prediction using artificial neural networks: Diamondback moth and its natural enemies.Agricultural and Forest Entomology,12(3): 233–242.
[26] TOPUZA. 2010. Predicting moisture content of agricultural products using Artificial Neural Net-works.Advances in Engineering Software,41(3): 464–470.
[27] UNTARUM, ROTARESCUV & DORNEANUL. 2012. Artificial Neural Networks for sustainable agribusiness: a case study of five energetic crops.Agrociencia,46(4): 507–518.
[28] UYKANZ, GUZELISC, CELEBIME & KOIVOHN. 2000. Analysis of input-output clustering for determining centers of RBFN.IEEE Transactions on Neural Networks,11(4): 851–858.
[29] USDA. 2010. United States department of agriculture, Anual report USDA. Available in: <http://usdasearch.usda.gov/search?utf8=%E2%9C%93&affiliate=usda&query=Annual+report +2010&x=20&y=8&commit=Search>[Jun. 20, 2014].
[30] VELIOALUHM, BOYACIAH & KURULTAYS. 2011. Determination of visual quality of tomato paste using computerized inspection system and Artificial Neural Networks.Computers and Electronics in Agriculture,77(2): 147(8).
[31] VIEIRAFMC, SILVAIJO, BARBOSAFILHOJAD & VIEIRAAMC. 2010. Productive losses on broiler preslaughter operations: effects of the distance from farms to abattoirs and of lairage time in a climatized holding area.Revista Brasileira de Zootecnia,39: 2471–2476.