http://dx.doi.org/10.1590/1806-9061-2017-0649
Author(s)
Dogan NI Kaygisiz FI Altinel AI
I Istanbul University, Veterinary Faculty, De-partment of Animal Breeding and Husban-dry
Mail Address
Corresponding author e-mail address Nursen Dogan
Istanbul University, Faculty of Veterinary Medicine, Department of Animal Breeding and Husbandry, Avcilar, Istanbul, Turkey - Zip code: 34320.
Tel: (0090212) 4737070-17369 Email: [email protected]
Keywords
Data envelopment analysis, Economic analysis, Efficiency, Laying hens, Tobit regression.
Submitted: 03/October/2017 Approved: 17/November/2017
ABSTRACT
This study was carried out to determine the technical and economic efficiency levels of laying hen farms and factors affecting the efficiency scores. For this purpose, a personal interview was carried out. Technical and economic data of 39 laying hen farms consisting their inputs and outputs over the period 2013-2015 was formed the material of this study. Efficiency levels were estimated by using Data Envelopment Analysis (DEA).
Mean technical efficiency score of the enterprises were determined as 98.6%. Also 48.7% of the enterprises were determined fully technical efficient. On the other hand, mean economic efficiency of the enterprises was determined as 88.8%, while only 17.9% of the enterprises were fully economic efficient. In order to determine the factors affecting efficiency scores, Tobit regression analysis was performed. According to the analysis results, chick mortality rate, hen mortality rate and feed conversion ratio had negative effects on technical efficiency scores, while education level of the farmer and capacity utilization ratio had positive effects. Egg cost, chick mortality rate, feed conversion rate and production length had negative effect while egg yield had positive effect on economic efficiency. As a result, enterprises would increase their technical and economic efficiency scores by decreasing the mortality rate, feed conversion rate, production length. Furthermore, increasing capacity utilization ratio, education level of the owner and egg yield/ hen would help to increase efficiency levels of the farms.
INTRODUCTION
Animal production plays a critical role in supplying the nutritional needs of the community. In addition, this industry has a great economic importance as it provides business opportunities that support rural development as well as raw materials to industrial animal production enterprises (Sakarya & Uysal, 2000).The egg industry is an integral part of the agriculture, as it has completed its industrialization, produces high-quality outputs, provides employment opportunities and export facilities.
Profitability of an enterprise is determined by obtaining low-cost inputs and using resources efficiently, while supplying their output at good market conditions. Efficiency is a widely used concept in economics, and can be defined as firms’ success in producing as large as possible an output from a given set of inputs (Farrel, 1957). Efficiency can be expressed by three components: technical, allocative, and economic efficiency. Technical efficiency is the firms’ ability of producing maximal output from a given set of inputs, and measured by the ratio of outputs to inputs (Coelli, 1996). Allocative efficiency is the ability of the firm to use inputs in optimal proportions with given prices. Furthermore, economic efficiency of the firm is the combination of both the technical and allocative efficiency (Yolalan, 1993). For this reason, knowing production efficiency level has a great importance. Running efficiency analysis allows knowing the efficiency level of input use, and to take various precautions in order to prevent inefficiency (Yeni, 2012). Ratio analysis estimates the relationship between one output and various inputs, and both parametric analysis and non-parametric analysis can be used for efficiency analyses. These analyses have various advantages and disadvantages. To begin with, ratio analysis is simple to apply; however, it can only evaluate each factor separately, which makes difficult to interpret the result. On the other hand, parametric analysis evaluates efficiency by considering several inputs and one output within the frame of an analytic function. The reference line provided by parametric analysis is the mean values of the considered enterprises which does not represent the most efficient enterprises. Finally, non-parametric analysis (DEA) enables researchers to benchmark the enterprises in terms of their input utilization or output production by including various inputs and various outputs. The frontier which is formed by enveloping the inputs and outputs of the best producing enterprises represents the most efficient firms (Yolalan, 1991).
Around the world and in Turkey, efficiency scores have been estimated by various researchers. Begum et al. (2010) determined technical, allocative and economic efficiency scores of broiler farms in Bangladesh of 88%, 70%, and 72%, respectively, under constant return to scale, and of 89%, 73% and 66%, respectively, under variable return to scale. Those authors applied Tobit regression to analyze the factors affecting efficiency analyses, and determined that owners’ education and training levels were the variables that most affected efficiency scores. Hadley (2006) determined the efficiency level of agriculture, sheep, cattle, poultry
and pig farms by stochastic frontier analyses. Poultry farms were found to have the highest technical efficiency scores (0.89), while agriculture farms were observed as having the lowest. Between 1982-2002, the efficiency level of cattle and pig farms decreased 10%; however, no decrement in the efficiency level of poultry farms during this period. According to Hadley (2006), capacity, loans, age of farmer, level of specialization and ownership status influenced farm efficiency level. Keramidou & Mimis (2011) determined the technical efficiency level of poultry farms in Greece between 1994-2007 by double-bootstrap technique in order to achieve more robust results. Between 1994-2007, the technical efficiency scores of poultry sector in Greece decreased from 94% to 90%, and market size, productive flexibility, being a member of a firm group, enterprise capacity, and innovation activity of the firms were had significant and negative impacts on the efficiency scores. Yeni (2012) calculated the technical, allocative, and economic efficiency scores of 122 broiler farms located in East Marmara region using a non-parametric technique (DEA) 97.4%, 84.7%, and 82.5%, respectively. Yusuf & Malomo (2007) investigated the technical efficiency level and factors affecting the efficiency level of laying hen farms, and obtained an average score of 0.87. Moreover, those authors observed that efficiency scores depended on the capacity of the enterprises, obtaining scores of 0.86, 0.87, and 0.89 for small, medium and large-scale enterprises, respectively, and that owner’s experience and education level had positive and significant effects, while household size had a negative effect on efficiency level.
In Turkey, efficiency studies were conducted for broilers (Yeni, 2012), and beef and dairy cattle enterprises (Demircan et al., 2010; Gozener, 2013; Aydın et al., 2014). However, there are no studies on the efficiency level of laying hen enterprises. The aim of this study was to analyse the technical and economic efficiency of laying hen enterprises and determining the factors that have effect on efficiency by using data envelopment analysis.
MATERIAL AND METHODS
Data collection
enterprises and for 72.1% of the laying hen capacity in the Konya district. For the economic analysis, four groups were established according to enterprise capacity. Group 1 consisted of enterprises with 50,000 or less hens (n=10), group 2 of enterprises with 50,001-100,000 hens (n=8), group 3 of enterprises with100,001-250,000 hens (n=11), and group 4 of enterprises with250,001 or more hens (n=10).
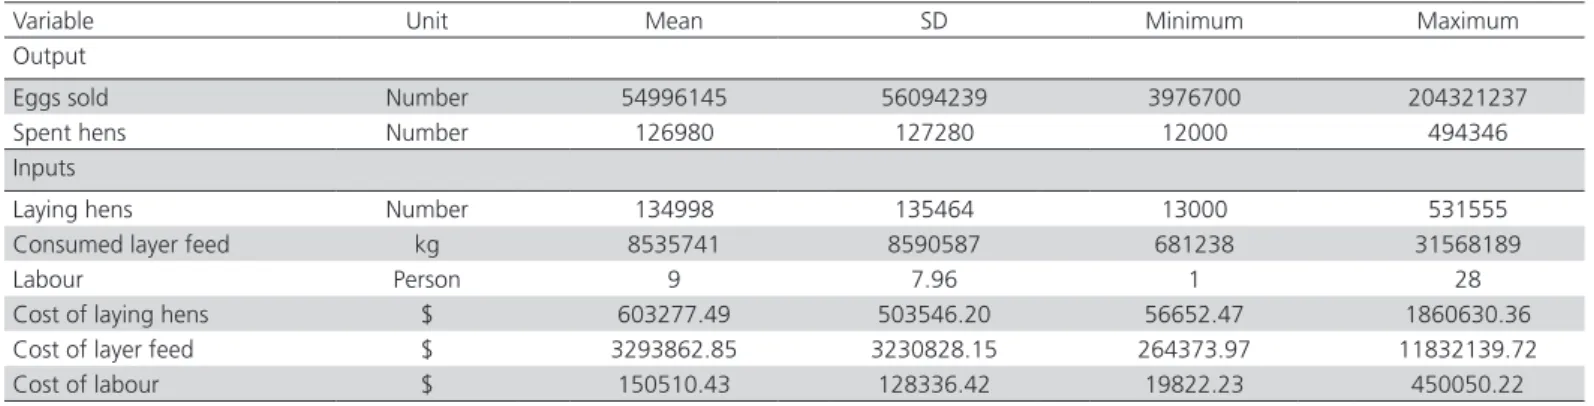
In the efficiency analysis, inputs that affect egg production, such as number of laying hens and its
economic value, layer feed intake (kg) and its economic value, and number of workers (labour) and its economic value were included in the DEA. The number of eggs sold and number of spent hens were considered as outputs (Begum et al. 2010).
Table 1 shows the descriptive statistics of inputs and outputs used to estimate the efficiency scores of the enterprises.
In the second stage of the analysis, factors affecting the efficiency scores were examined by investigating
Table 1 – Descriptive statistics of input and output variables used in the efficiency models.
Variable Unit Mean SD Minimum Maximum
Output
Eggs sold Number 54996145 56094239 3976700 204321237
Spent hens Number 126980 127280 12000 494346
Inputs
Laying hens Number 134998 135464 13000 531555
Consumed layer feed kg 8535741 8590587 681238 31568189
Labour Person 9 7.96 1 28
Cost of laying hens $ 603277.49 503546.20 56652.47 1860630.36
Cost of layer feed $ 3293862.85 3230828.15 264373.97 11832139.72
Cost of labour $ 150510.43 128336.42 19822.23 450050.22
some socio-demographic, management (production and welfare parameters) and economic factors, such as chick mortality rate, hen mortality rate, feed conversion ratio (FCR), production length, egg yield/hen, capacity utilization ratio, education level of the owner, owning another business, experience level of the owner, layer feed cost ($/hen), egg cost ($/egg).
Descriptive statistics of variables used in the Tobit regression analysis is shown in Table 2.
Table 2 – Descriptive statistics of variables used in the tobit regression analysis.
Variable Description Number Mean
Chick mortality rate % 33 3.26
Hen mortality rate % 39 5.94
Feed conversion ratio kg/kg 39 2.38
Production length week 39 78
Egg yield/hen N 39 411.88
Capacity utilization ratio % 39 84
Education statues 1: Primary Degree
2: Secondary Degree 3: High School 4: University 5: Vocational School
4 2 13 19 1
Owning another business 1:Yes
2:No
25 14
Experience 1: 1-10 years
2: 11-20 years 3: 21-30 years 4: More than 30 years
6 13 15 5
Layer feed cost $/hen 25.70
Egg cost $/egg 0.09
Economic analysis
In the scope of economic analysis, income and cost components, egg cost, net profit, profitability ratios and capital structure of the enterprises were determined (Açıl, 1977; Kıral et al. 1999; Müftüoğlu, 1999; Sarıözkan, 2005). Economic analysis was calculated in U.S. dollars. (U.S. dollar currency was taken as 1 $= 2.45 TL, in accordance with the currency rate reported by Agricultural Bank of the Republic of Turkey).
DEA Models
Data Envelopment Analysis (DEA) is a commonly-used linear programming-based technique to determine the efficiency scores of the enterprises (Charnes et al., 1978). The rationale of DEA is to obtain a best production frontier, which is formed by enveloping the inputs and outputs of the most efficient enterprise and compare enterprises only with the best production frontier. Enterprises on the production frontier are described as efficient while others are inefficient. In DEA, scores range between zero and one. The most efficient enterprises take the value of one, while inefficient enterprises take values lower than one.
input-based approach, performance is measured in terms of the ability of minimizing input quantities without any decrease in output level (Fare et al., 1994). When choosing the input- or output-oriented approach, the decision-maker should consider which quantities that the manager has the most control over (Coelli et al.,
2005). In agriculture, enterprises have the ability to control input utilization rather than controlling output quantity. Therefore, an input-oriented model was used in this study, similarly to most other studies on agriculture efficiency (Latruffe et al., 2005, Yusuf & Malomo, 2007, Kelly et al., 2012).
Furthermore, DEA enables researchers to make assumptions under the constant (CRS) and variable (VRS) returns to scale. Charnes et al. (1978) proposed the CRS model, which is input-oriented under constant return to scales. However, because increasing the amount of inputs generally does not cause a proportional increase in the output (Speelman, 2008), variable returns to scale were started to be considered (Banker et al., 1984) in efficiency analyses.
Mathematical Model
DEA was run using the input-oriented approach, and we assumed that, due to imperfect competition conditions, the sampled enterprises are not operating at optimal scale. Therefore, a variable return to scales (VRS) assumption was applied to the model (Cebeci, 2010, Demircan et al., 2010, Keramidou & Mimis, 2011). Under VRS, it is assumed that there are i farms using N inputs and producing M outputs, which is represented by ith farm by the vectors of xi and qi. In order to assume farms are not operating at optimal scale, I1’λ = 1, which is the convexity constraint, was included in the model.
Under the assumption of variable return to scales in order to determine the technical efficiency level of each enterprises (θVRS), the linear programming model listed below should be solved for each enterprise (Coelli et al., 2005):
Min θ,λθ,
Subject to -qi+Qλ ≥ 0, Θxi-Xλ ≥ 0 I1’λ = 1 λ ≥ 0, Where;
I1 is an I X 1 vector of ones,
Θ is a scalar,
λ is part of the convexity constraint that efficiency score is between 0 and 1.
In order to calculate the economic efficiency scores similarly to the above assumption, a mathematical model which calculates the cost minimization was used in this study (Coelli et al. 2005).
Min*λ,xiwi’xi*
Subject to -qi+Qλ≥0 xi*-Xλ≥0 I1’λ=1 λ≥0 Where;
W is an N X 1 vector of input prices for the ith farm, Xi* is the cost minimizing vector of input quantities for the ith farm with the input prices,
λ is an I X 1 vector of constraints.
In this study, efficiency analysis of the laying hen enterprises was determined using the DEAP 2.1 programme, developed by Coelli in 1996 (Coelli, 1996).
Second stage of analysis
In the second stage of analysis, factors affecting the efficiency scores of the enterprises were determined. Because the efficiency scores of the enterprises ranged between 0-1, the Tobit regression model was applied (Tobin, 1958).
RESULTS
Economic analysis
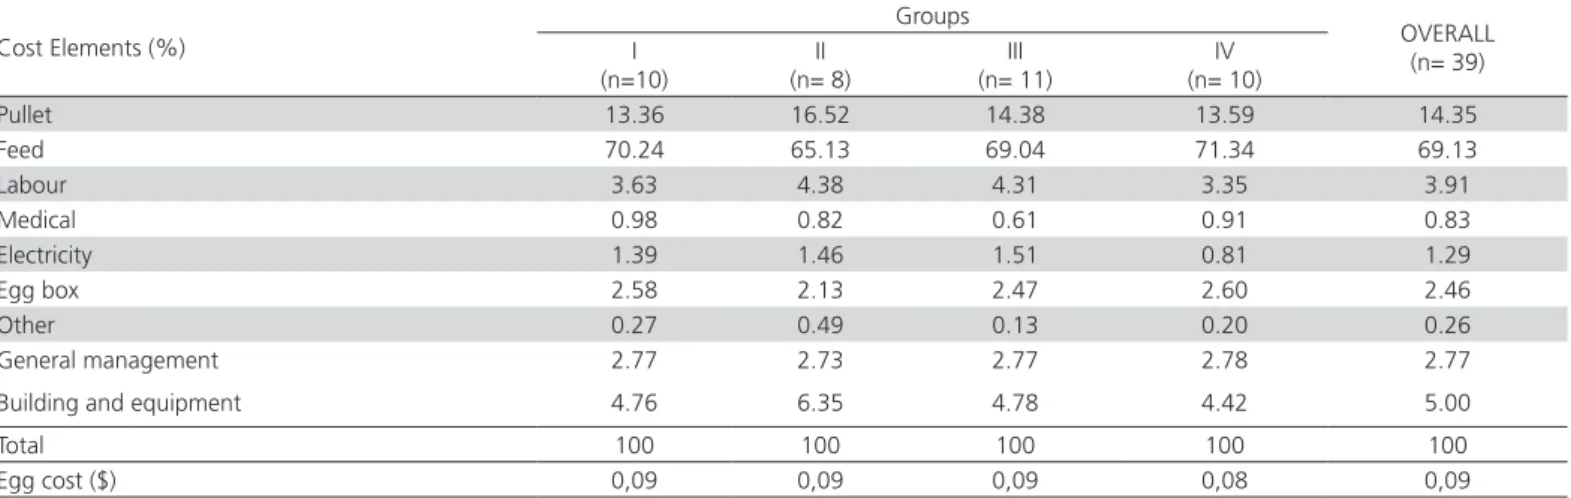
The distribution of cost elements and egg costs per group and overall is shown in Table 3. Feed cost was determined as the highest cost element (69.13%), followed by replacement pullet cost (14.35%), depretiation and repair cost of buildings/equipment (5.00%) and labour cost (3.91%). The lowest cost was found to be other costs (manure removal, credit interests, and insurance payment), amounting to 0.26%. Egg costs were determined as 0.09, 0.09, 0.09 and 0.08 ($) per egg on groups I, II, III and IV, respectively. Furthermore, overall egg cost/egg was determined as 0.09 ($).
ratio of 0.94, 0.91, 1.02, and 0.96 were determined for groups I, II, III, and IV, respectively.
Table 4 – Net profit, profitability ratios and output/input values of the enterprises.
I (n=10) II (n= 8) III (n= 11) IV (n= 10)
Net profit ($) -72503.57 -126272.81 88252.31 107956.38
Financial profitability -4.56 -7.58 1.47 0.83
Economic profitability 5.21 -10.93 7.58 1.40
Profitability ratio -5.59 -10.45 1.81 1.04
Output/input ratio 0.94 0.91 1.02 1.01
DEA analysis
The frequency distributions of technical and economic efficiency scores were shown in Table 5.
Table 5 – The frequency distributions of the efficiency scores.
Efficiency Scores TE* Distribution TE % EE** Distribution EE %
1.00 19 48.72 7 17.95
0.90-0.99 20 51.28 10 25.64
0.80-0.89 - 17 43.59
0.70-0.79 - 5 12.82
Mean 0.99 100 0.89 100
Minimum 0.95 0.71
Maximum 1.00 1.00
SD 0.02 0.07
*TE: Technical Efficiency **EE: Economic Efficiency
By taking into consideration the DEA results with respect to VRS, efficiency scores were clustered into 4 subgroups as 1.00 (efficient farms), 0.99-0.90, 0.89-0.80, and 0.79-0.70. The mean technical efficiency score of the farms was 0.99 and ranged between 0.95-1.00 (SD 0.02), and 48.72% (n=19) of the farms were determined as fully technically efficient. It was determined that the farms may produce on the efficient frontier if they decrease their input usage by 1% without any decrease on their outputs.
On average, the economic efficiency score was 0.89, ranging between 0.71 and 1.00 (SD 0.07), and 17.95% (n=7) of the enterprises were determined as economically efficient. In order to be economically efficient, farms should decrease their production costs by 11%.
The comparison of technical and economic efficiency scores of the farms is shown in Figure 1.
Figure 1 – Comparison of technical and economic efficiency scores of the enterprises.
All farms showed high technical efficiency scores, but different economic efficiency trends. Economic efficiency scores of the majority of farms were between 0.70 and 0.80.
Tobit regression analysis
The results of the Tobit regression analysis of technical efficiency scores, with significance levels, are given in Table 6.
Chick mortality rate, hen mortality rate, feed conversion ratio, capacity utilization ratio, and education level of the owner had significant effects on the technical efficiency scores. Education level of the owner and capacity utilization ratio had positive effects on the technical efficiency scores, while chick
Table 3 – Cost elements and egg cost of the enterprises and general.
Cost Elements (%)
Groups
OVERALL (n= 39) I
(n=10)
II (n= 8)
III (n= 11)
IV (n= 10)
Pullet 13.36 16.52 14.38 13.59 14.35
Feed 70.24 65.13 69.04 71.34 69.13
Labour 3.63 4.38 4.31 3.35 3.91
Medical 0.98 0.82 0.61 0.91 0.83
Electricity 1.39 1.46 1.51 0.81 1.29
Egg box 2.58 2.13 2.47 2.60 2.46
Other 0.27 0.49 0.13 0.20 0.26
General management 2.77 2.73 2.77 2.78 2.77
Building and equipment 4.76 6.35 4.78 4.42 5.00
Total 100 100 100 100 100
mortality rate, hen mortality rate, and feed conversion ratio had negative effects.
Table 6 – Factors affecting technical efficiency scores.
Variables Coefficient SE Z-Statistics P
Chick mortality rate -0.012 0.001 -11.108 0.021
Hen mortality rate -0.006 0.001 -5.459 <0.001
Feed conversion ratio -0.051 0.015 -3.392 0.002
Production length -7.22E-05 0.0008 -0.089 0.929
Egg yield/hen 0.0001 0.0001 0.889 0.374
Capacity utilization ratio 0.014 0.005 2.632 0.002
Education level 0.013 0.002 11.062 0.029
Owning another business -0.002 0.004 -0.444 0.657
Experience 0.001 0.002 0.627 0.531
Constant 1.094 0.040 27.295 0.000
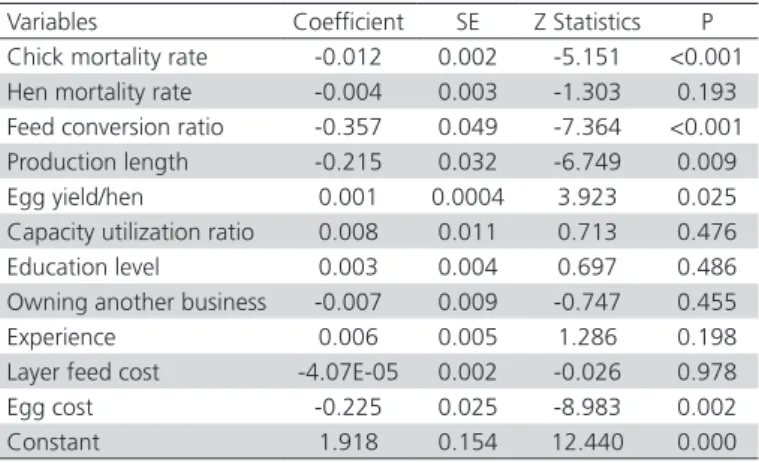
Table 7 represents the results of the regression analysis of the economic efficiency scores.
Chick mortality rate, feed conversion ratio, egg production length, egg yield/hen, and egg cost significantly influenced economic efficiency scores. Increasing egg yield had a positive effect on economic efficiency scores, while increasing egg cost, chick mortality rate, feed conversion ratio, and egg production length had negative effects.
Table 7 – Factors affecting the economic efficiency scores.
Variables Coefficient SE Z Statistics P
Chick mortality rate -0.012 0.002 -5.151 <0.001
Hen mortality rate -0.004 0.003 -1.303 0.193
Feed conversion ratio -0.357 0.049 -7.364 <0.001
Production length -0.215 0.032 -6.749 0.009
Egg yield/hen 0.001 0.0004 3.923 0.025
Capacity utilization ratio 0.008 0.011 0.713 0.476
Education level 0.003 0.004 0.697 0.486
Owning another business -0.007 0.009 -0.747 0.455
Experience 0.006 0.005 1.286 0.198
Layer feed cost -4.07E-05 0.002 -0.026 0.978
Egg cost -0.225 0.025 -8.983 0.002
Constant 1.918 0.154 12.440 0.000
DISCUSSION
Net profit values of -72,503.57, -126,272.81, 88,252.31, and 107,956.38 ($) were calculated for groups I, II, III, and IV, respectively, showing that groups I and II were suffering losses, while groups III and IV were making profit. The financial, economic, profitability, and output/input ratios were not satisfactory for any of the groups. In terms of the output/input ratio, only groups III and IV were at the onset of profit. Considering net profit, and financial, economic, profitability and output/input ratios, groups III and IV showed better results than the others. Durrani (2002) indicates that the capacity of the enterprise affects its net profit, with high-capacity enterprises have higher net profit than
low capacity enterprises. Sarıözkan (2005) and Çiçek
et al. (2008) found similar results, showing that low
capacity enterprises had negative financial, economic, profitability and low output/input ratios.
The results of the economic analysis indicate that the increase in egg price did not cover the increase in egg cost during the 2013-2015 period, which explains why none of the groups presented satisfactory results in terms of net profit, financial, economic, profitability and output/input ratios.
In this study, 48.72% of the enterprises were technically efficient. The mean technical efficiency score was determined as 98.6%. These results indicate that farms were able to lower their input utilization by 1.4% in order to be technically efficient. Technical efficiency scores of 95% and 98.7% were determined in broiler enterprises by Keramidou & Mimis (2011) in Greece and by Yeni (2012) in East Marmara, respectively. Despite minor differences, studies showed similar efficiency scores for poultry farms. According to Kelly et al. (2012), different production systems in different climatic and geographic conditions may have different efficiency scores. Also, other studies show that most enterprises do not operate efficiently. In order to produce efficiently, enterprises must be able to reduce their input utilization without any changes in output quantity, thus preventing wasting the limited sources available (Latruffe et al., 2005; Shortall & Barnes, 2013). Over used labour is highlighted by many researchers as a current or potential future problem (O’Donovan, 2007; Stokes et al., 2007; Kelly et al., 2012). Since farmers were not fully efficient, overused laying hens, layer feed and labour probably caused 51.28% of the farms to be inefficient in the present study.
A wider distribution of economic efficiency scores compared with the technical efficiency scores was observed. Most of the farms were clustered in the 0.8-0.9 range. The mean economic efficiency score was 88.8% and only 17.95% of the farms were economically efficient. Enterprises were able to reduce their input cost by 11.2% without any reduction in output level. Economic efficiency scores of the poultry farms were reported by Begum et al. (2010) as 66% and by Yeni (2012) as 82%. The differences between the economic efficiency scores among the studies may be caused different production costs in different regions.
efficiency scores points that farmers are having issues regarding minimizing the input costs. This is probably due to the absence of cooperatives, because the main objective of a cooperative is to supply low-cost inputs to the farmers. Another possible explanation of the low economic efficiency scores may be the low capital utilization ratios of the farms. Singh et al. (2001) mentioned that low capital utilization ratios results in the capital being overused, which leads to low economic efficiency scores. In this study, enterprises had unsatisfactory financial and economic ratio and profitability rate, resulting in low economic efficiency scores.
Purchased chicks constitute the live capital of the enterprises. High mortality rates causes low laying hen numbers at the onset of production, which directly affects capital utilization. Having low capital utilization causes capital overuse, and leads to low efficiency scores (Singh et al., 2001). In this study, chick mortality rate had a significant effect on technical and economic efficiency scores. An increase in chick mortality rate reduces both technical and economic efficiency scores of the farms. Therefore, in order to achieve profitable production, low mortality rates during the rearing and development periods is critical.
Hen mortality rate had a significant and negative effect on technical efficiency scores. Allendorf & Wettemann (2015) determined a negative relation between technical efficiency and mortality rate, and reported that preventing the mortality by 1%, technical efficiency would increase by 1.2%.
Feed conversion ratio is a commonly used indicator in animal production and can provide a good indication of feeding strategy efficiency (Toro-Mujica et al., 2011). As expected, feed conversion ratio had a significant and negative effect on the technical and economic efficiency scores of the enterprises. Numerical increments of the FCR reduce efficiency scores.
Egg production length had a significant effect on economic efficiency. The egg production period in laying hen farms may be extended by applying forced moulting, and allowing moulted hens to be used for a second production cycle. Generally, in the second production cycle, egg yield decreases and FCR increases due to the higher body weight and energy requirements of the hens (North, 1978). This situation directly affects input and output amount. Therefore, production length has a negative effect on the economic efficiency scores.
While egg yield did not significantly influence technical efficiency scores, it had a significant
and positive effect on economic efficiency scores. Enterprises with the high egg yield showed higher economic efficiency scores. Allendorf & Wettemann (2015), Shortall & Barnes (2013), Toro-Mujica et al.
(2011) found that efficiency scores increased with production yield.
Technical efficiency is the physical efficiency during the process of transformation of inputs into output, and includes both the capacity utilization ratio and the technological development of the enterprise (Avcı, 2004). Therefore, as expected, the capacity utilization ratio had a significant and positive effect on the technical efficiency scores.
Education level, owning another business and experience were considered as socio-demographic factors in the efficiency analysis. Educated farmers maximize the utilization of production factors by avoiding the waste of resources (Latruffe et al.
2005). As expected, education level of the owner had a significant and positive effect on the technical efficiency score, in agreement with the findings of Begum et al. (2010) and Hassanpour (2012). In the current study, owning another business did not influence the efficiency scores, as shown by Yusuf & Malomo (2007). Experience had no significant effect on the efficiency scores, which is consistent with the findings of Shortall & Barnes (2013), Yin et al. (2014), and Lansink & Reinhard (2004).
Layer feed cost/hen was expected to have a significant effect on the economic efficiency score, since cost-minimizing strategies contribute to higher economic efficiency (Jones, 2000). However, in this study, no significant effect of layer feed cost/hen was detected. Similarly, Omar (2014) did not find any significant effect of feed cost on the economic efficiency of broiler enterprises. Even though the feed cost accounts for the largest proportion of egg cost, it may not affect the economic efficiency by itself. Therefore, we also investigated the effect of egg cost on economic efficiency, and found it had a significant and negative effect. Since profit variability is strongly related to production cost variability per unit, which has been shown to be related to economic efficiency, enterprises that have lower egg cost have higher economic efficiency scores and vice versa (Jones, 2000).
while only 17.95% were economically efficient. Chick and hen mortality rates, feed conversion ratio, capacity utilization ratio, and education level of the owner had significant effects on technical efficiency. Egg production cost, chick mortality rate, feed conversion ratio, production length, and egg yield affected the economic efficiency.
In the study, it was shown that farmers were not experiencing any difficulties with optimal utilization of inputs. However, minimizing input costs is an issue. Reducing chick and hen mortality rates and production length, improving feed conversion ratio, and increasing capacity utilization ratio, egg yield, and education level of the owner increase the efficiency scores. The results of this study provide an insight to policy makers regarding inefficient poultry farms and how efficiency scores can be improved. As mentioned before, measures to reduce egg cost should be taken to increase the economic efficiency of the farms. Furthermore, animal health, management, and nutrition practices to improve the welfare conditions of the hens and improving feed quality must be considered in order to increase efficiency scores.
ACKNOWLEDGEMENTS
Authors would like to thank the farmers who participated in this study. Also to Dr Bouda V. Ahmadi and P. Dilara Akin for their contributions on this study. The present study was supported by the Scientific Research Projects of Istanbul University (BAP/project no. 53818).
REFERENCES
Açıl AF. Calculation the costs of agricultural production and improvements regarding the agricultural production in our country [scientific research and examination, 91]. Şark Matbaası: Ankara University Faculty of Agriculture; 1977.
Allendorf JJ, Wettemann PJC. Does animal welfare influence dairy farm efficiency? A two stage approach. Journal of Dairy Science 2015;98:1-10.
Avcı B. Relative efficiency measurement approach among enterprises: Data envelopment analysis and its application [thesis]. Bursa (TR): Uludag University, Business and Administration Department; 2004.
Aydın E, Yeşilyurt C, Sakarya E. Measuring the performance of cattle fattening enterprises with data envelopment analysis: Comparative analysis of enterprises in the Northeast Anatolia Region (TRA) between the years 2009-2010. Journal of the Faculty of Veterinary Medicine, Kafkas University 2014;20: 719-725.
Banker RD, Charnes A, Cooper WW. Models for the estimation of technical and scale inefficiencies in data envelopment analysis. Management Science 1984;30:1078-1092.
Begum IA, Buysse J, Alam MJ, Huylenbroeck GV. Technical, allocative and economic efficiency of commercial poultry farms in Bangladesh. World’s Poultry Science Journal 2010;66:465-476.
Cebeci T. Production efficiency, profitability status and marketing structure for cultivate ornamental plants in Samsun provinces [thesi]. Samsun (TUR): Ondokuz Mayıs University, Institute of Science; 2010.
Charnes A, Cooper WW, Rhodes E. Measuring the efficiency of decision making units. European Journal of Operational Research 1978;2(6):429-444.
Çiçek H, Günlü A, Tandoğan M. The factors affecting profitability in layer hen enterprises in Southern West Region of Turkey. Journal of Food Agriculture and Environment 2008;62(2):286-289.
Coelli T. A guide to DEAP version 2.1. A data envelopment analysis (Computer) program [CEPA Working Paper, 8/96]. Armidale (AUT): University of South Wales; 1996.
Coelli TJ, Prasada Rao DS, O’Donnell CJ, Battese GE. An introduction to efficiency and productivity analysis. 2nd ed. New York: Springer; 2005.
Demircan V, Yılmaz H, Dernek Z, Bal T, Gül M, Koknaroglu H. Economic analysis of different laying hen farm capacities in Turkey. Agricultural Economics 2010;56(10):489-497.
Durrani MF. Production performance and economic appraisal of commercial layers in district Chakwal [thesis]. Peshawar (PK): Faculty of Animal Husbandry and Veterinary Sciences, NWFP Agricultural University; 2002.
Fare R, Grosskopf S, Lovell CAK. Production frontiers. Cambridge: Cambridge University Press; 1994.
Farrel MJ. The measurement of productive efficiency. Journal of the Royal Statistical Society 1957;120(3):253-290.
Gozener B. Economic analysis and technical efficiency of cattle breeding enterprises in TR83 region [thesis]. Gaziosmanpasa (TUR): University Institute of Science, Department of Agriculture Economics; 2013.
Hadley D. Patterns in technical efficiency and technical change at the farm-level in England and Wales, 1982-2002. Journal of Agricultural Economics 2006;57(1):81-100.
Hassanpour B. Factors affecting economic efficiency of sheep fattening industries in Fars Province, Iran. Annals of Biological Research 2012;3(11):5296-5303.
Jones R. Cost, distribution of cost, and factors influencing profitability in cow-calf production: a report on research conducted under contract with the Research Institute on Livestock Pricing. Manhattan: Kansas State University; 2000.
Kelly E, Shalloo L, Geary U, Kinsella A, Thorne F, Wallace M. The associations of management and demographic factors with technical, allocative and economic efficiency of Irish dairy farms. Journal of Agricultural Science 2012;150:738-754.
Keramidou I, Mimis A. An application of the double-bootstrap data envelopment analysis to investigate sources of efficiency in the Greek poultry sector. World’s Poultry Science Journal 2011;67:675-686.
Kıral T, Kasnakoğlu H, Tatlıdil F, Fidan H, Gündoğmuş E. A guide for calculation methodology of agricultural products (publications 37]. Sofia (BUL): Institute of Agricultural Economic Research; 1999.
Lansink AO,Reinhard S. Investigating technical efficiency and potential technological change in Dutch pig farms. Agricultural Systems 2004;79(3):353-367.
Latruffe L, Balcombe K, Davidova S, Zawalinska K. Technical and scale efficiency of crop and livestock farms in Poland: Does specialisation matter? Agriculture Economics 2005;32:281-296.
Müftüoğlu, T. Business economics. 3rd ed. Ankara: Turhan Publications; 1999.
North MO. Commercial chicken production manual. 2nd ed. Oceanside: Avi Publishing Company; 1978.
O’Donovan K. Labour efficiency on Irish dairy farms [tthesis]. Dublin (IRL): University College; 2007.
Omar MAE. Technical and economic efficiency for broiler farms in Egypt. Application of data envelopment analysis (DEA). Global Veterinaria 2014;12(5):588-593.
Sakarya E, Uysal G. Measures to be considered in the livestock sector during the European Union/Turkey nomination process. Agriculture Congress; 2000; Kızılcahamam, Ankara. Turkey.
Sarıözkan, S. Profitability and productivity analysis in laying hen enterprises in Afyon district [thesis]. Ankara (TUR): Ankara University, Institute of Health Sciences, Department of Animal Health Economics and Industry; 2005.
Shortall OK ,Barnes AP. Greenhouse gas emission and the technical efficiency of dairy farmers, Ecological Indicators 2013;29:478-488.
Singh S, Coelli T, Fleming E. Performance of dairy plants in the cooperative and private sectors in India. Annals of Public and Cooperative Economics 2001;72(4):453-479.
Speelman S, D’Hase M, Buysse J, D’Haese L. A measure for the efficiency of water use and its determinants: a case study of small scale irrigation
schemes in North-West Province, South Africa. Agricultural Systems 2008;98:31-39.
Stokes JR, Tozer PR, Hyde J. Identifying efficient dairy producers using data envelopment analysis. Journal of Dairy Science2007;90(5):2555-2562.
Tobin J. Estimation of relationships for limited dependent variables. Econometrica 1958;26(1):24-36.
Toro-Mujica P, Garcia A, Gomez-Castro AG, Acero R, Perea J, Rodriguea-Estevez V, et al. Technical efficiency and viability of organic dairy sheep farming systems in a traditional area for sheep production in Spain. Small Ruminant Research 2011;100(2-3):89-95.
TSI. Poultry production data [cited 2017 Apr 04]. 2015. Available from: https://biruni.tuik.gov.tr/medas/?kn=80&locale=tr.
Yeni A. Economic structure and efficiency analysis of production coops in the Turkish broiler sector: East Marmara Case. [thesis]. Erzurum (TUR): Ataturk University, Institution of Science, Department of Agriculture Economics; 2012.
Yin X, Wang A, Zhou H, Wang Q, Li Z, Shao P. Economic efficiency of crucian carp (Carassius auratus gibelio) polyculture farmers in the coastal area of Yancheng city, China. Turkish Journal of Fisheries and Aquatic Sciences 2014;14: 429-437.
Yolalan R. Non-parametric efficiency measures and data envelopment analysis. Proceedings of the 1° Productivity Congress; 1991; Ankara (TUR): Centre of National Productivity Publication; 1991.
Yolalan R. Relevant efficiency measurement among the enterprises [MPM Publications, 483] Ankara; 1993.