1. Introduction
Logistics acts as an important tool in the search for sustainable competitive advantage in the international trade (Fleury, 2006). Regarding the Brazilian GDP, studies from the Logistics and Supply Chain Institute - 2011 shows that logistics costs account for up to more than 20% compared to countries considered rich; notably, points out to Brazil with 10.6% and United States with 7.7% (Logistics and Supply Chain Institute, 2008). In parallel, storage processes, distribution and the storage of perishable products evolve the logistics operations that can be considered the main problems’ focus faced by Brazil (Franco, 2011).
From the second half of the last century, it was possible to note a rapid logistics efficiency increase. It can be said that the high standard of living offered to Western society demands from production systems, products handling process and delivery to the final consumer, a good performance. Over the years, it is remarkable the transition that has been passing logistics, more specifically regarding the production, storage and handling operations (Sussams, 1994). Currently, the logistics, which involves a number of activities ranging from materials entry, going through internal transport, output and, more recently, to reverse or materials recycling, has presented increasingly growing interest among managers (Machline, 2011).
Within agribusiness production chains, logistics also plays an important strategic role (Bourlakis & Weightman, 2004; van der Vorst et al., 2005; Duffy & Fearne, 2006; Pieter van Donk et al., 2008; Logistics and Supply Chain
Grain intermodal terminals: evaluation of pure
technical efficiency by Data Envelopment Analysis
Maria Gabriela Mendonça Peixotoa*, Maria Cristina Angélico Mendonçab,
Marcel Andreotti Musettic, Mario Otavio Batalhad, Renato Luiz Sproessere
aUniversidade Federal de Viçosa, Rio Paranaíba, MG, Brasil bUniversidade Federal de Lavras, Lavras, SP, Brasil cUniversidade de São Paulo, São Carlos, SP, Brasil dUniversidade Federal de São Carlos, São Carlos, SP, Brasil eUniversidade Federal do Mato Grosso do Sul, Cuiabá, MS, Brasil
Abstract
This paper aimed to verify if terminals with productive efficiency also have pure technical efficiency, using DEA (Data Envelopment Analysis) technique. The research approach was the qualitative-quantitative or mixed, with exploratory purpose; the research method defined was the case study (multicases); data were collected through interviews using a structured questionnaire and non-probability for convenience sampling. While the application of Charnes, Cooper and Rhodes (CCR) model observed that only three (4, 7 and 11), of the twelve analyzed Decision Making Units (DMUs) have total technical efficiency, through Banker, Charnes and Cooper (BCC) model, it was possible to observe that these terminals were the only ones with pure technical efficiency. The three inefficient DMUs (1, 2 and 12) showed pure technical efficiency, suggesting that these terminals might present probable scale operations’ inefficiency, aspect not addressed in this paper.
Keywords
Logistics. Intermodal. Grain logistic chain. Transport. Data envelopment analysis.
Institute, 2014; Soliani et al., 2016; Bloemhof et al., 2015). In view of the context outlined by grain supply chains, considering the role played by Southeastern region high productivity comes up intermodal terminals. Some peculiarities give to grain terminals that characteristic profile they present. It is also importante to emphasize the necessary presence of moisture and temperature gauges to grains monitoring, due to consumption patterns, and the influence of climatic conditions that may eventually preclude a terminal to meet particular customer. Some other complementary logistics activities that can be performed by grain terminals refer to pre-cleaning and cleaning processes, purging, drying, blending and segregating (transgenic and organic separation).
Being considered an important logistical operator, terminals operate in the transportation optimization process performed by different modes. Thus, this study hopes to contribute to improving the performance of intermodal terminals in grain logistics’ chains and, therefore, with the increasing of Brazilian competitiveness in grains supply. To do so, it also aimed to determine if terminals with productive efficiency also present pure technical efficiency, through Data Envelopment Analysis technique. Thereby, it was examined whether greater efficiency can be obtained regarding the use of the structure and available resources in grain supply chain intermodal terminals.
This paper is divided into six sections. Starting with the introduction, it follows to the theoretical framework, which provides a brief presentation about the main concepts involving all the grain flow dynamic. Hereafter, this paper presents the methodological procedures defined for the results’ achievement and finally ends with the conclusions and references.
2. Theoretical framework
This part of the paper presents some fundamental concepts for the effective understanding of intermodal terminals’ reality. In this section, the intermodality concept is contextualized and a characterization of grain logistics is proposed.
2.1. Transport modes
The following sections present, in a more detailed way, the transport modes that stand out in relation to grains transport. Within inland transport, there are the road and rail subsystems. In the context of waterways or water transport, it should be highlighted the subsystems, river, lake and sea. However, it is noteworthy that, unlike the waterway subsystem, inland transports are going to be treated separately, since they have radically different characteristics. Considering that this fact is hardly observed for transportations on waterways, this subsystem is going to be treated, in this paper only, considering the general characteristics inherent to water transport.
2.1.1. Roadway subsystem
The transport system in Brazil has been marked by a late process of road construction. Thus, throughout the 1930s, as well as the 1950s and 60s, the Brazilian highway network has been favored by governamental interests in developing the interior of the country and by the emergence of automobile industries. As a result, roadways became the main transport subsystem in Brazil (Confederação Nacional do Transporte, 2006).
The road system stands out for some specific characteristics, such as the process of door-to-door delivery and the deployment of minimum stocks, through the use of pull (just in time) systems, which allow faster turns (Barat, 2007; Janic, 2008). According to Severo Filho (2006), the Brazilian road transport handled 58% of the total cargo volume in the country, twice as much as Australia and the USA, with 30% and 28%, respectively, and three times more than China, with a percentage of 19%. It is possible to observe the prevalence in the use of railroads and waterways in this group of countries, as well as in Russia and Canada, (Fleury, 2006). More recently, it can be considered that 62.70% of the entire Brazilian cargo is handled via road transportation (Logistics and Supply Chain Institute, 2010).
Among the advantages offered by the roadway subsystem, Bowersox et al. (2006) and Sadjady (2011) highlight the flexibility and versatility, as well as Singh et al. (2008) also emphasize aspects such as reliability and adaptability. The character flexibility of this mode directly affects the two main points inherent in the start and the end point of the logistics freight management, i.e. the processes of cargo reception and delivery. On the other hand, the character versatility, taking into account possible restrictions on the proportions of cargo, refers to the extent to which the roadway mode enables the handling of a wide range of different products (Bowersox et al., 2006).
As suggested by Bowersox et al. (2006), this type of transport comprises a whole range of special requirements that meet the characteristics of the goods to be moved. Thus, the roadway transport operates, among the diferent transportation modals, in the most convenient choice, by guaranteeing access to the origin and destination of products, apart from adapting more easily to their respective schedules for the reception and delivery of products to the customer (Bowersox et al., 2006; Singh et al., 2008).
2.1.2. Railway subsystem
The Brazilian railway system has its origin marked by a slow development, due to the lack of internal and external incentives. So, at a gradual pace, over several government periods marked by crises and economic plans, railroads were built in Brazil connecting strategic regions, so that, in 1948, the country had a rail network of about 35.623km (Setti, 2008).
Currently, with the reduction in railway sidings (Setti, 2008), Brazil concentrates half of the approximately 29,000km available railways in the state of Rio Grande do Sul and, in the Southeast, in São Paulo, Rio de Janeiro and Minas Gerais. Although it is considered a small railway network in comparison with the vast Brazilian territory, according to the Logistics and Supply Chain Institute (2008), the period from 2001 to 2007 could register a significant growth of 59% in the volume handled by the railway transport. This cargo is basically represented by products with a high volume and low value, such as iron ore and coal, besides agricultural products, such as grain, and steel products (Logistics and Supply Chain Institute, 2008; Ravibabu, 2013).
Among the aspects that directly influence the selection process of the ideal transportation modal to meet the requirements of the companies, it is important to highlight that the railway transport is characterized by high-fixed costs, represented by high investments in railway equipment, namely, rails, terminals, locomotives, cars, etc. (Waters, 2003; Wanke & Fleury, 2006; Eller et al., 2011). On the other hand, it is also worth mentioning that the railway subsystem incurs low variable costs (Waters, 2003; Costa et al., 2010; Lu et al., 2015).
It is noteworthy that, in the context of supply chains, road transport is highlighted by its efficiency in providing door-to-door services (Singh & Malik 2016). However, Sadjady (2011) states that, in the case of railroad transport, delivery and reception services are limited to terminal-to-terminal conditions. Costa et al. (2010) observe, therefore, that although flexibility is not one of the main advantages of cargo transport by railways, the types and dimensions of the products they handle give the rail transport a highly versatile pattern.
Loading and unloading processes of cars may represent 86% of the transit time of a train. This fact, together with two important criteria, namely, speed and distance, eventually influence on the selection process of this mode. In the case of rail transport, these aspects refer, thus, to the low speed and short distance traveled daily. The activities of loading and unloading can be represented by intraterminals handling, and by the processes of classification and preparation of the trains. Furthermore, in function of periods of low demand for cars, such activities can also count on the presence of idle periods (Ballou, 2006).
2.1.3. Waterway subsystem
Water transport can be classified mainly taking into account the extension of water through which crafts move, that is, rivers, lakes, or oceans. In this sense, transport by waterways can be subdivided according the following categories, namely, river transport or by inland waterways, lacustrine, and marine or by costal and intercostal oceans, and international deep sea (Martins, 2007; Sadjady, 2011). Barat (2007, p. 68) calls attention to a third category of waterway movement, called cabotage, which, according to the author, “[…] includes all shipping conducted along the Brazilian coast”.
Regarding cost structure, Wanke & Fleury (2006) state that the waterway mode presents medium fixed costs and, somewhat, low variable costs remain, highlight Bowersox et al. (2006), between rail and road modes. Such fixed costs are justified in light of necessary investments in transportation equipment and in terminals, whereas variable costs refer to operating costs inherent in the use of transportation equipment, which allow these costs to be reduced, the higher the routes and volumes handled (Ballou, 2006; Wanke & Fleury, 2006).
The existence of infrastructure problems, as evidenced by Taccone & Nogueira (2001), makes the waterway mode show certain limitations. Some of the deficiencies observed by the authors refer to the lack of multimodal combinations involving land and water transportation, the presence of unstable river networks below their potential use and, within navigation, the lack of support for this segment. On the other hand, these disadvantages have been compensated in terms of benefits pointed out by the authors, such as products, at the MERCOSUR level, with a greater competitive advantage; furthermore, this transportation mode is a synonym of cargo handling at reduced costs.
2.1.4. Intermodality and intermodal terminals
The concepts of intermodality and multimodality may differ basically in the participation of multiple logistics’ operators (Rietveld et al., 2001; Givoni & Rietveld, 2007; Nobis, 2007; Clifton & Muhs, 2012), a fact mentioned by Barat (2007) as a way to use these terms in Brazil. However, it is possible to observe the application of both concepts for the same definition in the literature, so that intermodality goes far beyond simple means and combination of transport, but can also be understood as a service, and called multimodality, since it is the presence of various means of transport used for handling the same cargo, under the care of only one bill of landing (David, 2004; Cambra-Fierro & Ruiz-Benitez, 2009; Feng, 2014). It is noteworthy that only the term intermodality was used throughout this paper, since the differences described did not influence the course of this study.
From the definition of the concepts of intermodality and multimodality, it becomes possible to realize that the biggest distinction between these forms of organization of cargo transportation lies basically in legal and contractual criteria. In this context, it should be mentioned that the multimodal bill of lading has been represented by Law No. 9611, dated February 19, 1998 (Azevedo, 2008; Ng et al., 2013). In other words, it is about seeking to maximize the advantages and, at the same time, reducing or eliminating the negative impacts of each transportation mode, making it possible to optimize travel conditions which, according to Pitsiava-Latinopoulou & Iordanopoulos (2012), in general, brings the idea of intermodality.
It is known that intermodality can provide advantages, such as a greater intensification in the competitiveness of the country, due to the high economic productivity, and efficiency; lower handling costs, resulting from the alignment between the characteristics of each mode and the appropriate type of route; use of more eficiente transportation modes; reduction in unnecessary infrastructure investments, as well as traffic jams, dependence on road transport, time and handling costs and; positive results for the environment (Organisation for Economic Co-Operation and Development, 2001; Kadłubek, 2011).
Within intermodality, terminals where cargo transfer occurs with the aid of support devices arise, such as, for example, gantry cranes and front loaders, from road or rail networks, for sets of platforms present in intermodal terminals, aimed at providing aid in the reception and handling of their users’ goods (Ortúzar & Willumsen, 2011). In this context, Fulgêncio (2007) defines transport terminals as “[...] places, such as stations, ports, airfields, provided with adequate means and facilities, for the start or completion of transport operations. Transport terminals take the name of the main transportation mode used”.
Transport terminals have a key position in the dynamic operation of the various supply chains. Thus, as for the different transportation modes, Akwetey (2011) classifies the terminals in onshore or offshore. For the author, while offshore terminals, or seaports, are among the most established forms of structure for cargo transshipment, the existence of only one transport connection, input and output, allows onshore terminals, also known as dry or land ports, or inland transport stations, to establish more easily in many different places.
2.1.5. Characterization of grain logistics
Throughout the 1990s until the mid-2000s, Brazilian agribusiness, as stated by Baer (2009), was marked by important events. For the author, it was due to the ups and downs of the national currency, a phenomenon which, aligned with an increase observed in commodity prices, enabled the country to reverse its balance of agricultural exports to U$24.7 billion in 2005, against a previous balance of the order of 34.7 billion, in 1999.
in the production of commodities such as coffee, sugar, alcohol, and fruit juice. In parallel, it has become the second largest soybean producer and the third largest corn producer worldwide. The presence of new technologies and an increase in farmland in the period between 1991 and 2005, as well as data contained in the Ministry of Agriculture, Livestock and Supply, according to Brasil (2007), for the case of soybeans in the Northeast and Midwest regions, allowed gains in income which led to a representative increase in grain production (Baer, 2009).
In 2010, soybeans were the second most exported agricultural commodity by Brazil, surpassed only by sugar cane. Furthermore, in that year, the volume of exported soybeans was inferior only to the United States (Food and Agriculture Organization of the United Nations, 2012). Nowadays, around 68% of Brazilian soybeans are handled by the national road network (Reis & Leal, 2015).
In this context, it is, therefore, necessary to emphasize the important role played by China, which operates in a decisive manner, both as a producer and as a consumer. Globally, the Chinese produce grains in about only 9% of cultivated land, supplying 20% of the entire population. Although China suffers from the presence of natural disasters, as well as repercussions of the changes inherent in a complex international environment, its grain harvests have been satisfactory since 2004. Moreover, its influence on world prices is striking, since an increase in the imports of the country can mean a considerable drop in grain supply for others (Wang et al., 2009).
Although China has been consolidated regarding grain production, Wang et al. (2009) bring the fact that the country operates in deficit relative to soybean cultivation towards other crops it produces (rice, wheat and maize). This leads the Chinese to import, in 2007, almost half of their international sales, i.e. about 31 million tons, characterizing the country as the world’s largest grain buyer. In other words, the author states that, unlike other crops, soybeans did not accompany the change that moved China’s importer condition, in 1997, to grain exporter in 2004. During this period, the offer ended up surpassing the demand, since the country achieved a production level of 500 million tons.
3. Methodology
The preparation of this paper had data envelopment analysis (DEA) as the main technique, which involves the application of the models CCR, Charnes et al. (1978) and BCC (Banker et al., 1984). In this paper, the results for the second model are presented, considering the inputs, reception-landing capacity (tons/hour), storage capacity (tonnes), and the number of employees involved in transshipment, in units, and the output, amount of grains handled (tons). The analysis process was performed through the tabulation of these variables, using the V3.0 Integrated System for Decision Support (ISYDS) software, and the data generated were organized in charts, reaching the results and conclusions presented in this paper.
Considering the variations in relation to the returns of scale, the CCR model, from Charnes, Cooper and Banker, is also known as Constant Scale Returns (CRS) (Rickards, 2003; Heidari et al., 2012). In the CRS or CCR model, which predicts that the outputs increase in proportion to the increases in their inputs, the results generated considering its application refer to objective indicators of efficiency or inefficiency for each DMU under evaluation (Rickards, 2003). In the BCC, Banker, Charnes and Cooper models, although the increase in the facilities size of the DMU analyzed is not influenced by economies of scale, it is characterized, according to Heidari et al. (2012) and Oliveira & Silveira Neto (2011), by Variable Scale Returns (RSV). This is the pure technical efficiency, which refers to the production of a products’ standard by minimizing inputs or maximizing outputs (Oliveira & Silveira Neto, 2011).
The main results obtained by the CCR model were defined as a support, part of a master’s dissertation, to achieve the objectives of this paper. Since the main focus involved the application of the BCC model, its mathematical formulation can be represented by Equation 1 and its Restrictions 1a and 1b, adapted from Cooper et al. (2011).
0 1
= ⋅ −
∑
i ioi
Minimize v x v (1)
Subjected to 1 . 1 = =
∑
o s j j ju y (1a)
1 1
0
. . 0
+
== − ≤
∑
j jk∑
i is r
j i
k
u y v x v (1b)
Thus, the research method adopted was the mixed, or quantitative-qualitative, and the research approach was exploratory. The qualitative analysis could be achieved by defining the case study method (multicases), which enabled grain intermodal transportation system description in the Brazilian Southeast region, with a view to raising additional qualitative variables to the quantitative analysis (BCC model).
Although quantitative and qualitative methods are used for different perspectives in relation to the study object, it should be noted that the emergence of qualitative-quantitative research, or mixed research has, as its starting point, the complementary character on key aspects defended by each of these methods. In the words of Creswell (2009), the mixed method builds on the strengths of both qualitative and quantitative research, becoming increasingly popular due to the evolution and development characteristic of the research methodology.
In parallel, the exploratory research is recommended for situations in which the amount of accessible information can be characterized as insufficient for the actual knowledge of the problem-situation, as well as for the company to make decisions (Hair Junior et al., 2005; Malhotra, 2006). According to Hair Junior et al. (2005), exploratory research seeks to direct the researcher to the discovery of what they have little knowledge about. This type of research presents a major contribution to the process of defining the problem or research question (Corrêa, 2009; Marconi & Lakatos, 2002).
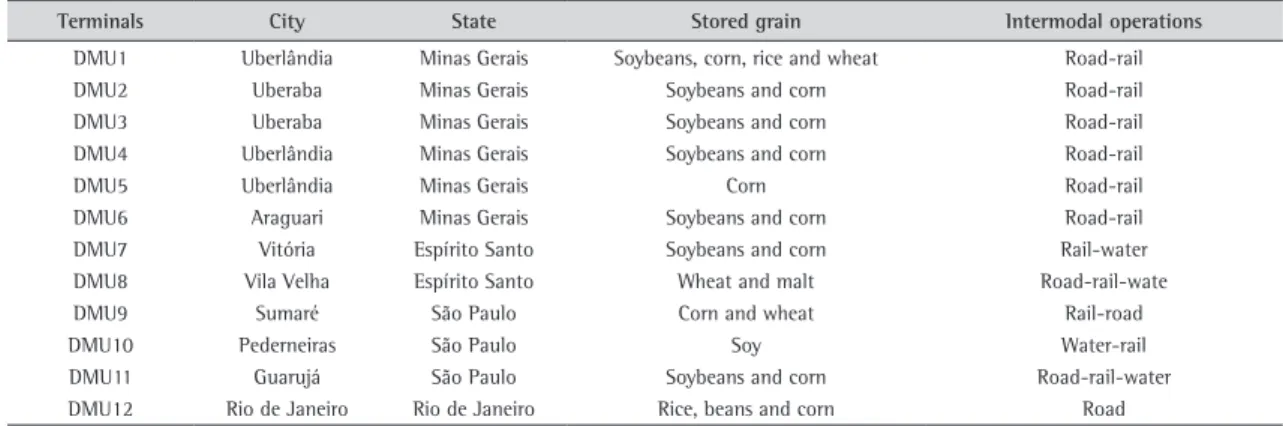
Table 1 outlines some of the basic information about each of the 12 terminals, participants in the sample of this study. In order to preserve the image of the companies that were willing to cooperate by giving their information, it was decided to call them DMU, numbered from 1 to 12. As can be seen, 06 terminals in Minas Gerais, 02 in Espírito Santo, 03 in São Paulo, and 01 in Rio de Janeiro have been addressed, most of them presenting a road-rail combination. It should be noted that DMUs 1, 2, 3 and 5 have been currently operating with road transport only, due to the poor condition of railways around the terminals, making this option cost-prohibitive.
Table 1. Basic characteristics of Southeast region grain terminals (DMUs).
Terminals City State Stored grain Intermodal operations
DMU1 Uberlândia Minas Gerais Soybeans, corn, rice and wheat Road-rail
DMU2 Uberaba Minas Gerais Soybeans and corn Road-rail
DMU3 Uberaba Minas Gerais Soybeans and corn Road-rail
DMU4 Uberlândia Minas Gerais Soybeans and corn Road-rail
DMU5 Uberlândia Minas Gerais Corn Road-rail
DMU6 Araguari Minas Gerais Soybeans and corn Road-rail
DMU7 Vitória Espírito Santo Soybeans and corn Rail-water
DMU8 Vila Velha Espírito Santo Wheat and malt Road-rail-wate
DMU9 Sumaré São Paulo Corn and wheat Rail-road
DMU10 Pederneiras São Paulo Soy Water-rail
DMU11 Guarujá São Paulo Soybeans and corn Road-rail-water
DMU12 Rio de Janeiro Rio de Janeiro Rice, beans and corn Road
DMU12, which also operates only with the road system, particularly shows what is left of the decisions from the Collor government, which has resulted in the deactivation, over the 90s, of the entire storage infrastructure installed throughout the city and port of Rio de Janeiro. This fact suggests the existence, in past times, of grain transportation by the waterway mode. The character of food production in the state, i.e. the high reception from other regions and the low local production, basically represented by the produce sector, reduces the presence of grain terminals in the state, so that DMU12 was selected as a way of characterizing this scenario.
Interviews were used, through the application of a structured questionnaire, together with directors, administrative managers and supervisors, responsible for flow processes of grain terminals in the Southeast region. The criterion set for the interviews was based on the search for those professionals with expertise in the management of reception, warehousing and grain shipping, i.e. people who have a wide knowledge concerning the processes related to grain handling in terminals. It was, then, possible to have access to most of the reliable data provided by the companies, minimizing possible biases inherent in data collection.
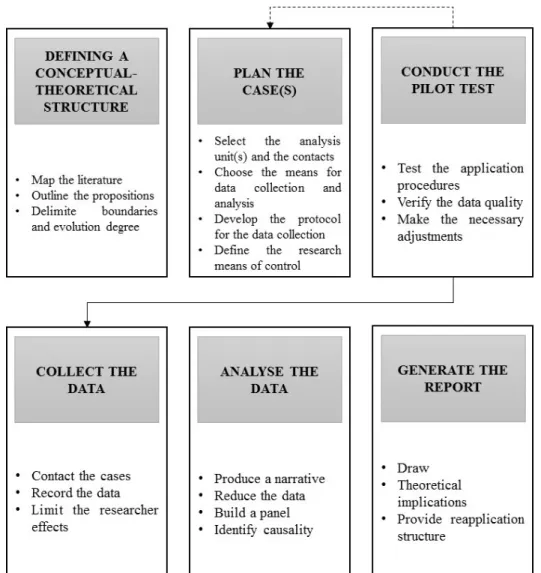
Once the research method was defined (case study), Reis (2008) states that it can be understood as an “empirically based research technique”, which has the interaction between researcher and research subject as its starting point, both engaged in conducting the study of the various aspects of the selected object, which may be a fact or phenomenon. In this sense, Miguel (2007) proposes a sequency of steps defined to conduct a case study, as demonstrated in Figure 1.
According to Figure 1, it is possible to note that the case study method can be based on six major stages, involving since the construction of a theoretical reference, from the establishment of a literature mapping over the subject, and the case(s) planning, which involves the units of analysis definition, the data collection protocol, as well as the means to perform the collection and analysis, complemented by the means of control (Miguel, 2007).
Afterwards, the pilot test is conducted, as a quality assurance for the procedures and data collection, followed properly by the data collection process. Finally, the data analysis is taken, that is, the transcription of the main informations to the format of a narrative, considering the method of analysis proposed, leading to the generation of a research report, which can be represented by scientific articles, dissertations or theses. In addition, it may be emphasized about the great influence of the pilot test on the third and fourth steps’ efficiency, namely, planning and data collection, as shown by the arrows in Figure 1 (Miguel, 2007).
Lastly, it should be noted that the case study method can be classified according to two dimensions: single case study and multiple case study; in recent years, the use of multiple cases has been increasing (Yin, 2001). So, considering the study object composed by the 12 intermodal terminals, this paper attends the condition of a multi-case study.
4. Results and discussion
This section of the paper seeks to describe the partial results obtained from Data Envelopment Analysis (DEA). In this, the pure technical efficiency of DMUs was analyzed, through the application of the Variable Returns to Scale model, namely BCC. Thus, it was possible, besides performing a comparison between the efficiencies, verify if the terminals with production efficiency also present pure technical efficiency.
4.1. Analysis of pure technical efficiency - BCC model
Initially, it is important to emphasize that, from the application of the CCR model as part of a master’s dissertation, it was possible to verify that, from the twelve terminals evaluated, only 4, 7 and 11 have production efficiency. By applying the BCC model, it was observed that 50% of the terminals have pure technical efficiency (1, 2, 4, 7, 11 and 12). Nevertheless, terminals 1, 2 and 12 are not on the total efficiency frontier. Therefore, it is already possible to prove that the terminals that have production efficiency also have pure technical efficiency, but the inverse does not always happen.
It was observed that DMUs 1, 2 and 12, below the frontier of productive efficiency according to the CCR model, proved to be efficient according to the BCC model. This fact has proved that its total technical inefficiency was not influenced by the possible existence of a pure technical inefficiency. According to Barros et al. (2011), this efficiency refers to the production capacity of a company that makes proper use of its inputs. Thus, it is possible to assume that these DMUs have scale inefficiency, which is not part of what was defined for this study.
The application of the model also showed that the six inefficient DMUs present values of operating efficiency up to 60%, in the same way as for the CCR model. From them, it is possible to highlight DMUs 3 and 9 with lower percentages, i.e. 4.63% and 2.98%, which also had the lowest percentages in terms of production inefficiency. Considering the average values of the inputs, parallel to the general average of pure technical efficiency, it can be seen that, through the BCC model, there was an increase of approximately 20.44% over the CCR model. That is, on average, the terminals have a higher pure technical efficiency, which may suggest that the major cause of their total inefficiency relates to a possible operation scale inefficiency.
The sum of inputs and output of the efficient DMUs is greater in each of the individual values presented by inefficient DMUs. This fact can be considered positive, since it strengthens the contribution of the input-output set to reach technical efficiency, by the terminals analyzed. Thus, the scenario presented by the terminals, in terms of pure technical efficiency, can be considered relatively good. Considering the product orientation, it can be inferred that the evaluated terminals, in general, have reached the output maximization, through the constant maintenance of the inputs used.
4.2. Target summary for the inputs and output in the BCC model
The targets obtained for each of the inputs and the output will be evaluated separately in this section, and jointly in the next section, creating conditions for inefficient DMUs to reach the technical efficiency. These targets or goals have, as principle, the suggestion of increases or decreases in each one of the variables from the DEA model.
Figure 2 shows a comparison between the current values presented by the input, reception-landing capacity, and the respective targets or goals to be achieved, so that the terminals can reach the efficiency frontier. It is known that, for the DMUs to be able to become efficient, it is not sufficient that changes are directed at only one of the variables, but it is important to jointly carry out decreases or increases in inputs and output.
Thus, Figure 2 shows that 16.67% of the terminals of the sample need to make changes within their reception-landing capacities. Therefore, it is up to DMU3 to perform a reduction of 58.22%, from the current value, and of only 5.72% for the case of DMU10, which shows that, the reception-landing capacity of the latter may have little influence in the context of the search for reaching pure technical efficiency.
As for the CCR model, terminals 6, 3 and 10 may be overusing their handling equipment. Thus, given that DEA is based on the optimization of available resources, it is up to these terminals to reassess the use of such equipment, since it is not intended to propose the purchase of more dump trucks, hoppers, etc. to remedy this issue.
For the case of terminal 9, with the lowest efficiency value shown by DEA, it is necessary that there be a reduction in its grain storage capacity. In this terminal, it is necessary to evaluate the current terms of use of warehouses and silos, since its storage capacity should show a decrease of 38.14%, in order to reach pure technical efficiency.
The BCC model indicates that only 33.33% of the terminals must make corrections to their share of employees involved in transshipment, while in the CCR model, this value almost doubles. This fact shows that the adjustments relating to this variable may be much more connected to a problem of scale inefficiency of operation than pure technical. In other words, it is possible to suggest that inoperative terminals in pure technical efficiency may have their causes relative to other inputs or output. As shown in Figure 4, it is important that an average reduction of approximately 53.76% be performed in transshipment workforce, both operational and administrative, regarding DMUs 5, 6, 8 and 9, so that the terminals can reach pure technical efficiency.
DMUs whose targets differ from the current number of employees involve, therefore, terminals 5, 6, 8 and 9, among which it is observed that, in DMU9, a cut of 81.81% of its human resources engaged in transshipment is necessary. This terminal, as already mentioned, is intended to handle only 25% grain and 75% sugar. Thus, a justification for the large decrease observed may suggest that the 150 professionals engaged in grain transshipment are also involved in sugar handling, so that DEA understands that there is an excess of professionals operating in grain transshipment.
In Figure 4, it is possible to observe that, in DMUs 6 and 8, the number of employees must be reduced essentially by half, while in DMU5, this reduction must be of the order of 30.95%. Despite the fact that DMUs 5 and 6, representing private terminals, may mean less resistance to making changes in their workforce, it is necessary to call attention to the fact that DMU8, once public, depends on governmental decisions, i.e., it has its autonomy restricted by the government.
Figure 2. Targets for the receiving-unloading capacity of Southeast grain intermodal terminals.
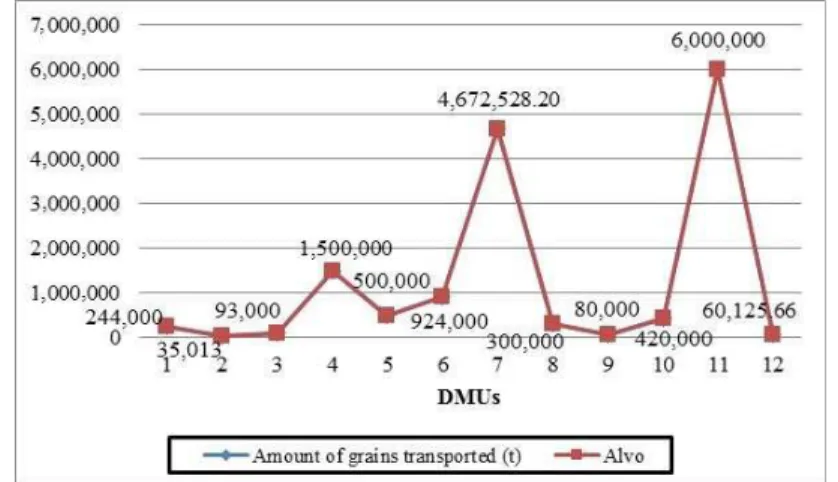
Lastly, in the case of the output “amount of grains handled”, it is possible to observe a situation which is completely opposite to the results obtained by the application of the CCR model. In general, 75% of the DMUs need to perform drastic increases in this variable to achieve the efficiency frontier. Again, it may reflect on scale operation issues.
Figure 5 illustrates the situation of the terminals evaluated by the BCC model, in which the target for technical efficiency is the amount of grains handled. This condition shows that the causes of a pure technical inefficiency, on the part of terminals 3, 5, 6, 8, 9 and 10, are closely aligned with the variables, reception-landing capacity and storage, as well as the number of employees involved in transshipment.
Given the above, the focus of these terminals should be towards the maintenance of values regarding the amount of grains handled, so that the DMUs, public and private, defined with purê technical inefficiency by the BCC model can reverse this situation. In parallel, it is up to the DMUs to reassess their human resources management within intermodal transshipment operations.
Figure 4. Targets for the number of employees involved in transshipment operations of Southeast region grain intermodal terminals.
Figure 5. Targets for the amount of grains handled by Southeast grain intermodal terminals.
4.3. Specific target analysis for the inputs and output in the BCC model
When performing a specific analysis of each DMU, it is possible to infer that, for terminal 3 to reach pure technical efficiency, it is only necessary that its reception capacity be reduced from 1,000 to 417.8 tons/hour, provided that the other variables be kept constant. On the other hand, DMU5 must also perform a cut of 12 employees involved in intermodal transshipment services and, at the same time, perform a small reduction in its storage capacity. With regard to terminal 6, it is important for managers to review what may be causing an excess of professionals, aligned with transshipment activities, so that this DMU can contribute to reach the efficiency frontier, since there must be a reduction of half of these employees, according to DEA. A similar situation can be observed in relation to DMU8, of public character, in which DEA also suggests a reduction from 85 to 42 employees. Again, it is important to emphasize the existence of worker flexibility in diverse functions, which may serve as an explanation for this fact.
In the case of terminal 9, whose main focus is soybean handling and soybean meal, the need to perform certain reductions with respect to the productive resources becomes evident in this terminal. Therefore, changes should be directed to both its storage capacity and to its number of employees, so that this DMU can have the same conditions to become efficient, such as DMUs 4, 7 and 11. Thus, the reception-landing capacity and amount of grains handled must be kept (variable value = target value), while the storage capacity should be decreased by 38.14% and, for the number of employees, there should be a workforce cut of approximately 81.81%.
Lastly, it is possible to consider that DMU10 is very close to reaching pure technical efficiency, since only minor changes related to its reception-landing capacity must be performed. This fact demonstrates again that this terminal may not be operating at optimal scale. Although theoretically DEA makes it clear that this variable should be reduced by 5.72% to reach the proposed target, in practice, it is a decision that can become more complex than the decrease of the same variable proposed for terminal 3, of 61.3% (from 1.000t/h to 387.03 t/h). Even if it means a small change of 28.59 t/h, it is important that a reassessment of all processes and resources involved in this operation be performed, so that it does not result in losses for other activities.
The goals and targets observed indicate that the terminals need to make reductions in their inputs, so that they can get maximum outputs’ standars. This fact also shows that achieving the proposed goals will be possible for the DMUs, at least, to maintain the current outputs, using a smaller amount of inputs. Thus, the presence of twice the DMUs with pure technical efficiency, in relation to the CCR model, shows that DMUs 1, 2 and 12 have been able to maintain the appropriate inputs to achieve the results obtained, although they may be operating with increasing or decreasing returns to scale. Therefore, they are below the optimal scale and, according to Dias et al. (2010), it is necessary to reduce or improve technological aspects, or even increase their production, resulting in the displacement of the production frontier.
5. Conclusions
The application of Constant Returns to Scale (CRS) model as part of a broader master’s dissertation, allowed to observe that only three (4, 7 and 11), from the twelve analyzed DMUs, have overall technical efficiency, i.e. they can use their inputs efficiently, without incurring large waste. Furthermore, these terminals also feature pure technical efficiency, according to the BCC model, the main focus of this paper. On the other hand, the three inefficient DMUs (1, 2 and 12) showed only purê technical efficiency, which suggests that these terminals could present a possible operation scale inefficiency, an aspect which was not addressed in this study.
By the application of the BCC model with product orientation, it is possible to show that the gap is mainly related to the number of employees involved in transshipment operations. Furthermore, it became clear that the DMUs are much closer to pure technical efficiency, which may suggest a greater distance in terms of scale efficiency. It was possible to prove that the terminals with production efficiency also have technical efficiency, and that they may also have scale efficiency, considering that the productive efficiency model is equal to the multiplication of pure and scale technical efficiencies.
On the other hand, it should be noted that, although the application of DEA has been a great contribution to the evaluation of operational productivity of grain intermodal terminals in the Southeast, this technique also incurs limitations. Since it relies on the selection of specific input and output variables, it does not indicate, in a straightforward way, the possible operational aspects that result in inefficiency. Therefore, it is ultimately necessary to know the background of each process, both operational and managerial, so that it becomes possible to identify or assume the existing bottlenecks.
Finally, for future research it is suggested the implementation of the scale efficiency evaluation model contemplating grain intermodal terminals. The proposal involves verifying if the full technical efficiency terminals and, therefore, pure technical efficiency, also have scale efficiency, that is, operate in the optimal range. For the case of terminals below the productive efficiency border, due to a possible scale inefficiency, the identification of how much these terminals could get profit, once working on this scale, will also contribute to grain logistics terminals to operate without the excessive use of inputs and waste, increasingly optimizing their results.
References
Akwetey, L. M. (2011). Business administration for students & managers. Bloomington: Trafford Publishing.
Azevedo, S. N. (2008). O protesto de títulos e outros documentos de dívida: passo a passo no dia-a-dia (198 p.) Porto Alegre: EDIPURCS. Baer, W. (2009). A Economia brasileira (541 p.) São Paulo: Nobel.
Ballou, R. H. (2004). Business logistics: supply chain management (5th ed.). Upper Saddle River: Pearson-Prentice Hall. Ballou, R. H. (2006). Gerenciamento da cadeia de suprimentos/logística empresarial (616 p.) Porto Alegre: The Bookman.
Banker, R. D., Charnes, A., & Cooper, W. W. (1984). Some models for estimating technical and scale inefficiencies in data envelopment analysis. Management Science, 9(30), 1078-1092. http://dx.doi.org/10.1287/mnsc.30.9.1078.
Barat, J. (2007). Logística e transporte no processo de globalização: oportunidades para o Brasil (225 p.). São Paulo: UNESP. Barros, C. P., Botti, L., Peypoch, N., Robinot, E., Solonandrasana, B., & A, G. A. (2011). Performance of French destinations: tourism
attraction perspectives. Tourism Management, 32(1), 141-146. http://dx.doi.org/10.1016/j.tourman.2010.01.015.
Bloemhof, J. M., van der Vorst, J. G., Bastl, M., & Allaoui, H. (2015). Sustainability assessment of food chain logistics. International Journal of Logistics Research and Applications, 18(2), 101-117. http://dx.doi.org/10.1080/13675567.2015.1015508.
Bourlakis, M., & Weightman, P. (Eds.). (2004). Food supply chain management. Oxford: Blackwell.
Bowersox, D. J., Closs, D. J., & Cooper, M. B.(2006). Gestão logística de cadeias de suprimentos (5th ed., 529 p.). Porto Alegre: Bookman. Brasil. Ministério da Agricultura, Pecuária e Abastecimento. (2007). Cadeia produtiva da soja (116 p.). Brasília: MAPA.
Cambra-Fierro, J., & Ruiz-Benitez, R. (2009). Advantages of intermodal logistics platforms: insights from a Spanish platform. Supply Chain Management: an International Journal, 14(6), 418-421. http://dx.doi.org/10.1108/13598540910995183.
Charnes, A., Cooper, W. W., & Rhodes, E. (1978). Measuring the efficiency of decision making units. European Journal of Operational Research, 2(6), 429-444. http://dx.doi.org/10.1016/0377-2217(78)90138-8.
Clifton, K. & Muhs, C. (2012). Capturing and representing multimodal trips in travel surveys: review of the practice. Transportation Research Record: Journal of the Transportation Research Board, 2285, 74-83.
Confederação Nacional do Transporte. (2006). Pesquisa rodoviária. Brasília. Retrieved in 16 March 2013, from http://www.cnt.org.br Cooper, W. W., Seiford, L. M., & Zhu, J. (2011). Handbook on data envelopment analysis. New York: Springer.
Corrêa, J. (Org.). (2009). Marketing: a teoria em prática. São Paulo: SENAC.
Costa, J. P., Dias, J. M., & Godinho, P. (2010). Logística (246 p.). Coimbra: Universidade de Coimbra, 246.
Creswell, J. W. (2009). Research design, qualitative, quantitative, and mixed methods approaches (260 p.). Los Angeles: Sage. David, P. (2004). International logistics: the management of international trade operations (416 p.). New York: Atomic.
Dias, C. G., Labegalini, L., Martins, R. S., & Gomes, A. P. (2010). Análise da eficiência da logística aeroportuária no Brasil. Revista de Economia e Administração, 9(3), 271-293.
Duffy, R., & Fearne, A. (2006). Effective partnerships for agri-food chains: the impact of supply-chain partnerships on supplier performance in the UK fresh-produce industry. In C. J. M. Ondersteijn, J. H. M. Wijnands, R. B. M. Huirne & O. van Kooten (Eds.), Quantifying the agri-food supply chain (pp. 225-239). Amsterdam: Springer.
Eller, R. A. G., Sousa Junior, W. C. E., & Curi, M. L. C. (2011). Custos do transporte de carga no Brasil: rodoviário versus ferroviário. Journal of Transport Literature, 5(1), 50-64.
Food and Agriculture Organization of the United Nations. (2012). FAOSTAT. Rome. Retrieved in 7 January 2012, from http://www. faostat.fao.org./
Feng, C. M. (2014). New prospects of transportation mobility. IATSS Research, 38(1), 22-26.
Fleury, P. F. (2006). Economia brasileira na encruzilhada: coletânea. In L. C. Bresser-Pereira (Ed.), Os gargalos da infraestrutura logistica no Brasil (227 p.). Rio de Janeiro: FGV.
Franco, J. J. A. (2011). A perecibilidade como fator crítico na logística de distribuição de alimentos. Retrieved in 22 July 2012, from http://www.webartigos.com/artigos/a-perecibilidade-como-fator-critico-na-logistica-de-distribuicao-de-alimentos/59049/ Fulgêncio, P. C. (2007). Glossário: vade mecum (678 p.). Rio de Janeiro: Mauad.
Givoni, M., & Rietveld, P. (2007). The access journey to the railway station and its role in passengers’ satisfaction with rail travel. Transport Policy, 14(5), 357-365. http://dx.doi.org/10.1016/j.tranpol.2007.04.004.
Hair Junior, J. F., Babin, B., Money, A., & Samouel, P. (2005). Fundamentos de métodos de pesquisa em administração. Porto Alegre: Bookman.
Heidari, M. D., Omid, M., & Mohammadi, A. (2012). Measuring productive efficiency of horticultural greenhouses in Iran: a data envelopment analysis approach. Expert Systems with Applications, 39(1), 1040-1045. http://dx.doi.org/10.1016/j.eswa.2011.07.104. Janic, M. (2008). An assessment of the performance of the European long intermodal freight trains (LIFTS). Transportation Research
Part A, Policy and Practice, 42(10), 1326-1339. http://dx.doi.org/10.1016/j.tra.2008.06.008.
Logistics and Supply Chain Institute. (2008). Logistics overview in Brazil. Retrieved in 19 Jume 2012, from http://www.ilos.com.br Logistics and Supply Chain Institute. (2010). Panorama custos logísticos no Brasil. Rio de Janeiro.
Logistics and Supply Chain Institute. (2014). Custos logísticos no Brasil. Retrieved in 22 July 2012, from http://www.ilos.com.br/ ilos_2014/wp-content/uploads/PANORAMAS/PANORAMA_brochura_custos.pdf
Lu, X., Withers, M. R., Seifkar, N., Field, R. P., Barrett, S. R., & Herzog, H. J. (2015). Biomass logistics analysis for large scale biofuel production: case study of loblolly pine and switchgrass. Bioresource Technology, 183, 1-9. PMid:25710677. http://dx.doi.org/10.1016/j. biortech.2015.02.032.
Machline, C. (2011). Cinco décadas de logística empresarial e administração da cadeia de suprimentos no Brasil. RAE – Revista de Administração de Empresas, 51(3), 227-231.
Malhotra, N. K. (2006). Pesquisa de marketing: uma orientação aplicada (719 p.). Porto Alegre: The Bookman.
Marconi, M. A., & Lakatos, E. M. (2002). Técnicas de pesquisa: planejamento e execução de pesquisas, amostragens e técnicas de pesquisas, elaboração, análise e interpretação de dados (5. ed., 282 p.). São Paulo: Atlas.
Martins, I. G.(2007). Conheça a constituição: comentários a constituição brasileira (120 p.) Barueri: Manole.
Miguel, P. A. C. (2007). Estudo de caso na engenharia de produção: estruturação e recomendações para sua condução. Revista Produção, 17(1), 216-229. http://dx.doi.org/10.1590/S0103-65132007000100015.
Ng, A. K. Y., Padilha, F., & Pallis, A. A. (2013). Institutions, bureaucratic and logistical roles of dry ports: the Brazilian experience. Journal of Transport Geography, 27(1), 46-55. http://dx.doi.org/10.1016/j.jtrangeo.2012.05.003.
Nobis, C. (2007). Multimodality: facets and causes of sustainable mobility behavior. Transportation Research Record: Journal of the Transportation Research Board, 2010, 35-44.
Oliveira, P. G. M., & Silveira Neto, C. R. (2011). Trilogia do desempenho empresarial: criando valor através do planejamento, do controle e da avaliação do desempenho de empresas. Rio de Janeiro: E-Papers.
Organisation for Economic Co-Operation and Development. (2001). Intermodal freight transport: institutional aspects (72 p.). Paris. Ortúzar, J. D., & Willumsen, L. G. (2011). Modelling transport (4th ed., 514 p.). Chichester: John Wiley & Sons.
Pieter van Donk, D., Akkerman, R., & van der Vaart, T. (2008). Opportunities and realities of supply chain integration: the case of food manufacturers. British Food Journal, 110(2), 218-235. http://dx.doi.org/10.1108/00070700810849925.
Pitsiava-Latinopoulou, M., & Iordanopoulos, P. (2012). Intermodal passengers terminals: design standards for better level of service. Procedia: Social and Behavioral Sciences, 48, 3297-3306. http://dx.doi.org/10.1016/j.sbspro.2012.06.1295.
Ravibabu, M. (2013). A nested logit model of mode choice for inland movement of export shipments: a case study of containerized export cargo from India. Research in Transportation Economics, 38(1), 91-100. http://dx.doi.org/10.1016/j.retrec.2012.05.007. Reis, L. G. (2008). Produção de monografia: da teoria à prática (180 p.). Brasília: SENAC.
Reis, S. A., & Leal, J. E. (2015). A deterministic mathematical model to support temporal and spatial decisions of the soybean supply chain. Journal of Transport Geography, 43, 48-58. http://dx.doi.org/10.1016/j.jtrangeo.2015.01.005.
Rickards, R. C. (2003). Setting benchmarks and evaluating balanced scorecards with data envelopment analysis. Benchmarking: an International Journal, 10(3), 226-245.
Rietveld, P., Bruinsma, F. R., & Van Vuuren, D. J. (2001). Coping with unreliability in public transport chains: A case study for Netherlands. Transportation Research Part A, Policy and Practice, 35(6), 539-559. http://dx.doi.org/10.1016/S0965-8564(00)00006-9. Sadjady, H. (2011). Physical flows. In R. Z. Farahani, S. Rezapour & L. Kardar (Eds.), Logistics operations and management: concepts
and models (pp. 11-42). London: Elsevier.
Setti, J. B. (2008). Ferrovias no Brasil: um século e meio de evolução. Rio de Janeiro: Memória do Trem. 176. Severo Filho, J. (2006). Administração de logística integrada: materiais, PCP e marketing. Rio de Janeiro: E-papers. 310.
Singh, A., Gangopadhyay, S., Nanda, P. K., Bhattacharya, S., Sharma, C., & Bhan, C. (2008). Trends of greenhouse gas emissions from the road transport sector in India. The Science of the Total Environment, 390(1), 124-131. PMid:17977579. http://dx.doi.org/10.1016/j. scitotenv.2007.09.027.
Singh, N., & Malik, P. (2016). Comprehensive analysis on cement and crumbed rubber mixed fly ash in India. International Journal of All Research Education and Scientific Methods, 4(7), 211-216.
Soliani, R. D., Vivaldini, M., & Neto, S. (2016). A merger between logistics companies in the context of the Brazilian agribusiness: Rumo (Cosan) and All (Latin America Logistics). Engineering Management Research, 5(1), 1. http://dx.doi.org/10.5539/emr.v5n1p1. Sussams, J. E. (1994). The impact of logistics on retailing and physical distribution. Logistics Information Management, 7(1), 36-40. Taccone, J. J., & Nogueira, U. (Orgs.). (2001). Informe mercosul: período 2000-2001. Buenos Aires: Banco Interamericano de Desarrollo. van der Vorst, J., Beulens, A., & van Beek, P. (2005). Innovations in logistics and ICT in food supply chain networks. In W. M. F.
Jongen & M. T. G. Meulenberg (Eds.), Innovation in agri-food systems: product quality and consumer acceptance (pp. 245-291). Wageningen: Wageningen Academic Publishers. Retrieved in 22 October 2013, from http://www.wageningenacademic.com/doi/ abs/10.3920/978-90-8686-666-3#page=246
Wang, H. X., Zhang, M. H., & Cai, Y. (2009). Problems, challenges, and strategic options of grain security in China. In L. S. Donald (Ed.), Advances in Agronomy. San Diego: Elsevier.
Wanke, P., & Fleury, P. F. (2006). Transporte de cargas no Brasil: estudo exploratório das principais variáveis relacionadas aos diferentes modais e às suas estruturas de custos. Retrieved in 22 October 2013, from http://www.ipea.gov.br
Waters, D. (2003). Logistics: an introduction to supply chain management (354 p.). Palgrave: Macmillan. 354. Yin, R. K. (2001). Estudo de caso: planejamento e métodos (205 p.). Porto Alegre: The Bookman.