Rosiane Maria Lima Gonçalves§ Wilson da Cruz Vieira¤ João Eustáquio de Lima† Sebastião Teixeira Gomes‡
AbstrAct
The objective of this study was to measure the technical and scale efficiencies of milk-producing farms in the state of Minas Gerais, considering different production levels, and also to identify the determining factors of their technical efficiency. The analyses were carried out using both Data Envelopment Analysis (DEA) and an econometric Tobit model. The data consisted of information collected in 2005 relating to 771 milk-producing farms. The results indicated that most of the farms exhibit technical inefficiency problems. Small farmers have the potential to expand their production and productivity, increasing technical efficiency, since they were performing with increasing returns to scale. The large farmers presented the best measures of technical ef-ficiency, which is explained, partly, by factors such as access to rural credit, training and technical support. Keywords: technical efficiency, scale efficiency, data envelopment analysis, milk-producing farms, State of Minas Gerais.
Resumo
O objetivo deste artigo foi mensurar as eficiências técnica e de escala de propriedades produtoras de leite do Estado de Minas Gerais, considerando diferentes estratos de produção, e identificar os fatores determinantes desta eficiência. Utilizaram-se como modelos analíticos a Análise Envoltória de Dados (DEA) e um modelo econométrico Tobit e, como base de dados, informações de 771 propriedades produtoras de leite. Os resultados obtidos indicaram que a maior parte das propriedades apresenta ineficiência técnica. Os pequenos produtores têm potencial para expandir suas produções e produtividades, aumentando a eficiência técnica, visto que estão operando com retornos crescentes a escala. Os grandes produtores foram os que apresentaram as melhores medidas de eficiência técnica, explicada, em parte, pela presença de fatores como acesso ao crédito rural, treinamento e assistência técnica.
Palavras-chave: eficiência técnica, eficiência de escala, análise envoltória de dados, propriedade produtoras de leite, Estado de Minas Gerais.
JEL classification: C24, C61, Q12
§ Professora Assistente – Universidade Federal de Viçosa/CRP. Endereço parta contato: UFV/Campus Rio Paranaíba – 38810-000 Caixa Postal 22, Rio Paranaíba – MG. E-mail: rosiane.goncalves@ufv.br.
¤ Professor Associado – Departamento de Economia Rural/UFV. Endereço parta contato: UFV – Departamento de Economia Rural – 36570-000 – Viçosa – MG. E-mail: wvieira@ufv.br.
† Professor Titular – Departamento de Economia Rural/UFV. Endereço parta contato: UFV – Departamento de Economia Rural – 36570-000. E-mail: jelima@ufv.br.
‡ Professor Titular. Departamento de Economia Rural/UFV. Endereço parta contato:UFV – Departamento de Economia Rural – 36570-000. E-mail: stg@ufv.br.
1 i
ntroductionBrazil is the world’s sixth largest milk producer, and expanded its share of world production to 5.7% in 2003. The low average productivity of the domestic herd shows that the country has great potential for increasing its production, since among the world’s largest milk-producing countries, Brazil has the highest rate of annual growth, estimated in 2.29% over the 1995-2004 period. Dairy farming is present in all Brazilian states, Minas Gerais being the main producer, responsible for 29% of the domestic production (FAEMG, 2006).
According to USDA (2008), in 2007 Brazil had a number of cows 74% and 94% greater than the USA and China, respectively. However, in this same year the American and Chinese produc-tions were 214% and 31%, respectively, greater than in Brazil. These data show that Brazil can improve the productivity of its dairy herd. According to FAEMG (2006), the low productivity of Brazil when compared with other countries is due to the existence of a great number of small milk producers (less than 50 liters/day) whose total production represents only a small fraction of the national milk production.
Dairy farming in Brazil has undergone a number of changes (increase of the herd producti-vity, use of different criteria combining volume and quality to pay milk producers, dairy product exports increase, etc.) in recent years. These changes have required dairy farmers to adapt their production systems in order to stay in business, for instance, adopting new practices, in which quality and efficiency are essential. More and more demanding quality standards have led to the abandonment of traditional systems of milk production and to the emergence of new models for dairy farm management.
Tupy and Yamaguchi (2002) have pointed out the importance of the empirical identification of efficiency levels and production systems that can be considered as references for others, as such knowledge enables the identification of technological demands and required management changes in dairy farming. In order to make the improvement measures feasible, the initial step is to identify whether performance is good, bad or indifferent.
The analysis of efficiency can be done under several aspects (technical, allocative, etc.) In this work efficiency was evaluated using Data Envelopment Analysis (DEA). This technique allows the construction of technical efficiency frontiers, which are used as reference points for comparisons among analyzed units, i.e. once the frontier is built the efficiency of each farm can be measured in relation to it.
2 m
ethodologyData Envelopment Analysis (DEA) was initially used to calculate the technical efficiency scores, and afterwards, a Tobit econometric model was used to identify the determining factors of the efficiency levels.
Data consisted of information relating to 771 milk-producing farms, which were surveyed in 2005 to carry out a Dairy Farm Diagnosis for the state of Minas Gerais. These farms were subdi-vided into three production level categories, according to FAEMG (2006): less than 50 L milk/day; from 50 to 200 L milk/day; and above 200 L milk/day.
2.1 Data Envelopment Analysis
DEA measures the efficiency or inefficiency of each Decision Making Unit (DMU) by ma-thematical programs that enable one to measure the distance of each DMU from the efficiency frontier. It is a tool for nonparametric evaluation, which differs from parametric techniques, such as stochastic frontier analysis. The great advantage of DEA is that there is no need to assume specific functional forms and it is possible to deal with many products.
In this work, DEA was applied to measure technical efficiency, using both classic models CRS (constant returns to scale) and VRS (variable returns to scale) with input orientation, in which one seeks input minimization to obtain a particular product level. According to Coelli et al. (1998), con-sidering the assumption of constant returns to scale, the following problem of linear programming arises:
,
Minθ λθ
s.t. − + λ ≥yi Y 0 (1)
0
i
x X
θ − λ ≥
0
λ ≥
where yi is a vector (m x 1) of output of the ith DMU; xi is a vector (k x 1) of input of the ith DMU; Y is an output matrix (n x m) for n DMUs; X is an input matrix (n x k) for n DMUs; and θ is the efficiency score, a scalar whose value will be the efficiency measure for the ith DMU. If θ is equal to 1, DMU will be efficient; otherwise, it will be inefficient. The parameter λ is a vec-tor (n x 1) whose values are calculated to obtain the optimum solution. For an inefficient DMU, the λ values will be the weights used in the linear combination of other, efficient, DMUs, which influence the projection of the inefficient DMU on the calculated frontier.
returns is also named ‘pure technical efficiency’ as it is free of scale effects, and it can be obtained by the following linear programming model:
,
Minθ λθ
s. t. − + λ ≥yi Y 0 0
i
x X
θ − λ ≥ (2) '
1 1
Nλ =
0
λ ≥
where N1 is a vector (n x 1) of ones. According to Färe and Grosskopf (1994), when there are dif-ferences between the values of the efficiency scores in the models CRS and VRS, scale inefficiency is confirmed, indicating that the return to scale is variable, i.e., it can be increasing or decreasing.
The scale efficiency values for each analyzed unit can be obtained by the ratio between the scores for technical efficiency with constant and variable returns. Therefore:
(
)
(
,,)
CRS K K
s
VRS K K
X Y
X Y
θ θ =
θ (3)
where θCRS
(
XK,YK)
is the technical efficiency for the model with constant returns; θVRS(
XK,YK)
is the technical efficiency for the model with variable returns; and θs is the scale efficiency.
Coelli et al. (1998) have pointed out that model (2) makes no distinction as to whether DMU is operating in the range of increasing or decreasing returns. The only information that one has is that if the value obtained by calculating the scale efficiency in (3) is equal to one, the DMU will be operating with constant returns to scale. However, when θs is smaller than one, increasing or decreasing returns can occur. To understand the nature of scale inefficiency, i.e., whether it is due to increasing or decreasing returns to scale, it is necessary to consider another problem of linear programming. In this case, the convexity constraint of model (2), '
1 1
Nλ = , is replaced by N1'λ ≤1
for the case of non-increasing returns, or by '
1 1
Nλ ≥ , for the model with non-decreasing returns. Therefore, in this work, the following models were also implemented:
non-increasing returns:
,
Minθ λθ
s.t. − + λ ≥yi Y 0 0
i
x X
θ − λ ≥ (4) '
1 1
Nλ ≤
0
λ ≥
non-decreasing returns:
,
Minθ λθ
s.t. − + λ ≥yi Y 0 0
i
x X
θ − λ ≥ (5) '
1 1
Nλ ≥
0
It is worth emphasizing that all the models presented above should be solved n times, that is to say, the model is solved for each DMU in the sample.
The outputs and inputs considered were defined as follows:
Products (Y)
Value (R$) of production of milk and dairy products, including sales and self-consumption; •
and
Value (R$) of sales and self-consumption of animals. •
Input (X)
Total labor involved in the activity (hired or family) (R$); •
Feed supplied to the herd (green forage, silage, hay, feed supplements) (R$); •
Medicines supplied to herd (R$); •
Fuel and energy (R$); and •
Flow of facilities and equipment services, including expenditure on repairs and annual depre-•
ciation.
After having organized the matrices, the models were solved using the EMS – Efficiency Measurement System software, taking an input orientation to obtain the efficiency levels. Another important problem was to find the efficiency determining factors of the analyzed farms. The Tobit model is suitable for studying these effects, because the dependent variable, consisting of efficiency scores, is characterized by censored data. Souza (2006) has pointed out that an additional advanta-ge of censored models, such as Tobit, is that they can be used to adjust the efficiency measures in any context in which they are defined, given that the decision making units are independent when defining, for example, their production.
2.2 Tobit model
According to Worthington and Dollery (1999), an alternative to traditional DEA is the use of this approach followed by econometric estimations of the relationship between efficiency scores and their determinants. In a model proposed by Ray (1991), a DEA was used in the first stage to obtain the efficiency scores, considering only discretionary inputs. In the second stage, an econometric model was estimated, having the efficiency scores as dependent variables and nondiscretionary variables as explanatory variables.
As Wooldridge (2000) noted, traditional methods of regression are not suitable for censored data, since the variable to be explained is partly continuous and partly discrete. In this situation, ordinary least squares (OLS) analysis generates biased and inconsistent estimates of model para-meters.
The general model formulation with limited dependent variable (Tobit), as proposed by Greene (2003), is given by *
i i i
y = β + εX , where *
i
y is a latent variable; Xi represents a vector of explanatory variables; and β are the parameters to be estimated. It is assumed that the errors are normally distributed, with mean zero and variance σ2
, 2
~N(0, )
ε σ .
Considering that in this work the efficiency scores were defined by DEA, where the limit for a unit to be efficient is 1 (yc =1), the observed variables (yi) were defined as follows:
If * c i
y <y , then *
i i
y =y
If * c i
y ≥y , then c
i i
y =y
According to Greene (2003), the parameters estimation of the Tobit model is usually done by maximum likelihood, which provides consistent and asymptotically efficient estimators for para-meters and variance.
Vasconcellos and Alves (2000) showed that the likelihood function for the Tobit model is gi-ven by:
a) contribution of censored observations, where c i
y =y :
*
Pr( c) Pr( c) Pr( c) Pr( c )
i i i i i i
y =y = y ≥ y = Xβ + ε ≥y = ε ≥ − βy X (6)
Standardizing the variables, as follows:
Pr 1
c c c
i y Xi y Xi y Xi
ε − β − β − β = ≥ = Φ == − Φ
σ σ σ σ
(7)
b) contribution of non-censored observations, where c
i i
y = <y∗ y :
*
Pr(yi =yi)=Pr(yi= β + ε =Xi i) Pr(ε = − βi yi Xi ) (8)
Standardizing the variables, as follows:
1
Prεi yi − βXi yi − βXi
= = = ϕ
σ σ σ σ
(9)
1
( , ) log 1 log
c c
i i
c
i i i i
y y y y
y X y X
L
= <
− β − β β σ = − Φ + ϕ
σ σ σ
∑
∑
(10)where Φ(⋅) represents the standard normal cumulative distribution function; and ϕ ⋅( ) represents the standard normal probability density function.
As the interpretation of the regression coefficients does not directly allow one to know the marginal impact of the explanatory variables on the dependent variable, it is necessary to calculate the marginal effect, as shown by Greene (2003):
( ) j
i
X j
j
E y X
EM
X
−
∂ β
= = β Φ
∂ σ j =1,2,...,K (11)
where K is the number of explanatory variables and X− is a vector of means.
Equation 11 confirms that the marginal effect of the explanatory variables falls upon the ex-pected value of all yi observed.
In order to obtain the marginal effect of dummy variables, it is necessary to find the difference between the expected value of y when the dummy variable is equal to 1, i.e., it has the characteris-tic represented by this variable, and when it is equal to 0, if the characterischaracteris-tic is not present, with all the other values of explanatory variables being considered at the sample averages. Therefore,
, 1 , 0
j
X j i j i
EM = Ε y X X = − Ε y X X = .
To evaluate whether the regression model is globally valid, the likelihood ratio test (LR statis-tic) was carried out to identify whether the explanatory variables inserted in the model exert some type of influence on the dependent variable. The LR statistic is equal to 2 (FVLI – FVLR), where FVLI is the unrestricted log likelihood function, obtained from the regression with all explanatory variables and the intercept; and FVLR is the restricted log likelihood function, in which all the slope coefficients are considered equal to 0, keeping only the intercept. If the restriction is valid, then FVLI = FVLR, with the model not presenting global significance. The test statistic follows a chi-square distribution (χ2
), with degrees of freedom equal to the number of restrictions.
The efficiency scores obtained from the DEA model were used as dependent variables, con-sidering the CRS input orientated model. The CRS model was chosen for its high accuracy in discriminating efficiency. It is worth emphasizing that because of this higher conservatism, on account of the constant returns to scale, not every efficient milk-producing farm in the VRS model is efficient in the CRS model, although every efficient farm in CRS is mandatorily efficient in the VRS model.
The explanatory variables were defined as:
b) Labor productivity measured by the total revenue /labor costs ratio; and
c) Productivity of operating capital measured in liters of milk per year/total operating cost1.
d) Farmer’s age, in years;
e) Years of education;
f) Dummy variable to define whether farmers participated in a training program (1) or not (0), over the year;
g) Dummy variable to define the frequency of technical visits, (1) for at least one visit and (0) for farmers that were not visited, over the year; and
h) Dummy variable to define whether the farmer used rural credit (1) or he/she did not get any financing over the year (0).
As it can be observed, they were considered three different types of variables: productivity (cow, labor and operating capital), producer characteristics (age and education), and technical assistance and financing (training program, technical visit and rural credit). These variables are expected to have a positive impact on the levels of efficiency.
3 r
esults3.1 Relative technical efficiency of milk-producing farms
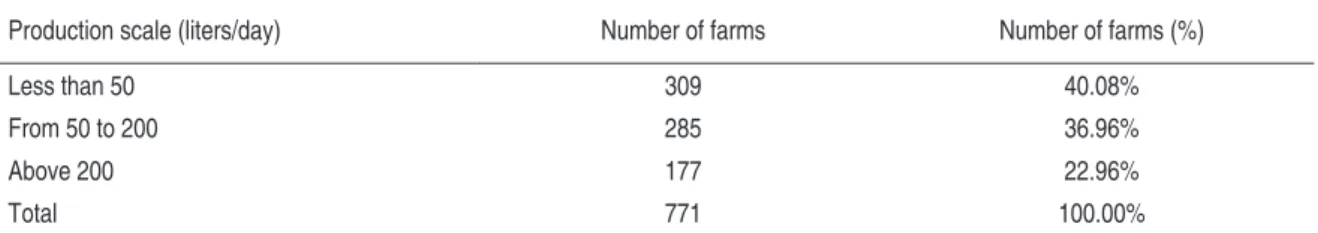
Table 1 shows the studied farms classified into three production levels. It can be observed that there is a greater concentration of small farms with production less than 50 liters/day. However, according to FAEMG (2006), the participation of small farms in the total production was 19.17% in 1995 and fell to 8.19% in 2005. There was also a reduction in the total number of small milk producers, indicating that a number of them abandoned the activity or moved to higher production levels. The small profit margin due to low production and the new quality standards have made the sector unviable for a number of producers.
Table 1 – Number of farms with respect to production level, state of Minas Gerais, 2005
Production scale (liters/day) Number of farms Number of farms (%)
Less than 50 309 40.08%
From 50 to 200 285 36.96%
Above 200 177 22.96%
Total 771 100.00%
Input orientated DEA models were used to obtain the efficiency levels of each milk-producing farm at the different production scales, under the assumption of constant returns to scale. The model with variable returns was obtained after introducing a convexity constraint into the model with constant returns. The efficiency measures with constant and variable returns made it possible to obtain the scale efficiency for each farm, given by the ratio between the measures of technical efficiency with constant returns and technical efficiency with variable returns.
Table 2 presents efficiency measures (with constant and variable returns) and descriptive statistics for milk-producing farms in the state of Minas Gerais. In all cases, production units with scores above 0.90 were considered efficient. The explanation for this flexibility, according to Ferreira (2005), is to avoid compromising the analysis through a DMU that stands out as being an outlier rather than for its true relative efficiency. Therefore, we sought not to compromise the re-sults, because it is common, when working with primary data, that some mistake may occur during data recording, or even the inclusion of a DMU that diverges, by non-observed conditions, from the reality to be studied.
Table 2 – Efficiency measures and descriptive statistics for milk-producing farms according to production scale, state of Minas Gerais, 2005
Production level
No. of
eficient farms
(θ ≥ 0.90)
% eficient farms
(θ ≥ 0.90)
Eficiency measures
Mean Standard deviation Maximum Minimum
Less than 50 liters/day Technical eficiency
(Constant returns) 47 15.21 0.61 0.22 1 0.16
Technical eficiency
(Variable returns) 68 22.01 0.69 0.21 1 0.16
Scale eficiency 178 57.61 0.88 0.14 1 0.35
From 50 to 200 liters/day Technical eficiency
(Constant returns) 50 17.54 0.67 0.20 1 0.28
Technical eficiency
(Variable returns) 86 30.18 0.76 0.19 1 0.35
Scale eficiency 170 59.65 0.89 0.12 1 0.50
Above 200 liters/day Technical eficiency
(Constant returns) 55 31.07 0.77 0.16 1 0.44
Technical eficiency
(Variable returns) 75 42.37 0.83 0.16 1 0.44
Under the assumption of constant returns, 47 of the total 309 farms producing less than 50 liters/day performed with efficiency equal to 0.9 or higher, i.e., only 15.21% had maximum techni-cal efficiency. The mean technitechni-cal efficiency was 61%. This result indicates that the other units of this group, which are not at the maximum efficiency level, can reduce the input level by 39%, on average, and nevertheless maintain the same level of daily production.
The impact of production scale on the technical efficiency level was found when the assump-tion of constant returns was relaxed, with the calculaassump-tion of the model with variable returns. Using this model for farms producing less than 50 liters/day, the number of units with technical efficiency increased, and the mean efficiency increased to 69%. The superior results found in the model with variable returns are due to the fact that the previous model did not take into consideration the exis-tence of scale inefficiency. The standard deviation of the mean in the model with variable returns was also lower than the one in the model with constant returns, which indicates concentration of farms in the highest efficiency levels.
If the measure of scale efficiency equals 0.9 or higher, the producer will be performing at op-timum scale. The results indicated that 178 farmers with production of less than 50 liters of milk a day (57.61%) were performing at optimum scale or were close to the optimum scale.
Producers with production levels above 200 liters/day showed mean technical efficiency of 0.77, under the assumption of constant returns. In the model with variable returns, the measure of mean technical efficiency was 0.83. This difference between the means indicates that six percen-tage points from the 23% ascribed to technical inefficiency (constant returns) are caused by scale inefficiency. Producers with production levels from 50 to 200 liters/day showed the greater measure of technical inefficiency (nine percentage points), which indicate that they were not performing at optimum scale.
The efficiency means of all production scales show that as the farms operate at a higher scale, there is a reduction in the inefficiency level. Therefore, whereas farms producing less than 50 liters/ day showed technical inefficiency of 39% on average, under the assumption of constant returns, units that performed at above 200 liters/day showed 23% inefficiency.
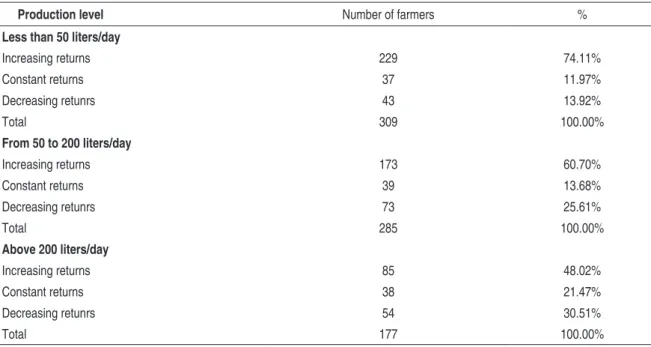
Regarding the scale, it is important to know how many farms are in each region of the pro-duction frontier, i.e. under conditions of increasing, constant or decreasing returns. A total of 229 farms, in the sample producing less than 50 liters/day, were found to be operating in the region of increasing returns or the suboptimal region (74.11%). (See Table 3). The production scale of these farms can increase while decreasing costs, since they were performing below the optimum produc-tion scale.
In the region of decreasing returns, there were 43 units (13.92%) that could increase their technical efficiency, if they reduced their production level. Decreasing returns to scale also refers to the scale named ‘supraoptimal’, which means that the farm was performing above its optimum scale of production. Finally, 37 units (11.97%) were performing in the region of constant returns, i.e. at the optimum scale of production.
perfor-ming in the range of decreasing returns. For those with decreasing returns, a reduction in the production level would imply an increase in technical efficiency, as they were spending more than they should on the business.
Table 3 – Distribution of farms according to the type of return, among different production levels, state of Minas Gerais, 2005
Production level Number of farmers %
Less than 50 liters/day
Increasing returns 229 74.11%
Constant returns 37 11.97%
Decreasing retunrs 43 13.92%
Total 309 100.00%
From 50 to 200 liters/day
Increasing returns 173 60.70%
Constant returns 39 13.68%
Decreasing retunrs 73 25.61%
Total 285 100.00%
Above 200 liters/day
Increasing returns 85 48.02%
Constant returns 38 21.47%
Decreasing retunrs 54 30.51%
Total 177 100.00%
3.2 Analysis of efficiency determinants
The results of the Tobit regression models confirmed that all the models can be considered globally valid, because the likelihood ratio test was significant at 1% (χ2critical = 21.66), indicating, therefore, that the considered variables adequately explain the efficiency levels of milk-producing farms of the state of Minas Gerais.
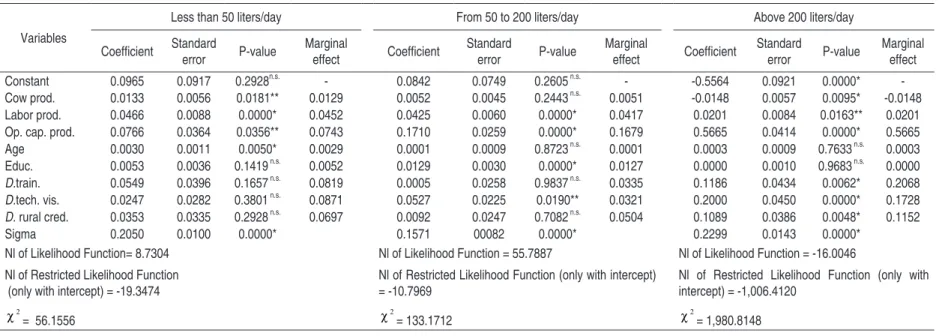
The estimates of the Tobit model that explain the technical efficiency of milk-producing farms of Minas Gerais are presented in Table 4 (Appendix). The signs of the explanatory variables agree with those expected at the three production levels, except for the variable ‘cow productivity’ at the production level above 200 liters/day.
Another important variable is the productivity of operating capital. The higher the production levels among those considered, the higher the marginal impact on technical efficiency. The results confirm that the productivity of the operating capital in the categories less than 50 liters/day and above 200 liters/day had marginal effects of 0.0743 and 0.5665, respectively. This is consistent with results reported by Gomes (1999), who verified that improved productivity of production factors provide highly technological farms with better indicators of performance.
The variable ‘farmer age’ was important only for technical efficiency of units with production scale less than 50 liters/day. This shows that, because these units have less access to technology, the accumulation of knowledge and experience over a lifetime brings positive impacts on the technical efficiency at this production level. The level of technical efficiency of these farms is not explained by variables such as rural credit, training, technical visits and education, given the limited or none-xistent access to these factors. Data from FAEMG (2006) show that, in Minas Gerais, milk produ-cers in the production category less than 50 liters/day have less participation in training programs, have fewer visits from technicians and are among the farmer groups with less access to rural credit. These farmers also have less access to education, since they spent less time in education, in years, than other farmers from higher production levels.
The variable ‘cow productivity’, measured in liters of milk per day/cows in lactation, was signi-ficant for production levels less than 50 liters/day and above 200 liters/day, the latter with a negative sign. The marginal effects in the categories less than 50 liters/day and above 200 liters/day were +0.0129 and –0.0148, respectively. The negative sign for the level above 200 liters/day was contrary to the expected result. This can nevertheless be explained when Table 3 is analyzed, confirming that among all the production levels, this had the largest percentage of units operating with decre-asing returns to scale. In addition, while 74.11% of farms with daily production less than 50 liters of milk operated with increasing returns, only 48.02% of farms producing above 200 liters of milk/ day operated with increasing returns. In the study carried out by Roberts (2003), the annual milk production had a negative impact on the group of farms producing more than 50 liters/day, given the presence of farms in this sample performing with decreasing returns to scale, which corrobora-tes the previous statement.
The dummy variable ‘technical visit’ was significant for farms of higher production levels (50 to 200 liters/day and above 200 liters/day). At these levels of production, the percentage of farms that had at least one technical visit was larger than the number of visits received by farms producing less than 50 liters/day. The impact of dummy technical visits on efficiency was 5.38 times higher for the category above 200 liters/day than for farms producing from 50 to 200 liters/day. Thus, for these two production levels, the presence of the technician was important in explaining the level of technical efficiency, having greater impact at higher production levels.
The variable ‘education’ was expected to be significant at all production levels; however, it was significant only for the farms producing between 50 and 200 liters/day. The most probable expla-nation is that there was measurement error in the variable (education) or it was capturing the effect of another, correlated, variable.
liters/day. These results reflect the data presented by FAEMG (2006), which showed that the vast majority of milk producers attending training programs and using rural credit are those producing above 200 liters of milk/day. While 45% of farmers producing 500 to 1,000 liters/day used rural credit, only 25.71% of those producing from 50 to 200 liters/day obtained credit, in 2005.
The variables ‘training program’ and ‘use of rural credit’ had marginal effects for farms with more than 200 liters/day of 0.2068 and 0.1152, respectively. The considerable size of the marginal effects shows the importance of these variables for milk producers to improve their production sys-tem and to achieve larger production scales.
It is worth pointing out that technical and managerial training is an important tool in in-creasing production, quality and cost reduction in the milk production process. Krug (2001) con-sidered that one of the main challenges is to provide milk producers with good technical support, associated with training, which result in greater professionalism and improvement of technical and economic indices.
4 c
onclusionsThe results of this study show that the majority of analyzed milk-producing farms of the state of Minas Gerais, Brazil, had technical inefficiencies, which renders action to correct inefficiency problems fundamental to the long-term sustainability of these farms. The results suggest that me-asures to increase efficiency should be applied to different factors, taking into account the particu-larities of each production scale group.
The level of technical efficiency and returns to scale indicated that the majority of the small farms group, producing less than 50 liters/day, need to increase production volume and therefore improve scale efficiency, because most of these farms have not achieved the optimum efficiency level, performing with increasing returns to scale.
The variables that were significant to farms with production of less than 50 liters/day indicate that impacts on technical efficiency level have originated only from internal factors, such as the farmer’s accumulated experience, represented by the age, labor productivity, cow productivity and operating capital productivity. Thus, the small farmers’ difficulties in obtaining credit, restricting the resources available to invest in technology and improve already existing techniques, has become critical for most of these milk producers, which have potential for expanding productivity without, however, obtaining sufficient incentives.
The difference in the technical efficiency level between small and large farms is also related to the fact that large farms perform with larger production volumes and have better operating con-ditions for the handling of milk, adding quality to the product. The combination of volume and quality contributes to the higher price of milk received by large farmers.
r
eferencesCOELLI, T.; RAO, D. S. P.; BATTESE, G. E. an introduction to efficiency and productivity analysis. London: Kluwer Academic, 1998.
FAEMG. Dignostico da pecuaria leiteira do estado de Minas Gerais em 2005: Relatório de Pesquisa. Belo Horizonte: FAEMG, 2006. 156p.
FÄRE, R., GROSSKOPF, S. Estimation of returns to scale using data envelopment analysis: A comment.
European journal of operational research, v. 79, p.379- 382, 1994.
FERREIRA, M. A. M.Eficiência técnica e de escala de cooperativas e sociedades de capital na indústria de
laticínios do brasil. PhD Thesis – Postgraduate Program in Applied Economics, Federal University of
Viçosa, 2005. 120p.
GOMES, A. P. impactos das transformações da produção de leite no numero de produtores e requerimentos de
mão-de-obra e capital. Ph.D Thesis – Postgraduate Program in Applied Economics, Federal University
of Viçosa, 1999.
GREENE, W. Econometric analysis. 5. ed. New Jersey: Prentice Hall, 2003. 1.026p.
KRUG, E. E. B. Estudo para identificação de benchmarking em sistemas de produção de leite no rio Grande
do Sul. Master Degree Thesis, Postgraduate Program in Management, Federal University of Rio
Grande do Sul, 2001. 186p.
RAY, S. Resource use efficiency in public schools: a study of Connecticut data. Management Science, v. 37, p.1620–1628, 1991.
ROBERTS, D. B. Eficiência da pequena produção de leite no estado de rondônia. Master Degree Thesis – Postgraduate Program in Applied Economics, Federal University of Viçosa, 2003. 79p.
SOUZA, G. da S.E. Significância dos efeitos técnicos na eficiência de produção da pesquisa agropecuária.
revista brasileira de Economia, v. 60, p. 69-86, 2006.
TUPY, O., YAMAGUCHI, L. C. T. Identificando benchmarks na produção de leite. revista de Economia
e Sociologia rural, v. 40, p. 81-96, 2002.
USDA - United States Department of Agriculture. Dairy: world, market and trade. circular Series. Dec 2007. Available at: <http://www.fas.usda.gov/dlp/circular/2007/dairy_12-2007.pdf>. Acess in: 2 apr. 2008. VASCONCELLOS, M. A. S., ALVES, D. Manual de econometria: nível intermediário. São Paulo, Atlas,
2000. 308p.
WOOLDRIDGE, J. M. Econometric analysis of cross section and panel data.Cambridge, The MIT Press, 2000. 735p.
ar ia L im a G on ça lv es , W ils on d a C ru z V ie ir a, J oã o E u stá q u io d e L im a, S eb as tiã o T ei xe ir a G om es 33 E co n . a plic ., 1 2( 2) : 3 21 -3 35 , a br -jun 2
Table 4 – Factors associated with technical efficiency of milk-producing farms of the state of Minas Gerais, 2005
Variables
Less than 50 liters/day From 50 to 200 liters/day Above 200 liters/day
Coeficient Standard error P-value Marginal effect Coeficient Standard error P-value Marginal effect Coeficient Standard error P-value Marginal effect
Constant 0.0965 0.0917 0.2928n.s. - 0.0842 0.0749 0.2605 n.s. - -0.5564 0.0921 0.0000*
-Cow prod. 0.0133 0.0056 0.0181** 0.0129 0.0052 0.0045 0.2443 n.s. 0.0051 -0.0148 0.0057 0.0095* -0.0148
Labor prod. 0.0466 0.0088 0.0000* 0.0452 0.0425 0.0060 0.0000* 0.0417 0.0201 0.0084 0.0163** 0.0201
Op. cap. prod. 0.0766 0.0364 0.0356** 0.0743 0.1710 0.0259 0.0000* 0.1679 0.5665 0.0414 0.0000* 0.5665
Age 0.0030 0.0011 0.0050* 0.0029 0.0001 0.0009 0.8723 n.s. 0.0001 0.0003 0.0009 0.7633 n.s. 0.0003
Educ. 0.0053 0.0036 0.1419 n.s. 0.0052 0.0129 0.0030 0.0000* 0.0127 0.0000 0.0010 0.9683 n.s. 0.0000
D.train. 0.0549 0.0396 0.1657 n.s. 0.0819 0.0005 0.0258 0.9837 n.s. 0.0335 0.1186 0.0434 0.0062* 0.2068
D.tech. vis. 0.0247 0.0282 0.3801 n.s. 0.0871 0.0527 0.0225 0.0190** 0.0321 0.2000 0.0450 0.0000* 0.1728
D. rural cred. 0.0353 0.0335 0.2928 n.s. 0.0697 0.0092 0.0247 0.7082 n.s. 0.0504 0.1089 0.0386 0.0048* 0.1152
Sigma 0.2050 0.0100 0.0000* 0.1571 00082 0.0000* 0.2299 0.0143 0.0000*
Nl of Likelihood Function= 8.7304 Nl of Likelihood Function = 55.7887 Nl of Likelihood Function = -16.0046
Nl of Restricted Likelihood Function (only with intercept) = -19.3474
Nl of Restricted Likelihood Function (only with intercept) = -10.7969
Nl of Restricted Likelihood Function (only with intercept) = -1,006.4120
2
χ = 56.1556 χ2
= 133.1712 χ2= 1,980.8148
*Significant at 1%; * * significant at 5%; n.s., non-significant.