Cost-Effectiveness of Coal Workers'
Pneumoconiosis Prevention Based on Its
Predicted Incidence within the Datong Coal
Mine Group in China
Fuhai Shen1,2☯, Hongbo Liu1☯, Juxiang Yuan2, Bing Han1, Kai Cui1, Yu Ding3, Xueyun Fan2, Hong Cao3, Sanqiao Yao2, Xia Suo3, Zhiqian Sun2, Xiang Yun2, Zhengbing Hua2, Jie Chen1*
1School of Public Health, China Medical University, Shenyang, Liaoning, 110013, P.R. China,2School of Public Health, Hebei United University, Tangshan, Hebei, 063000, P.R. China,3Occupational Disease Prevention and Treatment Hospital of Datong Coal Mine Group, Datong, Shanxi, 037003, P.R. China ☯These authors contributed equally to this work.
Abstract
We aimed to estimate the economic losses currently caused by coal workers’ pneumoconio-sis (CWP) and, on the bapneumoconio-sis of these measurements, confirm the economic benefit of pre-ventive measures. Our cohort study included 1,847 patients with CWP and 43,742 coal workers without CWP who were registered in the employment records of the Datong Coal Mine Group. We calculated the cumulative incidence rate of pneumoconiosis using the life-table method. We used the dose-response relationship between cumulative incidence density and cumulative dust exposure to predict the future trend in the incidence of CWP. We calcu-late the economic loss caused by CWP and economic effectiveness of CWP prevention by a step-wise model. The cumulative incidence rates of CWP in the tunneling, mining, combining, and helping cohorts were 58.7%, 28.1%, 21.7%, and 4.0%, respectively. The cumulative inci-dence rates increased gradually with increasing cumulative dust exposure (CDE). We pre-dicted 4,300 new CWP cases, assuming the dust concentrations remained at the levels of 2011. If advanced dustproof equipment was adopted, 537 fewer people would be diagnosed with CWP. In all, losses of 1.207 billion Renminbi (RMB, official currency of China) would be prevented and 4,698.8 healthy life years would be gained. Investments in advanced dustproof equipment would be total 843 million RMB, according to our study; the ratio of investment to restored economic losses was 1:1.43. Controlling workplace dust concentrations is critical to reduce the onset of pneumoconiosis and to achieve economic benefits.
Introduction
Coal workers' pneumoconiosis (CWP) is the most common occupational disease among coal workers [1–6]. These workers develop CWP because they are exposed to coal dust, mixed dust, OPEN ACCESS
Citation:Shen F, Liu H, Yuan J, Han B, Cui K, Ding Y, et al. (2015) Cost-Effectiveness of Coal Workers' Pneumoconiosis Prevention Based on Its Predicted Incidence within the Datong Coal Mine Group in China. PLoS ONE 10(6): e0130958. doi:10.1371/ journal.pone.0130958
Editor:Haotian Lin, Sun Yat-sen University, CHINA
Received:January 20, 2015
Accepted:May 27, 2015
Published:June 22, 2015
Copyright:© 2015 Shen et al. This is an open access article distributed under the terms of the
Creative Commons Attribution License, which permits unrestricted use, distribution, and reproduction in any medium, provided the original author and source are credited.
Data Availability Statement:The dataset is from WP study program, School of Public Health China, Medical University, and the occupational disease prevention and treatment hospital of Datong Coal Mine Group. Due to specific ethical and legal restrictions, the authors have anonymized the name of the subject and coal mine, date of birth, identity card number, labour code, and X-ray film number of the subject in the raw dataset. All relevant data are within the paper and its Supporting Information files.
and silica dust during the coal mining process. Currently, CWP is the most prevalent occupa-tional disease in the world, especially in developing countries [7–10]. In China, by the end of 2013, there were 750,300 cases of pneumoconiosis [11] and approximately half of them were CWP.
CWP is an incurable and progressive disease. As the disease progresses, patients with CWP gradually lose their livelihood and healthy life years [12]. As a result, patients with pneumoco-niosis confer a significant economic burden on families, businesses, and society [13–15]. Great economic benefits could be achieved with dustproof efforts and the resulting reduction in the incidence of pneumoconiosis. One study showed that if dust control devices were installed in all agate-grinding facilities in Khambhat, India, the prevalence of silicosis and tuberculosis would be reduced and financial benefits would be achieved over time [16]. Similarly, the eco-nomic losses caused by pneumoconiosis could be avoided by taking effective measures to reduce the incidence of CWP.
Some measures have been taken to prevent or delay the onset of CWP, including technolog-ical innovation, wet operation, dust removal by ventilation, individual protection, occupational health management, health education, supervision, and inspection. However, any preventive measure requires a significant up-front monetary investment, while economic losses caused by CWP occur over a long period. As such, future losses are easy to ignore in order to avoid a cur-rent investment. Still, all interested parties, including management personnel, laborers, govern-ment agencies, health professionals, and advocacy organizations, should know the costs of hazardous working conditions and how to mitigate the risks. Therefore, it is necessary to calcu-late economic losses currently caused by CWP and, on the basis of these measurements, con-firm the economic benefits of preventive measures.
A comprehensive benefit assessment includes a cost-effectiveness analysis and a cost-benefit analysis. The cost-effectiveness analysis refers to a comparative analysis between investment and health effect, which can be expressed in monetary terms [17]. Oxenburgh believed that the cost-benefit model was a relatively simple assessment tool in occupational health economic evaluations. This tool provides important information for decision-makers, since it defines the minimum investment of occupational health resources needed to achieve maximum results and effectiveness [18].
The current revision of“Ordinance of industrial injury insurance”substantially increased compensation to pneumoconiosis patients, which, in effect, increased economic losses attrib-uted to pneumoconiosis [19]. Economic losses can be categorized as direct and indirect. Direct losses include payments for hospital stays, physician visits, allied health services, rehabilitation services, nursing home care, home health care, medical equipment, and insurance administra-tion, as well as payments made directly to patients. Indirect losses include productivity losses, such as wage losses, household productivity losses, and employer productivity losses [20]. Dis-ability-adjusted life years (DALY) is an accepted method for calculating social productivity loss and, for this study, we used DALY to calculate the loss of healthy life and the loss of social pro-ductivity [21,22]. We considered an investment in dustproof equipment to include dustproof facilities and supply costs, personal protective equipment costs, occupational health protection training costs, and dust detection and evaluation costs [13,23].
The Datong Coal Mine Group, whose predecessor was the Datong Mining Bureau, was established in 1949 and restructured in July 2000. The Datong Coal Mine Group has experience in artificial exploitation, blasting, and caving processes. After 1970, mechanical mining was widely adopted among the coal mining industry. At the same time, dustproof measures, wet operation, and mechanical ventilation were put into practice in the coal mining process. After 1980, an automated machinery mining process was added. Dust control measures have been gradually strengthened in coal mining workplaces over the last three decades [24]. The Datong data collection and analysis, decision to publish, or
preparation of the manuscript.
Coal Mine Group is representative of the coal mining industry in China for its experience in coal production and dustproof efforts.
For our study, we evaluated dust-exposed workers with and without CWP from the Datong Coal Mine Group. The goals of our study were to analyze the prevalence of CWP and predict the number of CWP cases among workers who first experienced dust exposure between 1970 and 2010; to calculate economic losses and healthy life losses due to CWP; and to calculate eco-nomic and social benefits achieved as a result of dustproof investments. This is important information for occupational health management departments and coal mining enterprises. We aimed to provide a theoretical basis for the formulation and revision of laws, regulations, and standards for the prevention of pneumoconiosis in China.
Study Population and Methods
Study population
Our study cohort were conducted in 2012 in Datong Coal Mine Group at a total of 15 mines. Coal workers were included in our study if their dust exposure started between January 1, 1970 and December 31, 2010 as part of the Datong Coal Mine Group and if they were exposed to dust for at least one year. We required physical examination cards, detailed records of occupa-tional history, and posterior-anterior chest radiographs for all workers enrolled in our study. The study was approved by the Medical Ethics Committee of China Medical University (per-mit number CMU6206-3008). The need for written consent was not deemed necessary and was waived by the Medical Ethics Committee. The study was carried out in accordance with the approved guidelines. In order to protect the privacy of research subjects and the confidenti-ality of their personal information, Identifying information, including names, initials, identity card numbers, or job serial numbers of the subjects, did not exsit in our written descriptions.
We constructed a database, which included demographic details, work history records including the dates of dust exposure, individual medical records, pneumoconiosis diagnosis records, dust concentrations of the workplace, economic losses attributed to pneumoconiosis patients, and costs associated with dustproof facilities. The demographic details and work his-tory records were obtained from personnel files in the human resources department. The indi-vidual medical and pneumoconiosis diagnosis records were obtained from the occupational disease prevention and treatment hospital. The dust concentrations of the workplaces were obtained from the department of dust detection and monitoring. The economic loss data were obtained from department of industrial injury insurance, hospital, and finance. The costs of dustproof equipment and supplies were obtained from the equipment department and finance department.
Diagnosis of pneumoconiosis
Occupational categories
We defined four work areas in the underground mines of the Datong Coal Mine Group by reviewing the work history of the subjects [28,29]: tunneling, mining, combining, and helping. Workers who consistently worked in the same area were defined by their respective work area titles: tunneling, mining, combining, or helping. The duration of dust exposure for each coal worker was the sum of years of each dust exposure job. The duration of each dust exposure job was measured from the start date to the end date of the job. Workers were classified as“ tunnel-ing”if their duration in tunneling areas accounted for more than half of the entire duration of dust exposure. Workers were classified as“mining”if they worked in tunneling areas for less than 2 years and their duration in mining areas accounted for more than half of the entire duration of dust exposure. Workers were classified as“combining”if their duration in tunnel-ing areas was more than 2 years but less than half of the entire duration of dust exposure. Workers were classified as“helping”if they could not be included in the tunneling, mining, or combining categories.
Dust exposure data
Dust was collected on a membrane filter and measured by gravimetric method, which is the national standard of measurement for dust concentration [30,31]. This information was then used to calculate the cumulative dust exposure (CDE) for each coal worker [32]. CDE is usually estimated according to the following formula [8] (Eq 1):
CDE¼X
n
j¼1
ðCjTjÞ Eq 1
In the formula, CDE is calculated in milligrams/cubic meter-years (mgyears); n is the total number of job titles held by the individual during his work history; Cj is the 8-hour time-weighted mean concentration of dust in milligrams/cubic meter for thejth job title within a facility and an employment period; and Tj is the duration of employment in years in thejth job.
Calculation of the cumulative incidence rate
We established four subcohorts according to occupational categories: tunneling, mining, com-bining, and helping. We calculated the cumulative incidence rate of CWP in the corresponding years of observation for each cohort using the life-table method [23,28]. The rates were ana-lyzed by Peto’s log-rank test. We calculated the cumulative incidence rates, using the tunneling cohort as an example in Table B inS1 File. Cumulative incidence rates of the other cohorts were calculated in the same manner.
Predicted future incidence of CWP
We calculated the dose-response relationship between cumulative incidence density (CID) and CDE for the four occupational categories. We also introduced the variable of person-years in order to account for time in the equation. The incidence density of each dose group was the ratio of incidence number and the adjusted observed person-years. CID was calculated by the life-table method. We translated CDE into its natural logarithm and translated CID into its logit value, according to the following formula (Eq 2):
logit¼ln P
1 P
By this method, we obtained the linear regression equation for the logit and the natural log-arithm of CDE. We calculated the estimated values of incidence density from the equation that was used to predict the future incidence of CWP at the dust concentration level of 2011 and after adopting dust-reduction measures.
Compensation standards of direct economic loss caused by CWP
Direct economic losses included medical costs, lump-sum grants for disability, disability allow-ances, lump-sum grants for death, funeral grants, nursing costs, food allowallow-ances, traffic fees, and pension costs for dependent relatives (Table C inS1 File) [14,33,34]. The total amount of compensation was calculated according to the 2010 revision of“Ordinance of industrial injury insurance”[19].
Medical costs included inspection fees, hospitalization fees, and medicine and treatment-related costs. The total medical cost for each CWP patient was calculated. Each CWP patient was compensated with a lump-sum grant for disability (Table D inS1 File). Disability allow-ances were only distributed to patients whose disability grades ranged from 2 to 6 before retire-ment (Table E inS1 File). Funeral grants equals the average monthly wage of the staff and workers in a region multiplied by 6 months, which were distributed to relatives of deceased CWP patients. If the disabled workers died during the period of suspension with pay caused by CWP, their relatives were compensated with a lump-sum grant for death. Nursing costs were compensated to CWP patients who required nursing care from industrial injury insurance funds (Table F inS1 File). Food allowances were paid to those who required medical treatment, which is 35 RMB per day in Shanxi Province. Dependent relative pension costs were paid to the families of deceased CWP patients whose disability grades ranged from 2 to 4 or CWP patients who died during the period of suspension with pay regardless of disability grade, if the relatives relied on CWP patients when they were alive. Traffic fees were compensated to CWP patients who traveled to other areas for medical treatment. In our study, very few CWP patients traveled to other areas for medical treatment, so we did not calculate this factor into the total economic loss.
Compensation standards of indirect economic loss caused by CWP
Indirect economic losses included social productivity losses caused by CWP patients, costs of training new employees, traffic fees for people who accompanied CWP patients, social produc-tivity losses caused by people who accompanied CWP patients, and losses owed to stopping or cutting production (Table C inS1 File) [15].
Social productivity losses attributed to pneumoconiosis patients were calculated using
∑DALY, gross domestic product (GDP) per capita, productivity weight [22]. DALY was used
limit production because of dust hazards, there was no economic loss related to stopping or cutting production.
Economic effectiveness of investment in dustproof equipment and
practices
We calculated the economic benefits of dustproof to be the difference between the monetary investment in dustproof equipment and practices and the restored economic losses owed to the investment. We used current CWP patients as the example for calculating economic losses and we used prices and costs in 2011 as the standards for compensation and costs. Further, social benefits were calculated by assessing the restoration of healthy life years of the workers exposed to dust.
Results
Baseline characteristics
There were 49210 people in Datong Coal Mine Group who started to expose to dust from 1970 to 2010. 3621 people were excluded because of incomplete data, such as any drop outs, workers loss to follow up, or workers who die from other disease. 45589 subjects met the requirements, the coincidence rate was 92.6%. We evaluated a total of 45,589 coal workers in our study, including 1,847 patients with CWP and 43,742 workers without CWP. The average age of CWP onset for the 1,847 CWP patients was 45.9 ± 8.3 years and the average duration of dust exposure for these patients was 19.8 ± 7.2 years. In 2011, the average age of the 43,742 coal workers without CWP was 42.3 ± 9.6 years and the average duration of dust exposure for these workers was 18.9 ± 9.5 years. We observed statistically significant differences between the dust-exposed workers with CWP and without CWP in years of first dust exposure, occupational cat-egory, and CDE, according to the chi square test (Table 1).
The cumulative incidence rates of CWP of tunneling, mining, combining, and helping cohorts were 58.7%, 28.1%, 21.7%, and 4.0%, respectively, during the 42-year observation period (Fig 1A). We observed significant differences between occupational categories, accord-ing to the log-rank test. The cumulative incidence rate of CWP in the group of workers first exposed to dust in the 1970s was 12.7% and the rate in the group first exposed to dust in the 1980s was 7.6% during the 32-year observation period (Fig 1B). The cumulative incidence rates were 25.4%, 7.3%, and 3.2% among coal workers whose CDEs were2000 mgyears,
100 mgyears, and<100 mgyears during the 42-year observation period (Fig 1C). The
dust concentration decreased with time in different work areas (Table 2). We observed a dose-response relationship between cumulative incidence rate and CDE (S1 Fig).
Prediction model of CWP
The cumulative incidence densities were calculated for each group of cumulative dust exposure by using method of life table for tunneling workers (Table G inS1 File). We observed a dose-response relationship between CDE and cumulative incidence density estimation (Fig 2A1). After logarithmic transformation of variables, the following linear equation of the two variables was obtained (Eq 3) (Fig 2A2):
In the same way, we observed a dose-response relationship between CID and CDE for min-ing workers (Fig 2B1). The linear equation for the mining workers was (Eq 4) (Fig 2B2):
logit¼2:6374lnðCDEÞ 26:834: Eq 4
The dose-response relationship for combining workers is shown inFig 2C1. The linear equation of the combining workers was (Eq 5) (Fig 2C2):
logit¼7:6473lnðCDEÞ 67:262: Eq 5
The dose-response relationship for helping workers is shown inFig 2D1. The linear equa-tion of the mining workers was (Eq 6) (Fig 2D2):
logit¼3:8627lnðCDEÞ 24:127: Eq 6
The incidence density estimation for each segment was calculated by these equations. The tunneling cohort is used as an example in Table H inS1 File.
Table 1. Characteristics of coal workers with and without coal workers’pneumoconiosis (CWP).
Characteristic With CWP (n = 1847)(%) Without CWP (n = 43742)(%) χ2 P
Years offirst dust exposure 1970s 1,217(65.9) 5,848(13.4) 3.7×10³ <0.001
1980s 630(34.1) 3,7894(86.6)
Occupational category Tunneling 735(39.8) 2,634(6.0) 3.6×10³ <0.001
Mining 619(33.5) 1,0160(23.2)
Combining 297(16.1) 4,721(10.8)
Helping 196(10.6) 26,227(60.0)
Cumulative dust exposure <100 mgyears 168(9.1) 26,589(60.8) 4.5×10³ <0.001
100 mgyears 218(11.8) 9,828(22.5)
2000 mgyears 1,461(79.1) 7,325(16.7) doi:10.1371/journal.pone.0130958.t001
Fig 1. Cumulative incidence rate of CWP among coal workers.(A) Cumulative incidence rate of CWP in different occupational categories: tunneling cohort vs mining cohort (χ2= 597.7; P<0.001), tunneling cohort
vs combining cohort (χ2= 228.9; P<0.001), tunneling cohort vs helping cohort (χ2= 3,116.7; P<0.001),
mining cohort vs combining cohort (χ2= 17.3; P<0.001), mining cohort vs helping cohort (χ2= 654.4; P<0.001), and combining cohort vs helping cohort (χ2= 827.9; P<0.001). (B) Cumulative incidence rate of
CWP according to years of first dust exposure: 1970s vs 1980s (χ2= 27,432.5; P<0.001). (C) Cumulative
incidence rate of CWP according to cumulative dust exposure:2000 mgyears group vs100 mgyears group (χ2= 338.1; P<0.001),2000 mgyears group vs<100 mgyears group (χ2= 1,867.9; P<0.001), and100 mgyears group vs<100 mgyears group (χ2= 308.9; P<0.001).
Prediction of future CWP cases assuming the dust levels of 2011
For our prediction of new cases of CWP, we assumed that future dust concentrations would remain at the level of those in 2011, which were 31.6 mg/m3, 23.2 mg/m3, 23.2mg/m3, and 0.2 mg/m3in the tunneling, mining, combining, and helping areas, respectively. According to the incidence density estimation of tunneling, mining, combining, and helping cohorts, we pre-dicted the number of future CWP cases within the life expectancy of each subject to be 1,422.1, 1,254.9, 1,195.8, and 427.3 among tunneling (Tables I & J inS1 File), mining (Table K inS1 File), combining (Table L inS1 File), and helping cohorts (Table M inS1 File), respectively. We predicted a total of 4300 new CWP cases among workers in the four occupational catego-ries who had their first dust exposure between 1970 and 2010, if workplace dust concentrations remain at the levels of those in 2011 (Table 3).
Prediction of future CWP cases after decreasing dust levels
Dustproof equipment could decrease workplace dust concentrations by eighty percent of the present levels [35]. To assess the potential decline in CWP after dustproof, we calculated the CDE for each coal worker until his retirement assuming a dust concentration at 20% of the 2011 level. The assumed dust concentrations were 6.3 mg/m3, 4.6 mg/m3, 4.6 mg/m3, and 0.04 mg/m3in the tunneling, mining, combining, and helping areas, respectively. According to the incidence density estimations of the tunneling, mining, combining, and helping cohorts, we predicted the number of future CWP cases within the life expectancy of each subject to be 1,245.5, 1,084.7, 1,020.5, and 412.5 among tunneling (Table N inS1 File), mining (Table O inS1 File), combining (Table P inS1 File), and helping cohorts (Table Q inS1 File), respec-tively. We predicted that 3,763 coal workers would develop CWP after the implementation of advanced dustproof equipment and practices, which equates to 537 fewer people with CWP (Table 3).
Direct economic losses attributed to CWP patients
According to our investigation, the average annual medical cost of each pneumoconiosis patient was 23,137.5 RMB. The average course of pneumoconiosis disease was 31.6 years, and the average total expense of each case was 730,394.1 RMB. The total medical cost of the 1,847 pneumoconiosis patients over the entire course of the disease was 1,349,037,953.3 RMB (Table R inS1 File).
The average monthly salary of underground coal mine workers in the Datong Coal Mine Group was 8,056.2 RMB. The total lump-sum disability grant was calculated to be
248,717,519.0 RMB (Table S inS1 File).
In this study, 1,047 CWP patients had disability grades that ranged from 2 to 6 before retire-ment. The total disability allowance for CWP patients was calculated to be 1,199,356,930.5 RMB, based on the costs in 2011 (Table T inS1 File).
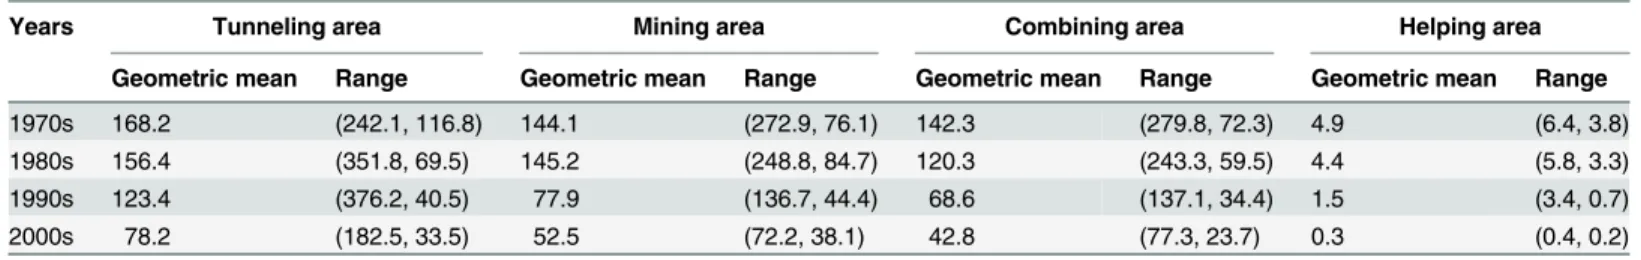
Table 2. Geometric means (+1 SD, -1 SD) of dust concentration (mg/m3) in the working areas according to years.
Years Tunneling area Mining area Combining area Helping area
Geometric mean Range Geometric mean Range Geometric mean Range Geometric mean Range
1970s 168.2 (242.1, 116.8) 144.1 (272.9, 76.1) 142.3 (279.8, 72.3) 4.9 (6.4, 3.8)
1980s 156.4 (351.8, 69.5) 145.2 (248.8, 84.7) 120.3 (243.3, 59.5) 4.4 (5.8, 3.3)
1990s 123.4 (376.2, 40.5) 77.9 (136.7, 44.4) 68.6 (137.1, 34.4) 1.5 (3.4, 0.7)
2000s 78.2 (182.5, 33.5) 52.5 (72.2, 38.1) 42.8 (77.3, 23.7) 0.3 (0.4, 0.2)
The average monthly wage in Shanxi Province was 3,269.2 RMB in 2011 [36]. Funeral grants for the 1,847 CWP patients were calculated to be 36,228,941.9 RMB (3,269.2 RMB × 6 months × 1847 persons), based on the costs in 2011. Funeral grants for persons who did not die from work are 2,000 RMB [37]. Therefore, in our study, funeral grants totaled 32,534,941.9 RMB [36,228,941.9 RMB–(2,000 RMB × 1,847 persons)].
Of the 1,847 patients with CWP, 23 died during the period of suspension with pay. The average wage of workers in China was 41,799 RMB in 2010 [36]. For our investigation, we cal-culated the lump-sum grants for death to be 19,227,540 RMB (41,799 RMB × 20 times × 23 persons).
The average annual wage of workers in Shanxi Province in 2011 was 39,230 RMB [36]. The total nursing costs were calculated to be 257,314,866.1 RMB(Table U inS1 File).
A daily food allowance of 20 RMB was subsidized to hospitalized CWP patients in Shanxi Province. In 2011, the average length of hospitalization of CWP patients from the Datong Coal Mine Group was 75 days. The average disease duration of the 1,847 CWP patients was 31.6 years. Therefore, we calculated the total food allowance to be 87,464,685 RMB (20 RMB × 75 days × 1,847 persons × 31.6 years).
In 2011, the average dependent relative pension cost for deceased CWP patients from the Datong Coal Mine Group was 17,782.32 RMB. By the end of 2011, the average age of death of the 210 CWP patients who died was 55.4 years. The average life expectancy of the patients was 80.1 years. The average life loss was 24.7 years. Therefore, we calculated the total dependent rel-ative pension costs to be 294,480,198.3 RMB (17,782.32 RMB × 671 persons × 24.7 years) for 655 CWP patients whose disability grade ranged from 2 to 4 and for 16 CWP patients whose disability grade was 7 but died during the period of suspension with pay.
For our analysis, we calculated the direct economic losses caused by 1,847 CWP patients to total 3,488,134,634.1 RMB, assuming prices and costs of 2011. The average direct economic loss was 1,888,540.7 RMB per patient with CWP (Table 4). Medical costs accounted for 38.7% and disability allowances accounted for 34.4% of total direct economic loss.
Indirect economic losses attributed to CWP patients
At the end of our observation period, among 1,847 patients with CWP, 1,637 patients were alive and 210 cases were deceased. Eight patients had a disability grade of 2, 147 had a grade of Fig 2. Dose-response relationship between cumulative incidence density and cumulative dust exposure in the cohorts and their variable transformation.(A1) response relationship between cumulative incidence density and cumulative dust exposure in the tunneling cohort. (A2) Dose-response relationship between the logit and the natural logarithm of cumulative dust exposure in the tunneling cohort. (B1) Dose-Dose-response relationship between cumulative incidence density and cumulative dust exposure in the mining cohort. (B2) Dose-response relationship between the logit and the natural logarithm of cumulative dust exposure in the mining cohort. (C1) Dose-response relationship between cumulative incidence density and cumulative dust exposure in the combining cohort. (C2) Dose-response relationship between the logit and the natural logarithm of cumulative dust exposure in the combining cohort. (D1) Dose-response relationship between cumulative incidence density and cumulative dust exposure in the helping cohort. (D2) Dose response relationship between the logit and the natural logarithm of cumulative dust exposure in the helping cohort.
doi:10.1371/journal.pone.0130958.g002
Table 3. Prediction of future CWP cases at the dust levels of 2011 and after implementation of dustproof equipment and practices.
Occupational category n Predicted number of cases at the dust levels of 2011 Predicted number of cases after dustproof Difference
Tunneling 2,634 1,422.1 1,245.5 176.6
Mining 10,160 1,254.9 1,084.7 170.2
Combining 4,721 1,195.8 1,020.5 175.3
Helping 26,227 427.3 412.5 14.8
Total 43,742 4,300.0 3,763.2 536.9
3, 500 had a grade of 4, 432 had a grade of 6, and 760 had a grade of 7. The age of CWP onset ranged from 22.0 to 75.9 years, and the average age was 45.9 years (Table V inS1 File). Total YLD was 13,313.4 years for all of the 1,847 patients with CWP (Table W inS1 File). Total YLL was 2,848.8 years for the 210 deceased CWP patients (Table X inS1 File). Total DALY was 16,162.2 years for the 1,847 patients with CWP. The average DALY was 8.8 years for each patient with CWP (Table Y inS1 File).
In 2011, China's per capita GDP was 35,181 RMB [36]. The economic social productivity loss caused by CWP was 426,239,926.3 RMB, according to productivity weights of the different age groups (Table Z inS1 File).
In our study, 1,730 of the 1,847 coal workers with CWP experienced disease onset before retirement. Training each new coal worker cost approximately 1,286 RMB in the Datong Coal Mine Group. Therefore, we calculated the total cost of training new supplemental employees to be 2,224,780 RMB (1,286 RMB × 1,730 persons).
According to travel standards for China's residents, the average annual traffic fee per capita was 2,000 RMB. Based on our investigation, the average duration of pneumoconiosis was 31.6 years and patients were hospitalized for an average of 75 days per year. For this analysis, we assumed that each hospitalized patient required one accompanying family caregiver. There-fore, we calculated traffic fees to be 23,962,927.4 RMB (2,000 RMB × 1,847 persons × 31.6 years × 75 days/365 days/year).
In 2011, China's GDP per capita was 35,181 RMB [36] and the productivity weight of the total population was 0.5. Therefore, we calculated the social productivity loss caused by accom-panying family members, assuming one per hospitalized patient, to be 210,759,937.2 RMB (35,181 RMB × 1,847 persons × 0.5 × 31.6 years × 75 days/365 days/year).
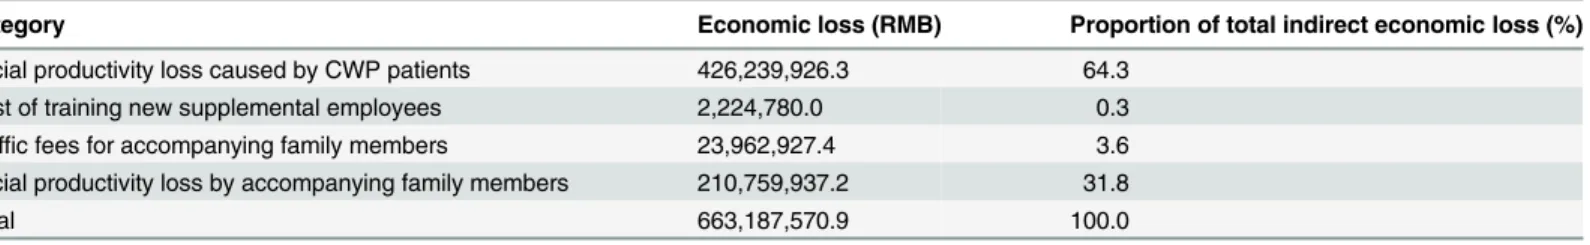
The total indirect economic losses caused by CWP patients totaled 663,187,570.9 RMB. The average loss was 359,062.0 RMB per patient (663,187,570.85 RMB / 1,847 persons). Social pro-ductivity loss caused by CWP patients accounted for 64.3% and social propro-ductivity loss caused by accompanying family members accounted for 31.8% of the total indirect cost (Table 5).
Total economic losses caused by CWP patients
On the basis of our calculations, we concluded that the total economic loss caused by 1,847 CWP patients who experienced their first dust exposure between January 1,1970 and Decem-ber 31, 2010 was 4,151,322,205.0 RMB (3,488,134,634.1 RMB + 663,187,570.9 RMB). The aver-age loss attributed to each patient was 2,247,602.7 RMB (4,151,322,205.0 RMB / 1,847
persons). Direct economic loss accounted for 84.0% and indirect economic loss accounted for Table 4. Direct economic losses attributed to patients with CWP.
Category n Economic loss (RMB) Proportion of total direct economic loss (%)
Medical costs 1,847 1,349,037,953.3 38.7
Lump-sum grants for disability 1,847 248,717,519.0 7.1
Disability allowances 1,047 1,199,356,930.5 34.4
Funeral grants 1,847 32,534,941.9 0.9
Lump-sum grants for death 23 19,227,540.0 0.6
Nursing costs 655 257,314,866.1 7.4
Food allowances 1,847 87,464,685.0 2.5
Dependent relative pension costs 671 294,480,198.3 8.4
Total 1,847 3,488,134,634.1 100.0
16.0% of total economic loss. Direct economic loss was 5.3 times greater than the indirect eco-nomic loss (Table AA inS1 File).
Cost-effectiveness analysis of future dustproof investments
If the 43,742 coal mine workers in our study continued working from January 1, 2012 until their retirement, the average dust exposure time would be 17.73 years. If new equipment, such as an underground water purification system and a high-pressure spray system with pneumatic power, was adopted, workplace dust concentrations would decrease by 80% of the present lev-els [35]. According to the results of our study, the average number of working areas (tunneling, mining, and combining) and trans-shipment points were 13 and 37, respectively. Working areas included the fully mechanized coal mining area, general machine mining area, blasting mining area, rock roadway, coal roadway, and half coal-rock roadway in the 15 mines of the Datong Coal Mine Group. New equipment and related maintenance costs of dustproof initia-tives would be 6 million RMB in the first year and 3 million RMB in each subsequent year. Assuming that the new equipment was adopted in all 15 mines, the cost would total 843 million RMB for 17.73 years [(6 million RMB × 1 year + 3 million RMB × 16.73 years) × 15]. If the dustproof equipment and practices were adopted, dust concentrations would decrease to 20% of the present levels. As a result, 537 fewer coal workers would develop CWP and 1.207 billion RMB (2.248 million × 537 persons) in economic losses would be restored. Economic benefits of 364 million RMB (1,207 million—843 million) and 4,698.8 healthy life years (8.8 years × 537 persons) would be obtained by implementing dust-reduction strategies.
Discussion and Conclusions
Occupational injuries and diseases occur as a result of the production of goods and services. In other words, they are economic phenomena [38]. The failure to recognize this central aspect of occupational health limits the effectiveness of interventions ostensibly designed to prevent dis-ease and injury [13]. Currently, pneumoconiosis is the primary occupational disease in China [11] and the government has assigned great importance to the prevention and treatment of pneumoconiosis. In 1987, "Pneumoconiosis disease prevention and control regulations of the People's Republic of China" was promulgated and implemented [39]. Additionally, in 2001, "Law of the People’s Republic of China on Prevention and Control of Occupational Diseases" was promulgated; it was revised in 2011 [40]. The implementation of these laws and regula-tions provided legal guarantees for the prevention and treatment of pneumoconiosis.
Despite laws aimed at prevention, the cumulative incidence rates of CWP remained high among the Datong Coal Mine Group. We evaluated the number of patients with CWP who experienced their first dust exposure between 1970 and 2010 in the Datong Coal Mine Group. We predicted that, among all these workers, 4,300 would develop CWP in the future if work-place dust concentrations remained at the levels of 2011. We predicted that 3,763 coal workers would develop CWP if advanced dustproof strategies were adopted, which equates to 537 Table 5. Indirect economic losses caused by patients with CWP.
Category Economic loss (RMB) Proportion of total indirect economic loss (%)
Social productivity loss caused by CWP patients 426,239,926.3 64.3
Cost of training new supplemental employees 2,224,780.0 0.3
Traffic fees for accompanying family members 23,962,927.4 3.6
Social productivity loss by accompanying family members 210,759,937.2 31.8
Total 663,187,570.9 100.0
fewer cases of CWP; losses of 1.207 billion RMB would be restored and 364 million RMB and 4,698.8 healthy life years would be gained. Further, dustproof strategies would benefit more than the people who first experienced dust exposure between 1970 and 2010; workers who started work in the mines after 2011 would also benefit. Including these newer workers in the analysis would more than double the 537 patients who would not develop CWP and greater economic effectiveness would be realized.
In our survey, direct economic loss exceeded indirect economic loss and accounted for 84.0% of total economic loss. This result was different from previous research in China [15], but it was similar to reports from other developed countries [20]. Our finding might be the result of increases in lump-sum grants for disability, lump-sum grants for death, and medical costs, which was a promotion for the prevention and treatment of pneumoconiosis.
Dust concentrations in the workplaces of the Datong Coal Mine Group have decreased sig-nificantly since the implementation of a series of dustproof measures, but the levels are still not controlled under the standards defined in“Occupational exposure limit (OEL) for hazardous agents”[8,41]. Dust is still the primary occupational hazard in the Datong Coal Mine Group, as well as other coal enterprises. If dust concentrations decrease, the incidence of CWP will decrease.
The implementation of advanced dustproof equipment, such as a high-pressure spray sys-tem with pneumatic power and an underground water purification syssys-tem, would require an investment of 843 million RMB, according to our analysis, but the dust concentrations would subsequently decline in the coal mines. For example, we expect the dust level to be reduced to 6.3 mg/m3in the tunneling area. At this level, if a worker was exposed to dust for 40 years, his CDE would be 252.8 mgyears. According to the results of our study, the risk probability of developing CWP of tunneling workers with a CDE of 200 mgyears was only 0.0064. The majority of workers would, therefore, be free from pneumoconiosis, and 1.207 billion RMB would be restored. We calculated the ratio of dustproof investments and restored economic losses to be 1:1.43 (843/1,207). Controlling workplace dust concentrations is critical to reduce the onset of pneumoconiosis and to achieve economic benefits.
It is important to recognize pneumoconiosis prevention as an economic activity [13]. In our investigation, we observed substantial economic losses and healthy life losses for CWP patients who were first exposed to dust between 1970 and 2010 in the Datong Coal Mine Group. Improving dust protection could bring considerable economic benefits to the coal mining industry owing to a reduced number of CWP cases. Dust also causes a variety of diseases of the respiratory system and it can increase the incidence rate of other chronic diseases [42,43]. If the economic losses caused by other diseases related to dust were considered, including physi-cal and mental pain to patients and their families, broken families, and social instability, the losses would total more than our original estimates. Such estimates would be a more powerful illustration of the importance of dust control and exposure prevention. If funds are invested early in dustproof equipment and strategies, great benefits will be realized owing to delayed effects of pneumoconiosis [44].
Supporting Information
S1 Fig. Dose-response relationship between cumulative incidence rate of CWP and cumula-tive dust exposure.
(TIF)
S1 File. Supplementary tables A-AA. Table A.The relationship between the disability grade of occupational disease and the stage of pneumoconiosis.Table B.Cumulative incidence rate of CWP in the tunneling cohort.Table C.Contents included in direct and indirect economic loss caused by CWP.Table D.The compensation standard of lump-sum grant of disability for pneumoconiosis.Table E.The compensation standard of disability allowance for pneumoconi-osis before retirement.Table F.The compensation standard of nursing cost for pneumoconio-sis.Table G.Cumulative incidence density of CWP for tunneling workers.Table H.Logit variable transformation and incidence density estimation for tunneling workers.Table I.The number of CWP prediction for tunneling workers in the future if dust concentration main-tained at the level of 2011.Table J.The number of CWP prediction for tunneling workers in the future if dust concentration maintained at the level of 2011.Table K.The number of CWP prediction for mining workers in the future if dust concentration maintained at the level of 2011.Table L.The number of CWP prediction for combining workers in the future if dust concentration maintained at the level of 2011.Table M.The number of CWP prediction for helping workers in the future if dust concentration maintained at the level of 2011.Table N. The number of CWP prediction for tunneling workers in the future if advanced dustproof measures was adopted.Table O.The number of CWP prediction for mining workers in the future if advanced dustproof measures was adopted.Table P.The number of CWP prediction for combining workers in the future if advanced dustproof measures was adopted.Table Q. The number of CWP prediction for helping workers in the future if advanced dustproof mea-sures was adopted.Table R.Medical costs attributed to CWP.Table S.Lump-sum grants for disability caused by CWP.Table T.Allowances for disability caused by CWP.Table U. Nurs-ing costs attributed to CWP.Table V.The age of onset distribution of CWP in each occupa-tional character.Table W.Years lived with disability (YLD) by CWP patients.Table X.Years of life lost (YLL) by CWP patients.Table Y.Disability adjusted life years (DALY) caused by CWP (year).Table Z.Economic losses attributed to decreased social productivity by patients with CWP.Table AA.Total economic loss caused by CWP (RMB)
(DOC)
S2 File. Supplementary raw anonymized dataset. (XLS)
Acknowledgments
Author Contributions
Conceived and designed the experiments: FS HL JC. Performed the experiments: FS BH YD HC XS ZS XY ZH. Analyzed the data: FS HL JY KC BH ZS XF SY XY ZH JC. Contributed reagents/materials/analysis tools: FS HL ZS XY ZH JC. Wrote the paper: FS HL BH JC.
References
1. Centers for Disease Control and Prevention (CDC), Department of Health and Human Services (HHS). Specifications for medical examinations of underground coal miners. Final rule. Fed Regist. 2012; 77 (178):56717–35. PMID:22973607
2. Petsonk EL, Rose C, Cohen R. Coal Mine Dust Lung Diseases: New Lessons from an Old Exposure. Am J Respir Crit Care Med. 2013; 187(11):1178–85. doi:10.1164/rccm.201301-0042CIPMID: 23590267
3. Lee WJ, Shin JH, Park SY. Relation of Pulmonary Function Impairment and Coronary Artery Calcifica-tion by Multi-detector Computed Tomography in Group Exposed to Inorganic Dusts. Tuberc Respir Dis (Seoul). 2013; 74(2):56–62. doi:10.4046/trd.2013.74.2.56PMID:23483677
4. Centers for Disease Control and Prevention (CDC). Pneumoconiosis and advanced occupational lung disease among surface coal miners—16 states, 2010–2011. MMWR Morb Mortal Wkly Rep. 2012; 61 (23):431–434. PMID:22695382
5. Scarisbrick DA, Quinlan RM Occupational respiratory disease in mining. Occup Med (Lond). 2005; 55 (1):72–73.
6. Attfield MD, Seixas NS. Prevalence of pneumoconiosis and its relationship to dust exposure in a cohort of U.S. bituminous coal miners and ex-miners. Am J Ind Med 1995; 27(1):137–151. PMID:7900731
7. Pingle S. Occupational safety and health in India: now and the future. Ind Health. 2012; 50(3): 167–
171. PMID:22790480
8. Chen W, Liu Y, Wang H, Hnizdo E, Sun Y, Su L, et al. Long-term exposure to silica dust and risk of total and cause-specific mortality in Chinese workers: a cohort study. PLoS Med. 2012; 9(4):e1001206. doi: 10.1371/journal.pmed.1001206PMID:22529751
9. Naidoo RN, Robins TG, Murray J. Respiratory outcomes among South African coal miners at autopsy. Am J Ind Med. 2005; 48(3): 217–224. PMID:16094611
10. Mo J, Wang L, Au W, Su M. Prevalence of coal workers' pneumoconiosis in China: A systematic analy-sis of 2001–2011 studies. Int J Hyg Environ Health. 2013; 26 (13):00044–8.
11. National Health and Family Planning Commission of the People's Republic of China. 2013 National reporting of occupational diseases. National Health and Family Planning Commission of the People's Republic of China website. Available:http://www.nhfpc.gov.cn/jkj/s5899t/201406/
ed8ed220d0b74010bcb6dcd8e340f4fb.shtml. Accessed 2014 Jul 6.
12. Oyunbileg S, Wang JD, Sumberzul N, Chang YY, Erdenchimeg E. Health impact of pneumoconiosis in Mongolia: estimation of losses in life expectancy and quality adjusted life expectancy. Am J Ind Med. 2011; 54(4):285–292. doi:10.1002/ajim.20930PMID:21268051
13. Lahiri S, Levenstein C, Nelson DI, Rosenberg BJ. The cost effectiveness of occupational health inter-ventions: prevention of silicosis. Am J Ind Med. 2005; 48(6):503–14. PMID:16299711
14. Leigh JP, Yasmeen S, Miller TR. Medical costs of fourteen occupational illnesses in the United States in 1999. Scand J Work Environ Health. 2003; 29(4): 304–313. PMID:12934724
15. Liang YX, Wong O, Fu H, Hu TX, Xue SZ. The economic burden of pneumoconiosis in China. Occup Environ Med. 2003; 60(6):383–4. PMID:12771388
16. Bhagia LJ, Sadhu HG. Cost-benefit analysis of installing dust control devices in the agate industry, Khambhat (Gujarat). Indian J Occup Environ Med. 2008; 12(3): 128–31. doi:10.4103/0019-5278. 44694PMID:20040971
17. Rydlewska-Liszkowska I. Health and safety economics: limitations of economic appraisal of occupa-tional health services activities in Poland. Int J Occup Med Environ Health. 2002; 15(2):193–197. PMID:12216778
18. Oxenburgh M, Marlow P. The productivity assessment tool: computer-based cost benefit analysis model for the economic assessment of occupational health and safety interventions in the workplace. J Safety Res. 2005; 36(3):209–214. PMID:16038939
20. Leigh JP, Robbins JA. Occupational Disease and Workers’Compensation: Coverage, Cost, and Con-sequences. The Milbank Quarterly. 2004; 82(4):689–721. PMID:15595947
21. Bertram MY, Katzenellenbogen J, Vos T, Bradshaw D, Hofman KJ. The disability adjusted life years due to stroke in South Africa in 2008. Int J Stroke. 2013; Suppl 100: :76–80. doi:10.1111/j.1747-4949. 2012.00955.xPMID:23295022
22. Barnum H. Evaluating healthy days of life gained from health projects. So c Sci Med. 1987; 24(10): 833–841. PMID:3112960
23. Lou J, Zhou C. The preventive of silicosis and prediction of its future prevalence in China. American Journal of Public Health. 1989; 79(12):1613–1616. PMID:2817188
24. Datong Coal Mine Group. Introduction of Datong Coal Mine Group. Datong Coal Mine Group website. Available:http://www.dtcoalmine.com/. Accessed 2013 Nov 30.
25. National Health and Family Planning Commission of the People's Republic of China. Diagnostic criteria of pneumoconiosis. Occupational health standard of the people's Republic of China, GBZ 70–2009. 26. International labour organization (ILO). Guidelines for the use of the ILO international classification of
radiographs of pneumoconioses.http://www.ilo.org/global/publications/ilo-bookstore/order-online/ books/WCMS_168337/lang—en/index.htm. Accessed 2015 Mar 30.
27. General Administration of Quality Supervision, Inspection and Quarantine of the People's Republic of China. Standard for identify work ability. Gradation of disability caused by work-related injuries and occupational diseases. GB/T 16180–2006.
28. Liu H, Tang Z, Weng D, Yang Y, Tian L, Duan Z, et al. Prevalence Characteristics and Prediction of Coal Workers’Pneumoconiosis in the Tiefa Colliery in China. Industrial Health. 2009; 47(4): 369–375. PMID:19672010
29. Liu H, Tang Z, Yang Y, Weng D, Sun G, Duan Z, et al. Identification and classification of high risk groups for Coal Workers' Pneumoconiosis using an artificial neural network based on occupational his-tories: a retrospective cohort study. BMC Public Health. 2009; 29(9):366.
30. National Health and Family Planning Commission of the People's Republic of China. Determination of dust in the air of workplace, Part 1, total dust concentration. GBZ/T 192.1–2007.
31. National Health and Family Planning Commission of the People's Republic of China. Determination of dust in the air of workplace, Part 2, respiratory dust concentration. GBZ/T 192.2–2007.
32. Soutar CA, Hurley JF, Miller BG, Cowie HA, Buchanan D. Dust concentrations and respiratory risks in coal miners: key risk estimates from the British Pneumoconiosis Field Research. Occup Environ Med. 2004; 61(6):477–481. PMID:15150385
33. Adio AO, Onua AA. Economic burden of glaucoma in Rivers State, Nigeria. Clin Ophthalmol. 2012; 6: 2023–31. doi:10.2147/OPTH.S37145PMID:23271881
34. Murray CJL. Rethinking DALY Global burden of disease and injury series Vol. 1. The global burden of disease. Cambridge:Harvard University Press. 1996.
35. Ren XW, Wang MD, Kang HZ, Lu XX. A new method for reducing the prevalence of pneumoconiosis among coal miners: foam technology for dust control. J Occup Environ Hyg. 2012; 9(4):D77–83. doi: 10.1080/15459624.2012.667288PMID:22482836
36. National Bureau of statistics of China. Gross domestic product. China Statistical Yearbook in 2012. National Bureau of statistics of China website. Available:http://www.stats.gov.cn/tjsj/ndsj/2012/ indexch.htm. Accessed 2013 Nov 30.
37. Department of human resources and social security of Shanxi Province. Inform on the standard of com-pensation adjustment for illness or non work related death. 2006.
38. Wooding J, Levenstein C. The point of production. NY: Guilford Press. 1999.
39. The Central People’s Government of the people's Republic of China. Regulations of the People's Republic of China on the prevention and control of pneumoconiosis. Order of the State Council of the people's Republic of China No. 105. 1987.
40. The National People’s Congress of the People’s Republic of China. Law of the People’s Republic of China on Prevention and Control of Occupational Diseases. Decision of the Standing Committee of the National People's Congress on the revision. The people's Republic of China President Decree No.52. 2011.
41. National Health and Family Planning Commission of the People's Republic of China. Workplace harm-ful factors of occupation contact limiting value of first parts: chemical hazards. GBZ2.1–2007. 42. Sun Y, Bochmann F, Morfeld P, Ulm K, Liu Y, et al. Change of exposure response over time and
43. Rohr P, da Silva J, da Silva FR, Sarmento M, Porto C, Debastiani R, et al. Evaluation of genetic damage in open-cast coal mine workers using the buccal micronucleus cytome assay. Environ Mol Mutagen. 2013; 54(1):65–71. doi:10.1002/em.21744PMID:23055270