RBCCV 44205-1463 DOI: 10.5935/1678-9741.20130034
Prevenção cardiovascular abrangente em pacientes com doença arterial coronária: implementação das
diretrizes na prática clínica
Cardiovascular prevention in coronary heart
disease patients: guidelines implementation in
clinical practice
Clarisse Kaoru Ogawa Indio do Brasil
1, Álvaro Avezum Junior
2, Luciana Uint
3, Maria Isabel Del
Monaco
3, Valéria Mozetic de Barros
3, Soraia Youssef Rachid Campos
3, Amanda M. R. Sousa
41. Head of the Medical Unit of Coronary Diseases at Dante Pazzanese Institute of Cardiology, São Paulo, SP, Brazil.
2. Director of the Research Division at Dante Pazzanese Institute of Cardiology, São Paulo, SP, Brazil.
3. Assistant Physician of the Medical Unit of Coronary Diseases at Dante Pazzanese Institute of Cardiology, São Paulo, SP, Brazil.
4. General Director at Dante Pazzanese Institute of Cardiology, São Paulo, SP, Brazil.
This study was carried out at at Dante Pazzanese Institute of Cardiology, São Paulo, SP, Brazil.
Correspondence address:
Clarisse Kaoru Ogawa Indio do Brasil Instituto Dante Pazzanese de Cardiologia
Av. Dr. Dante Pazzanese, 500 – Prédio dos Ambulatórios I – Seção Médica de Coronariopatias – Vila Mariana – São Paulo, SP, Brazil – Zip code: 04012-909 E-mail: [email protected]
Article received on April 22th, 2013 Article accepted on May 15th, 2013 Abstract
Objective: To demonstrate the utilization of a clinical improvement program in stable coronary artery disease patients to increase the evidence-proven treatment utilization, and to describe the ongoing clinical practice and lifestyle change counseling.
Methods: Cross-sectional study followed by a longitudinal component in which the tools utilization to improve clinical practice was assessed by means of additional cross-sectional data collection. 710 consecutive patients were included (Phase 1). After tools implementation, within 6 months period, 705 patients were included (Phase 2) for comparative analysis. Randomly, 318
patients from Phase 1 were selected, 6-12 months after the irst
evaluation (Phase 3).
Results: Phase 1 to Phase 2: there were improvement on smoking cessation (P=0.019), dyslipidemia (P<0.001), hypertension and physical activity (P<0.001). There was
signiicant difference on angiotensin converting enzyme inhibitors
– ACEI (67.2% vs. 56.8%, P<0.001); angiotensin II receptor blockers – ARB II (25.4% vs. 32.9%, P=0.002) and beta-blocker (88.7% vs. 91.9%, P=0.047). Phase 1 to Phase 3: there was both weight (P=0.044), and blood pressure reduction (P<0.001). There
was statistical signiicant difference on ACEI (64.8% vs. 61.6%,
P=0.011) and ARB II (27.0% vs. 31.3%, P=0.035).
Conclusion: There was no signiicant change on the evidence-based pharmacological treatment utilization between pre and
post-intervention phases; there was signiicant improvement
concerning smoking and physical activity in phase 2; substantial improvement on blood pressure levels in both comparisons (Phase 1 to 2 and Phase 1 to 3). The inclusion of a case-manager
for the process management was crucial for program eficacy.
Comprehensive programs for clinical practice should be pursued for longer follow-up period.
Resumo
Objetivo: Demonstrar a eficácia de um programa de otimização da prática clínica em pacientes com doença arterial coronária para prescrição de medicamentos e documentar a prática clínica vigente quanto aos medicamentos e medidas para a mudança do estilo de vida.
Métodos: Estudo de corte transversal, seguido de componente longitudinal. Foram incluídos 710 pacientes consecutivos (Fase 1).
Após aplicação de ferramentas para melhoria da prática clínica, foram incluídos, após seis meses, 705 pacientes com coleta dos mesmos dados (Fase 2). Foram selecionados aleatoriamente, a partir do primeiro grupo, 318 prontuários para comparação desses mesmos pacientes (Fase 3).
Resultados: Comparação entre as Fases 1 e 2: melhora em relação a tabagismo (P=0,019), dislipidemia (P<0,001), hipertensão arterial e atividade física regular (P<0,001).
Diferença signiicativa para inibidores da enzima de conversão da
angiotensina – IECA (67,2% vs. 56,8%, P<0,001); antagonistas do receptor da angiotensina II – ARA II (25,4% vs. 32,9%, P=0,002) e betabloqueador (88,7% vs. 91,9%, P=0,047). Comparação entre as Fases 1 e 3: houve redução do peso (P=0,044) e pressão arterial (P<0,001). Em relação à prescrição de medicamentos recomendados, diferença para IECA (64,8% vs. 61,6%, P=0,011) e ARA II (27,0% vs. 31,3%, P=0,035).
Conclusão: Não houve mudança signiicativa na utilização
de medicamentos; entretanto, observou-se melhora signiicativa
em relação ao tabagismo e atividade física na Fase 2; melhora substancial nos níveis de pressão arterial, na comparação tanto entre as Fases 1 e 2 como entre as Fases 1 e 3. A inclusão de enfermeiro treinado para gerenciar o processo foi fundamental. Programas abrangentes de melhoria de qualidade assistencial, provavelmente, devem ser continuados por período de seguimento maior.
Descritores: Doença das coronárias. Prevenção secundária. Fatores de risco. Guias como assunto.
Abbreviations, acronyms and symbols
INTRODUCTION
Despite guidelines recommendations on chronic coronary
artery disease (CAD) and available scientiic evidence to
show that the optimal pharmacological treatment, in addition to vigorous intervention on risk factors and lifestyle has
beneits in relation to reducing nonfatal cardiovascular
events and mortality [1-4], there is a substantial gap between
knowledge (availability of data and scientiic evidence) and its application in clinical practice, which needs to be illed,
due to the secondary prevention therapy is underutilized in clinical practice in patients with CAD.
This fact occurs worldwide, as demonstrated by studies EUROpean Action on Secondary Prevention through Intervention to Reduce Events (EUROASPIRE) I, II and III, which revealed that the prevention of cardiovascular disease in clinical practice is inadequate in European countries [5]. These studies concluded that there is need for more effective management regarding the prescription of drugs with proven
eficacy and lifestyle modiication, with control of risk
factors in patients with CAD [5].
Similarly, the study Prospective Urban Rural
Epidemiological (PURE) aimed to assess the use of drugs recommended by the guidelines: antiplatelet agents, statins, angiotensin-converting enzyme inhibitors (ACEI) or antagonists of the angiotensin II receptor (ARB) and beta-blockers in patients with CAD or stroke in high, middle and low income countries, [6]. This study demonstrated that the use of these drugs was far from desirable, even in developed countries [6].
In an attempt to try to reduce the gap between scientiic
knowledge and the application of it in clinical practice, there were programs that consist of implementing tools and strategies to improve appropriate prescribing of these medications and compliance with them, in order to achieve the aims in relation to the control of risk factors and lifestyle
modiication.
The Cardiac Hospitalization Atherosclerosis Management Program (CHAMP) assessed patients hospitalized for acute myocardial infarction, unstable angina, cardiac catheterization, for procedures such as coronary artery bypass grafting or percutaneous coronary intervention and ischemic heart failure [7]. The program demonstrated that treatment for secondary prevention, started early, brought
ASA ARA II CHAMP
COURAGE
CAD
EUROASPIRE
HDL ACE BMI LDL DBP SBP PURE SPSS STABILITY
acetylsalicylic acid
Angiotensin receptor antagonism II
Cardiac Hospitalization Atherosclerosis Management Program
Outcomes Utilizing Revascularization and Aggressive Drug Evaluation
Coronary Artery Disease
European Action on Secondary Prevention through Intervention to Reduce Events
High-density lipoprotein
inhibitors Angiotensin converting enzyme Body Mass Index
Low-density lipoprotein Diastolic Blood Pressure systolic blood pressure
Prospective Urban Rural Epidemiological Statistical Package for the Social Sciences
improvement in the prescription of drugs and compliance
with them, which resulted in signiicant reduction of events
in one year after discharge [7].
The study Clinical Outcomes Utilizing Revascularization and Aggressive Drug Evaluation (COURAGE), in addition to compare optimal medical therapy alone with optimal medical treatment associated with percutaneous coronary intervention in patients with stable CAD, it included all patients in
a program of lifestyle modiication life administered by
trained nurses to manage processes (“case manager”) and
demonstrated signiicant changes in behavior, improving the
parameters dependent of change of lifestyle and medication adherence, as well as control of risk factors [8].
Although these studies cited in the international literature, there is lack of information related to this issue, especially in tertiary care hospitals specialize in cardiology in the country.
METHODS
We included patients of both genders, CAD patients with proven coronary angiography showing at least one epicardial
coronary artery lesions with ≥ 50%, clinically stable, with
or without previous myocardial infarction, pharmacological treatment alone or who underwent revascularization
procedures. Patients were identiied through the review of
medical records of patients seen consecutively in the Medical Section of Coronary Artery Disease, and collected data regarding demographic and anthropometric characteristics, clinical features, risk factors, laboratory tests and treatment used in routine clinical practice.
After this initial collection, the tools used for optimization of clinical practice were:
a) meeting with physicians and health sector, reinforcing the importance of prescription drugs and non-pharmacological measures recommended by guidelines;
b) monthly meeting with residents, instructing and guiding for recommendations;
c) printed posters set in all ofices on the drugs
recommended for all patients with stable CAD, with their doses and the aims to be achieved regarding the levels of low density lipoprotein (LDL)-cholesterol, systolic (SBP) and diastolic blood pressure (DBP) and the levels of fasting glucose and glycated hemoglobin levels in diabetic patients;
d) process manager (“case manager”) to assess the prescription of therapies recommended by spreadsheets
distributed daily in the ofices to be illed by physicians;
e) guidance to physicians about the need to inform patients about the CAD, which and what are the risk factors and their importance in disease development and progression, how to
control them and the beneits of this control;
f) multidisciplinary team consisting of physician responsible for the anti-smoking group, a physical education teacher, dietician and psychologist available for individual
interviews and speciic guidance in each area, as needed;
g) delivery of booklets with the guidelines of the multidisciplinary team.
Patients included
Phase 1: pre-intervention: consisting of 710 patients who had their medical records assessed for collection of the described data.
Phase 2: post-intervention: consists of 705 consecutive patients who were seen in the section, with the same information collected in phase 1.
Phase 3: consisting of 318 patients selected from the initial sample (Phase 1), randomly, whose medical records were assessed for new data collection, after six to twelvemonths.
Analysis plan
a) comparison between the data of Phases 1 and 2 (pre- and post-intervention);
b) comparing the data from Phases 1 and 3, with the aim of comparing the same patients between them.
The study design involved cross-section, followed by longitudinal component. The minimum sample size calculation was performed proposing that it would be considered a proper difference of the use of acetylsalicylic acid
(ASA) between the two samples, increased from 90% to 95% and the probability of type 1 error α = 95% and power of Test 1-β=0.90, resulting in 620 patients for each of the samples.
Numerical variables were described by their minimum and maximum values, averages, standard deviations and medians and categorical variables were described by absolute and
relative frequencies (%). Inferential analysis was performed
taking into account the characteristics of the study:
Phases 1 and 2
For numeric variables, we used the nonparametric Mann-Whitney test for comparison of independent groups, and for categorical variables, the chi-square test.
Phases 1 and 3
For numeric variables, we used the nonparametric Wilcoxon test for comparing dependent groups for categorical variables, and the nonparametric McNemar test for comparison of proportion before and after.
The level of signiicance for the tests was 5% (alpha=0.05)
and statistical packages used were SPSS for Windows, version 19.0 (SPSS Inc. Chicago, Illinois) and R software (version 2.15.2).
RESULTS
Comparative results between patients in Phases 1 and 2
The demographic characteristics
two groups. Regarding clinical characteristics, there was a
statistically signiicant difference with respect to stable angina
(P<0.001), CABG (P=0.001) and renal failure (P=0.018),
more prevalent in Stage 2, and in relation with heart failure (P=0.003) and asymptomatic ventricular dysfunction (P
<0.001) more prevalent in Step 1 (Table 1)
Regarding associated risk factors
Smoking, diabetes, dyslipidemia, LDL >100 mg/dl and/ or high-density lipoprotein (HDL) <40 mg/dl (men) and HDL <45 mg/dl (women), hypertension (BP > 140/90 mmHg) , hypertriglyceridemia (TG>150 mg/dl) and physical activity,
there was signiicant difference compared to nonsmokers
(P=0.019) and information about smoking more prevalent
in Stage 2 (P<0.001), a lower proportion of dyslipidemia (P<0.001), a lower proportion of hypertensive patients (P<0.001) and an increase in the proportion of regular physical activity (P<0.001) in Phase 2 (Table 2).
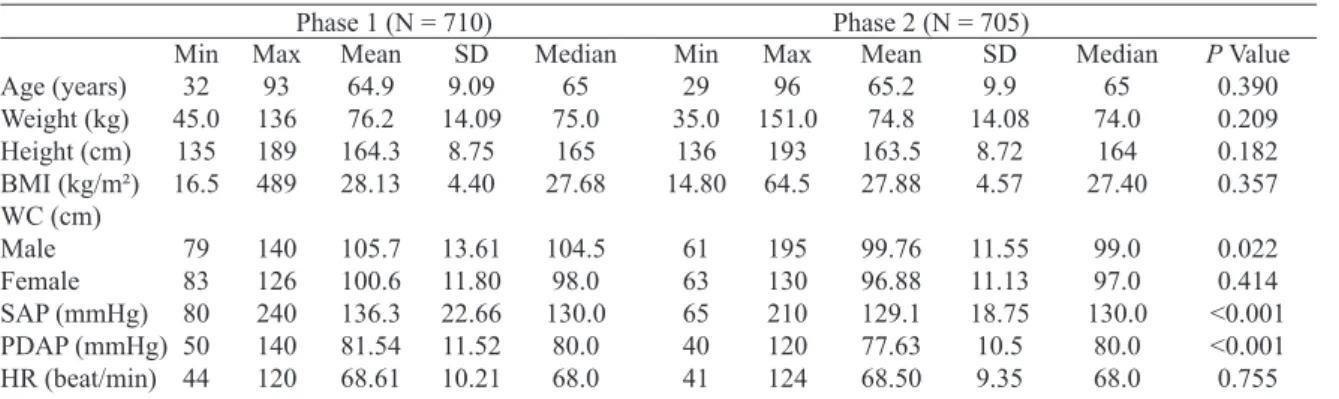
Regarding anthropometric data
For weight, height, body mass index (BMI), waist circumference, SBP and DBP and heart rate, the minimum,
maximum, average, standard deviation and median signiicant
difference were calculated regarding the improvement for abdominal circumference between men (P=0.022), SBP
(P<0.001) and DBP (P<0.001) in Phase 2 (Table 3). A
signiicant increase in the number of collected information comparing the two phases, demonstrating the eficiency of
program service quality with respect to the collection of important data for clinical practice: information on weight
were available in 56.5% vs. 93.8% of the time vs. 56%. 94%, on BMI, 55.6% vs. 93% and the abdominal circumference, 5.6% vs. 71.6% respectively for Phases 1 and 2 (P<0.001). As to laboratory, total cholesterol, LDL-cholesterol, HDL-cholesterol, triglycerides, fasting glucose and glycated hemoglobin, the minimum, maximum, average, standard
deviation and median were calculated. For these variables
there was no signiicant difference between the two groups
(Table 4).
In addition, we calculated the proportion of patients with laboratory tests within the targets and the results were: LDL
<70 mg/dl: 31.6% vs. 34.8% (P=0.198), HDL> 40 mg> dL (men): 41.0% vs. 37.0% (P=0.118) HDL>45 mg/dl (women) vs 19%. 19% (P=0.784), triglycerides <150 mg/dl 67% vs. 68% (P=0.847) and among diabetics, fasting glucose <100 mg/dl: 15.4% vs. 19.1% (P=0.235), and HbA1c <7.0%: 46% vs. 40.3% (P=0.167).
Comparing the prescription of drugs recommended by the guidelines between the pre- and post-intervention, the
results showed signiicant differences, with lower use of ACE
inhibitors (P<0.001) and greater use of ARBs (P=0.002) and
beta blockers (P=0.047) (Table 5). Assessing the number of
patients of whom ACE inhibitor or ARB were prescribed,
the results were: 657 (92.5%) in Phase 1 and 627 (89.0%) in
Phase 2 (P=0.025).
Comparative results between patients in Phases 1 and 3
Whereas patients in Phase 3 are a subset of patients
randomly selected from the irst group (Phase 1), the
demographic data are similar. Likewise, information about the clinical characteristics were similar, but there was a
signiicant difference only for peripheral arterial disease: 31 (9.7%) patients and 42 (13.3%) between Stages 1 and 3,
respectively (P=0.007).
Regarding risk factors, we considered only modiiable
risks: smoking and physical activity. For both smoking and
physical activity, the results showed no signiicant differences
between the two phases.
Regarding anthropometric measurements, there was
signiicant differences for weight, with increase from Phase
1 to 3 (P=0.044) and reductions in SBP and DBP from Phase
1 to 3 (P<0.001) (Table 6).
Table 1. Clinical characteristics
Stable angina Myocardial infarction Surgical MR Percutaneous MR Heart failure
Asymptomatic ventricular dysfunction (EF <50%)
TIA / stroke PAD
CRF (Cr > 2.0mg/dl) Chronic AF
N 160 451 373 142 129 175 38 66 29 7
%
22.5 63.5 52.5 20.0 18.2 24.6 5.4 9.3 4.1 1.0
Phase 1 (N = 710)
N 222 423 438 131 88 98 43 68 49 13
%
31.5 60.1 62.2 18.6 12.5 13.9 6.1 9.7 7.0 1.8
Phase 2 (N = 705)
P Value < 0.001 0.195 0.001 0.524 0.003 < 0.001
0.532 0.789 0.018 0.168
Table 3. Anthropometric measurements. Age (years) Weight (kg) Height (cm) BMI (kg/m²) WC (cm) Male Female SAP (mmHg) PDAP (mmHg) HR (beat/min) Min 32 45.0 135 16.5 79 83 80 50 44 Max 93 136 189 489 140 126 240 140 120
Phase 1 (N = 710)
Mean 64.9 76.2 164.3 28.13 105.7 100.6 136.3 81.54 68.61 SD 9.09 14.09 8.75 4.40 13.61 11.80 22.66 11.52 10.21
Phase 2 (N = 705)
kg = kilogram, cm = cm, BMI = body mass index, m2 = meters squared, WC = waist circumference, SBP = systolic blood pressure, DBP = diastolic blood pressure, HR = heart rate, mmHg = millimeters of mercury, beat/min = beats per minute, Min = minimum, Max = maximum, SD = standard deviation
Median 65 75.0 165 27.68 104.5 98.0 130.0 80.0 68.0 Min 29 35.0 136 14.80 61 63 65 40 41 Max 96 151.0 193 64.5 195 130 210 120 124 Mean 65.2 74.8 163.5 27.88 99.76 96.88 129.1 77.63 68.50 SD 9.9 14.08 8.72 4.57 11.55 11.13 18.75 10.5 9.35 Median 65 74.0 164 27.40 99.0 97.0 130.0 80.0 68.0
P Value 0.390 0.209 0.182 0.357 0.022 0.414 <0.001 <0.001 0.755 Table 2. Associated risk factors.
Smoking Never Ex-smoker Current No information
Diabetes (FPG > 126 mg/dl) Dyslipidemia
LDL > 100 mg/dl HDL < (male) 40 mg/dl LDL >100 mg/dl HDL < (fem) 45 mg/dl Arterial Hypertension (AP > 140/90 mmHg) Hypertriglyceridemia (TG > 150 mg/dl) Physical activity Regular Sedentary No information N 122 388 65 135 302 686/710 473/487 213/223 679 260 19 103 588 % 17.2 54.6 9.2 19.0 42.5 96.6 97.1 95.5 95.6 36.6 2.7 14.5 82.8
Phase 1 (N = 710)
N 175 409 60 61 305 543/705 376/495 165/205 613 237 157 311 232 % 25.0 58.0 8.5 8.5 43.3 77.7 76.6 78.6 87.2 33.6 22.4 44.4 33.1
Phase 2 (N = 705)
P Value
0.019 0.134 0.289 < 0.001 0.729 < 0.001 < 0.001 0.253 < 0.001 < 0.001
FPG = fasting plasma glucose, LDL = low density lipoprotein, HDL = high density lipoprotein, BP = blood pressure, TG = triglycerides
Table 4. Laboratory exams
Total Cholesterol (mg/dl) LDL (mg/dl)
HDL (mg/dl) Man Women
Triglycerides (mg/dl) Blood glucose (mg/dl)
Hb A1c (%)
Min 79 23 24 20 34 50 4.8
Phase 1 (N = 710)
Max 469 255 77 113 1111 497 15.9 Mean 162.95 87.77 43.68 50.60 144.77 117.87 6.9
Phase 2 (N = 705)
LDL = low-density lipoprotein, HDL = high-density lipoprotein, mg/dl = milligrams per deciliter, HbA1c = hemoglobin, A1c, Min = min, Max = maximum, SD = standard deviation
SD 45.17 34.41 9.74 13.83 100.3 44.56 1.59 Median 155.00 81.00 43.00 50.00 120.00 106.00 6.4 Min 64 23 27 31 36 51 4.7 Max 311 217 96 96 800 316 15.0 Mean 157.78 84.80 43.95 50.31 138.77 114.71 6.84 SD 38.51 30.15 11.10 11.64 81.67 38.08 1.57 Median 152.00 81.00 42.00 48.00 120.00 103.00 6.3
Regarding laboratory tests, the results showed no
signiicant difference (Table 7).
When comparing the proportion of patients in Phases 1 and 3 who had laboratory tests within the targets, the results
were: LDL <70 mg/dl: 34.6% and 37.3% (P=0.509), HDL> 40 mg/dl (men): 54.3% and 58.8% (P=0.073), HDL> 45 mg/
dl (women): 62.2% and 60.2% (P=0.630), fasting glucose < 100 mg/dl: 13.6% and 21.2% (P=0.136), and HbA1c <7.0%: 47.4% and 51.3% (P=1.00), respectively. Comparing
the prescription of recommended medications, there was
a signiicant difference for lower use of ACE inhibitors
(P=0.011) and increased use of ARBs (P=0.035) - Table 8. Table 5. Recommended medications.
Antiplatelet AAS Clopidogrel Ticlopidine Statins Simvastatin Atorvastatin Rosuvastatin Ezetimibe ACEI Enalapril Captopril Ramipril ARA II Losartan Candesartan Beta-blocker Propranolol Atenolol Carvedilol Metoprolol N 684 676 14 5 699 599 93 6 212 477 403 66 6 180 177 1 630 8 339 240 44 % 96.3 95.2 2.0 0.7 98.5 85.7 13.3 0.9 29.6 67.2 84.5 13.8 1.3 25.4 98.3 0.6 88.7 1.3 53.8 38.1 6.9
Phase 1 (N = 710)
N 676 668 17 4 686 465 219 2 65 398 363 32 2 229 221 0 644 4 371 223 47 % 96.4 94.8 2.5 0.6 97.7 67.8 31.9 0.3 9.2 56.8 91.2 8.0 0.5 32.9 96.5 0 91.9 0.62 57.6 34.6 7.3
Phase 2 (N = 705) P Value
0.923 0.846 0.572 0.716 0.317 < 0.001 < 0.001 0.288 < 0.001 < 0.001 0.047 < 0.001 0.159 0.002 0.070 1.000 0.047 0.953 0.067 0.384 0.719
ASA = acetylsalicylic acid, ACE inhibitors = Angiotensin converting enzyme, ARA II = antagonist receptor angiotensin II
Table 6. Anthropometric measurements.
Weight (kg) BMI (kg/m2) WC (cm2) SAP (mmHg) DAP (mmHg) HR (bat/min) Phase 1 3 1 3 1 3 1 3 1 3 1 3 N 73 73 66 66 6 6 305 305 304 304 280 280 Min 460 460 17.85 17.30 83.0 84.0 90.0 80.0 60.0 40.0 48.0 50.0 Mean 76.37 77.37 27.76 28.15 101.0 103.1 136.76 131.93 81.49 78.06 67.93 69.05
kg = kilogram, BMI = body mass index; m2 = meters squared, cm = centimeter, WC= waist circumference, SBP = systolic blood pressure, DBP = diastolic blood pressure, mmHg = millimeters of mercury, HR = heart rate; beat/ min = beats per minute, Min = minimum, Max = maximum, SD = standard deviation
SD 16.56 16.62 4.64 4.55 11.82 11.27 23.20 20.54 12.11 11.05 9.79 11.64 Median 74.0 74.0 27.68 28.15 102.0 106.0 130.0 130.0 80.0 80.0 67.0 68.0
Table 7. Laboratory tests.
Total cholesterol (mg/dl)
LDL (mg/dl) HDL (mg/dl) Men HDL (mg/dl) Women TG (mg/dl) FG (mg/dl) HbA1C (%) Phase 1 3 1 3 1 3 1 3 1 3 1 3 1 3 N 274 274 276 276 195 195 82 82 276 276 280 280 147 147 Min 93.0 82.0 34.0 30.5 24.0 27.0 29.0 31.0 34.0 35.0 63.0 63.0 4.8 5.0 Max 398.0 323.0 255.0 194.0 77.0 96.0 113.0 96.0 1111.0 827.0 339.0 314.0 12.5 12.8
mg/dL = milligrams per deciliter, LDL = low density lipoprotein, HDL = high density lipoprotein, TG = triglycerides, FG = fasting glucose, HbA1c = hemoglobin H1c, Min = minimum, Max = maximum, SD = standard deviation
Mean 158.98 157.15 84.41 82.62 44.01 44.02 51.96 50.24 146.12 146.76 115.66 115.99 6.69 6.79 SD 43.74 39.92 34.83 30.47 9.66 11.14 14.11 11.69 99.38 95.81 31.36 39.23 1.39 1.50 Median 150.0 151.0 81.5 80.9 43.0 42.0 50.5 48.0 120.5 125.5 106.50 104.00 6.3 6.3
P Value 0.762 0.762 0.453 0.276 0.387 0.956 0.312
Table 8. Recommended medications
Antiplatelet AAS Clopidogrel Ticlopidine Statin Simvastatin Atorvastatin Rosuvastatin Ezetimibe ACEI Enalapril Captopril Ramipril ARA II Losartan Candesartan Beta-blocker Propanolol Atenolol Carvedilol Metoprolol N 308 304 7 2 314 272 39 2 85 206 178 26 2 86 86 0 285 4 156 103 22 % 96.9 98.7 2.3 0.6 99.7 85.5 12.3 0.6 26.7 64.8 56.0 8.2 0.6 27 27 0.0 89.6 1.4 54.7 36.14 7.7 Phase 1 N 309 307 3 1 315 236 76 3 16 191 180 10 1 99 97 1 286 3 155 111 17 % 97.2 99.36 0.97 0.37 99.1 74.2 23.9 0.9 5.2 61.6 56.6 3.1 0.3 31.3 30.5 0.3 89.9 0.9 54.2 38.1 5.9
Phase 3 P Value
1.000 0.453 0.289 1.000 1.000 < 0.001 < 0.001 1.000 0.011 0.011 0.878 < 0.001 1.000 0.035 0.080 1.000 1.000 1.000 1.000 0.229 0.186
ASA = acetylsalicylic acid; ACE inhibitors = Angiotensin converting enzyme; ARA II = antagonist receptor angiotensin II
DISCUSSION
Results of Phases 1 and 2
The demographic characteristics, gender, age and ethnicity, were comparable. Regarding clinical characteristics, there
was signiicant differences related to the higher proportion
of stable angina (P<0.001), CABG (P=0.001) and in relation
to the lower proportion of heart failure (P=0.003) and
asymptomatic ventricular dysfunction (P<0.001). Comparing the risk factors, we found the proportion of dyslipidemia and
hypertension signiicantly lower (P<0.001 for both variables) in Phase 2. There was improvement in regard to smoking, as the category of never-smokers. For regular physical activity,
there was a signiicant improvement in Phase 2, from 2.7% to 22.4% (P<0.001), but the proportion of patients with missing information on this variable was very high in Phase 1: 82.8
% vs. Phase 2 33.1% (P<0.001).
Regarding anthropometric measurements between the
two populations, the study showed signiicant improvement
compared to waist circumference in men (P=0.022), SBP
physical activity after intervention. With respect to weight, BMI and waist circumference among women, there was a reduction in numbers, but without reaching statistical
signiicance. We note that there was a signiicant increase in
the number of information collected in Phase 2: for the weight
from 56.5% to 93.8%, for height from 56% to 94%, for BMI from 55.6% to 93.9% and for waist circumference from 5.6% to 71.6%, all P<0.001, demonstrating the effectiveness of the intervention for improving quality of care. The comparison
of laboratory tests showed a signiicant difference for the
variable HDL-cholesterol in men (P=0.049). As for total
cholesterol, LDL-cholesterol, triglycerides, fasting glucose and HbA1c, we found numerical reduction, but without
reaching statistical signiicance. Again, this inding may relect lack of statistical power to detect difference. The
substudy of the COURAGE trial that assessed intensive multifactorial intervention for patients with stable CAD assessing medication adherence and the parameters resulting
from the modiication of lifestyle through program managed by trained nurses (“case manager”) showed: signiicant reduction of smoking from 23% to 19% (P<0.025), increased
physical activity of 58% to 66% (P<0.001), reduced SBP (P<0.001), LDL-cholesterol (P<0.0014) , increasing HDL-cholesterol (P<0.001) and triglycerides (P<0.001).
Among diabetic patients, glycated hemoglobin remained unchanged (P=1.0). The BMI increased after 5 years
(P<0.001). Comparing the results of this clinical study with the present project, we found some similarities and differences.
Regarding the blood pressure, there was signiicant decrease in both. With respect to smoking, there was signiicant
reduction in the COURAGE trial and in the present study,
signiicant reduction of never-smokers. A signiicant
increase of patients who practiced regular physical activity in COURAGE, as in this study. As for LDL-cholesterol,
there was a signiicant reduction in COURAGE, and in
this study, only numerical reduction, but without statistical
signiicance. We note that the average LDL-cholesterol
pre-randomization was higher in COURAGE: 101 ± 0.83 mg/dl, compared to the average of the present study, even before the intervention: 87.77 ± 34.41 mg/dl, possibly due to the higher level of prescribing in our service, because it is a tertiary and academic hospital. The BMI in the present study showed
numerical reduction, but without statistical signiicance, while there was signiicant increase in COURAGE. The glycated
hemoglobin in diabetic patients remained unchanged in both studies. Additionally, in the present study, we calculated the proportion of patients with laboratory tests within the recommended targets in Phases 1 and 3: LDL <70 mg/dl:
31.6% vs. 34.8% (P=0.198), HDL> 40 mg/dl (men) and > 45 mg/dl (women): 41% vs. 37% (P=0.118) and 19% vs. 19%
(P=0.784), respectively; triglycerides <150 mg/dl 67% vs. 68.0% (P=0.847) and among diabetics, fasting glucose <100 mg/dl: 15.4% vs. 19.1% (P=0.235) and glycated hemoglobin
<7%: 46% vs. 40.3% (P=0.167). Except triglyceride levels, all other parameters showed ratios below 50% within the
targets. We can, in an exploratory way, interpret the absence of differences in these parameters after implementation of the intervention program, as a result of the lack of statistical power to detect differences that may exist, short observation period so that the improvement could be demonstrated and
inally the lack of eficacy the tools used in the program.
Comparing the prescription of recommended medications,
the results of this study showed antiplatelet: 96.3% vs. 96.4% (P=0.923), statins: 98.5% vs. 97.7% (P=0.317) and statistically signiicant lower use of ACE inhibitors: 67.2% vs. 56.8% (P <0.001) and greater use of ARBs: 25.4% vs. 32.9% (P=0.002) and beta-blockers: 88.7% to 91.9%
(P=0.047). The use of medication deemed appropriate in the COURAGE trial after ive years was higher as antiplatelet agents: from 87% to 96%, statins: 64% to 93%, ACEI or ARB: 46% to 72% and beta-blockers: 69 % to 85% (P
<0.001). In the present study, the proportion of patients on ACE inhibitors or ARBs, set amidst Phases 1 and 2 was:
92.5% and 89%, respectively (P=0.025). The reduction in the
use of this class of drugs may be in fact higher proportion of patients with chronic renal failure in Phase 2.
The CHAMP program assessed patients with the characteristics already discussed and demonstrated that preventive treatment initiated early, during admission and before discharge, substantially improved the prescription of drugs and adherence to the same of those which resulted in
signiicant reduction of events one year after discharged in
relation to recurrent myocardial infarction, hospitalization and cardiac and total mortality (P <0.05 for all events). This program also showed that medication adherence was
maintained during the period of six years, 68%, 92%, 91% and 94% for aspirin, 12%, 68%, 72% for beta-blockers in 78%, 4%, 52 %, 64% and 70% for ACEI and 6%, 88%, 89% and 90% for statins in periods respectively the 1992/1993
1994/1995, 1996/1997 and 1998/1999.
Comparing the present study regarding the use of medicines, this study showed similar proportion of use in relation to all drugs after six years of evolution. The CHAMP project was performed twelve years before the present study and, on that date, the use of evidence-based medications was
substantially lower, e.g., 12% beta-blockers, statins 6% and 4% of ACE inhibitors. This study was performed in a tertiary
and academic hospital, where the use of these therapies is already in reasonable proportions, with lower propensity to increase in use after programs of quality of care improvement.
Recent publication of the preliminary results of the study Stabilization of Atherosclerotic plaque By Initiation of darapLadIb Therapy (STABILITY), involving 15,828 patients in 39 countries with chronic CAD, showed that the proportion of the prescription of recommended therapy for secondary
(97%), ACE inhibitors and ARBs (77%) and beta-blockers (79%). Despite this, many patients did not reach treatment goals for blood pressure (46%), LDL-cholesterol (29%), glycemic
control among diabetics and the prevalence of overweight
and obesity were high (79% and 36%, respectively) with
considerable regional differences. Among diabetic patients,
44% achieved target HbA1c <7% [9].
These results show many similarities with the present study, since the proportion of use of drugs recommended, both during pre- and post-intervention, was quite satisfactory, but the patients who achieved the proposed targets were lagging
behind: waist circumference (21.1%), LDL-cholesterol (34.8%), HDL cholesterol (56%) and HbA1c (40.3%). The
exception was the control of blood pressure, both systolic
and diastolic, whose averages signiicantly reduced in
comparison with the Phase 1 and 2 [9].
Comparing these data with the results of the present study, we consider some differences: a) the setting of a clinical trial is different from what happens in the real world, because the
proile of the patients and the inclusion and exclusion criteria
are not always the same and, in the present study, patients were included in the outpatient care routine and b) differences in follow-up time: 4.6 years on average for COURAGE, six years in CHAMP and, in this study, between six to twelve months, c) in studies under discussion the same patients in the pre- and post-intervention period were compared, whereas in the present study, the comparison between Phases 1 and 2 were independent populations, and Phases 1 and 3 were dependent groups.
Results of the Phase 1 and Phase 3
The demographic and clinical characteristics were similar except for peripheral arterial disease, whose proportion was
9.7% in Phase 1, and 13.3% in Phase 3 (P=0.007). Regarding risk factors, we consider only the modiiable: smoking
and physical activity, and for both variables, there was no
signiicant differences between the two phases. Regarding anthropometric measures, there was a signiicant increase
of the weight (P=0.004) and a signiicant reduction in
SBP (P<0.001) and DBP (P<0.001). For BMI and waist circumference, there was increased number, but without
reaching statistical signiicance. Regarding laboratory tests, there was no signiicant differences between the two phases,
although total cholesterol and LDL-cholesterol showed numerical reduction, but other variables remained in similar levels.
Comparing the proportion of patients’ exams within the
targets, we observed: LDL cholesterol <70 mg/dl: 34.6% vs. 37.3% (P=0.509), HDL-cholesterol> 40 mg/dl (men): 54.3% vs. 58.8% (P=0.073), HDL-cholesterol> 45 mg/dl (female): 62.2% vs. 60.2% (P=0.630) and among diabetics, fasting glucose <100 mg/dl: 13.6% vs. 21.2% (P=0.136), and HbA1c <7.0%: 47.4% vs. 51.3% (P=1.00). When we
compare the prescription of recommended medications, there
was a signiicant difference for lower use of ACE inhibitors
(P=0.011) and increased use of ARBs (P=0.035). In Phase 3,
different from that observed in Phase 2, there was no increase in the number of collected information, particularly with
respect to demographics, making dificult the appropriate
methodological data analysis. We can attribute this to the fact of not acting managing process nurse at this stage.
The STABILITY study, which involved patients with a
proile similar to the current study aimint the atherosclerotic
plaque stabilization in patients with chronic CAD using the suitable standard medication, based on the ACC/AHA guidelines for secondary prevention, established as targets:
proportions ≥ 90 % of patients on aspirin, ≥ 80% of patients on statin therapy, ≥ 80% of patients with LDL-cholesterol <100 mg/dL, ≥ 80% of patients with SBP <140 mmHg and DBP <90 mmHg and ≥ 70% of diabetic patients with HbA1c <7%. After four years of follow-up, this study obtained the following proportions of use of medicines: aspirin, 96% and 94.3%, statins, 96.7% and 95%, beta-blockers, 76.3% and 79%, ACEI/ARBs , 82.7% and 86.7%; in relation to the targets: LDL cholesterol <70 mg/dl, 33% and 33.7%, SBP <140 mmHg, 76.3% and 66.4%, DBP < 90 mmHg, 85.5% and 89.3%, HbA1c <7%, 29.8% and 39.3%, respectively [9].
Assessing data related to our center in this clinical study, comparing the initial visit to the last visit, the results showed:
use of AAS: 100% and 100%, statins: 94.1% and 100%, beta-blockers: 76.5% and 88.2%, ACEI/ARBs: 70.6% and 76.5%, LDL-cholesterol <70mg/dL: 17.6% and 29.4%, SBP <140 mmHg: 42.9% and 85, 7%, DBP <90 mmHg: 74.4% and 100% and HbA1c <7.0%: 16.7% and 33.3%, respectively.
Comparing the results of STABILITY in our center with this study, it was observed proportion of prescription medications comparable, however, regarding some targets, although it deals with an assessment of daily clinical practice in the institution, showed relatively better results than STABILITY,
as follows: LDL-cholesterol <70 mg/dl: 37.3% vs. 29.4% and HbA1c: 51.3% vs. 33.3%.
CONCLUSION
There was no signiicant change in the use of medications with proven eficacy in secondary prevention of CAD
between the pre- and post-intervention, both between Phases 1 and 2 and between Phases 1 and 3, considering their proper prescription from pre- intervention. Regarding the
parameters related to the modiication of lifestyle through non-pharmacological measures, there was a signiicant
improvement in relation to smoking and physical activity in Phase 2 compared to Phase 1, and numerical improvement,
but did not reach statistical signiicance for other parameters
diabetics. There was substantial improvement in the levels of SBP and DBP in both comparison between Phases 1 and 2 and between Phases 1 and 3. The inclusion of nurses trained to manage the “case manager” process is critical to the effectiveness of a comprehensive prevention program for patients with CAD. Programs for improving quality of care in tertiary and academic hospitals, should probably be continued by follow-up period exceeding one year.
ACKNOWLEDGMENTS
To Wellington Cícero de Carvalho, systems analyst at Division of Translational Epidemiology of the Dante Pazzanese Institute of Cardiology.
To Soane Mota dos Santos, Statistics at Laboratory of Epidemiology and Statistics of the Dante Pazzanese Institute of Cardiology.
To Nilza Tamashiro, biologist and study coordinator.
REFERENCES
1. Fraker TD Jr, Fihn SD, Gibbons RJ, Abrams J, Chatterjee K, Daley J, et al. 2007 chronic angina focused update of the ACC/ AHA 2002 Guidelines for the management of patients with chronic stable angina: a report of the American College of Cardiology/American Heart Association Task Force on Practice Guidelines Writing Group to develop the focused update of the 2002 Guidelines for the management of patients with chronic stable angina. Circulation. 2007;116(23):2762-72.
2. Fox K, Garcia MA, Ardissino D, Buszman P, Camici PG, Crea F, et al; Task Force on the Management of Stable Angina Pectoris of the European Society of Cardiology; ESC Committee for Practice Guidelines (CPG). Guidelines on the management of stable angina pectoris: executive summary: The Task Force on the
Management of Stable Angina Pectoris of the European Society of Cardiology. Eur Heart J. 2006;27(11):1341-81.
3. César LAM, Mansur AP, Armaganijan D, Amino JG, Sousa AC, Simão AF, et al. Diretrizes de doença coronariana crônica angina estável. Arq Bras Cardiol. 2004;83(supl. II):1-43.
4. Spolito AC, Caramelli B, Fonseca FAH, Bertolami AC, Rassi Jr. A, Sposito AC, et al. IV Diretriz brasileira sobre dislipidemias e prevenção da aterosclerose. Arq Bras Cardiol. 2007;88(supl I):1-19.
5. Kotseva K, Wood D, De Backer G, De Bacquer D, Pyörälä K, Keil U; EUROASPIRE Study Group. Cardiovascular prevention guidelines in daily practice: a comparison of EUROASPIRE I, II, and III surveys in eight European countries. Lancet. 2009;373(9667):929-40.
6. Yusuf S, Islam S, Chow CK, Rangarajan S, Dagenais G, Diaz R, et AL; Prospective Urban Rural Epidemiology (PURE) Study Investigators. Use of secondary prevention drugs for cardiovascular disease in the community in high-income, middle-high-income, and low-income countries (the PURE Study): a prospective epidemiological survey. Lancet. 2011;378(9798):1231-43.
7. Fonarow GC, Gawlinski A, Moughrabi S, Tillisch JH. Improved treatment of coronary heart disease by implementation of a Cardiac Hospitalization Atherosclerosis Management Program (CHAMP). Am J Cardiol. 2001;87(7):819-22.
8. Maron DJ, Boden WE, O’Rourke RA, Hartigan PM, Calfas KJ, Mancini GB, et al; COURAGE Trial Research Group. Intensive multifactorial intervention for stable coronary artery disease: optimal medical therapy in the COURAGE (Clinical Outcomes Utilizing Revascularization and Aggressive Drug Evaluation) trial. J Am Coll Cardiol. 2010;55(13):1348-58.