AMTD
6, 8959–9003, 2013Quantifying nitrous oxide mitigation
efficacy
A. M. S. McMillan et al.
Title Page
Abstract Introduction
Conclusions References
Tables Figures
◭ ◮
◭ ◮
Back Close
Full Screen / Esc
Printer-friendly Version
Interactive Discussion
Discussion
P
a
per
|
D
iscussion
P
a
per
|
Discussion
P
a
per
|
Discuss
ion
P
a
per
|
Atmos. Meas. Tech. Discuss., 6, 8959–9003, 2013 www.atmos-meas-tech-discuss.net/6/8959/2013/ doi:10.5194/amtd-6-8959-2013
© Author(s) 2013. CC Attribution 3.0 License.
Atmospheric Measurement
Techniques
Open Access
Discussions
This discussion paper is/has been under review for the journal Atmospheric Measurement Techniques (AMT). Please refer to the corresponding final paper in AMT if available.
The detectability of nitrous oxide
mitigation e
ffi
cacy in intensively grazed
pastures using a multiple plot
micrometeorological technique
A. M. S. McMillan1,*, M. J. Harvey1, R. J. Martin1, A. M. Bromley1, M. J. Evans1, S. Mukherjee2, and J. Laubach3
1
National Institute of Water and Atmospheric Research, Private Bag 14901, Wellington 6012, New Zealand
2
Department of Geography, University of Canterbury, Private Bag 4800, Christchurch 8020, New Zealand
3
Landcare Research, P.O. Box 40, Lincoln 7640, New Zealand *
now at: Landcare Research, Private Bag 11052, Palmerston North 7640, New Zealand
Received: 29 August 2013 – Accepted: 25 September 2013 – Published: 16 October 2013
Correspondence to: A. M. S. McMillan ([email protected])
AMTD
6, 8959–9003, 2013Quantifying nitrous oxide mitigation
efficacy
A. M. S. McMillan et al.
Title Page
Abstract Introduction
Conclusions References
Tables Figures
◭ ◮
◭ ◮
Back Close
Full Screen / Esc
Printer-friendly Version
Interactive Discussion
Discussion
P
a
per
|
D
iscussion
P
a
per
|
Discussion
P
a
per
|
Discuss
ion
P
a
per
|
Abstract
Methodologies are required to verify agricultural greenhouse gas mitigation at scales relevant to farm management. Micrometeorological techniques provide a viable ap-proach for comparing fluxes between fields receiving mitigation treatments and control fields. However, they have rarely been applied to spatially verifying treatments aimed
5
at mitigating nitrous oxide emission from intensively grazed pastoral systems. We de-ployed a micrometeorological system to compare N2O flux among several ∼1.5 ha plots in intensively grazed dairy pasture. The sample collection and measurement sys-tem is referred to as the Field-Scale Nitrous Oxide Mitigation Assessment Syssys-tem (FS-NOMAS) and used a tuneable diode laser absorption spectrometer to measure
10
N2O gradients to high precision at four locations along a 300 m transect. The utility of
the FS-NOMAS to assess mitigation efficacy depends largely on its ability to resolve very small vertical N2O gradients. The performance of the FS-NOMAS was assessed in this respect in laboratory and field-based studies. The FS-NOMAS could reliably resolve gradients of 0.039 ppb between a height of 0.5 m and 1.0 m. The gradient
res-15
olution achieved corresponded to the ability to detect an inter-plot N2O flux difference of 26.4 µg N2O-N m−2h−1 under the most commonly encountered conditions of atmo-spheric mixing (quantified here by a turbulent transfer coefficient), but this ranged from 11 to 59 µg N2O-N m−
2
h−1as the transfer coefficient ranged between its 5th and 95th percentile. Assuming a likely value of 100 µg N2O-N m−2h−1for post-grazing N2O fluxes
20
AMTD
6, 8959–9003, 2013Quantifying nitrous oxide mitigation
efficacy
A. M. S. McMillan et al.
Title Page
Abstract Introduction
Conclusions References
Tables Figures
◭ ◮
◭ ◮
Back Close
Full Screen / Esc
Printer-friendly Version
Interactive Discussion
Discussion
P
a
per
|
D
iscussion
P
a
per
|
Discussion
P
a
per
|
Discuss
ion
P
a
per
|
1 Introduction
Agricultural soils are responsible for a substantial portion of the total global emissions of N2O. While the uncertainty in the total source strength of agricultural emissions is
large (>39 %) the estimate of the source strength during the 1990s of agricultural soils was 2.8 Tg N yr−1, which accounts for almost 42 % of the global emissions during this
5
period (IPCC, 2007). In New Zealand, outdoor livestock grazing is the predominant land use type and direct N2O emissions from soil following fertiliser and excretal nitrogen deposition on pasture account for more than 75 % of New Zealand’s reported anthro-pogenic N2O emissions (Ministry for the Environment, 2013). A nationally coordinated
effort has been directed at the quantification of these fluxes for a range of characteristic
10
pasture types and locations.
More recently, measurement campaigns have focused on assessing the efficacy of potential mitigation strategies, such as the application of a nitrification inhibitor, to re-duce N2O emissions from grazed pasture. Such campaigns necessarily involve
com-parative experimental designs (i.e., mitigation treatment versus control). The majority
15
of such assessments have been implemented at the experimental plot scale (<1 m2) using static flux chambers (e.g., Gillingham et al., 2012). Typically, flux measurements are taken from plots that have been treated with known inputs of nitrogen, in the form of artificial urine and/or urea fertiliser, and with or without the addition of the mitigant of interest.
20
These experiments are valuable for developing emissions factors for mitigation for incorporation into greenhouse gas inventories (Clough et al., 2007), but to extrap-olate these measured emissions to an operational field scale, several assumptions are required. These include (1) that the experimental conditions imposed in the plot (soil moisture, nitrogen and application of mitigant) can be reliably extrapolated to the
25
AMTD
6, 8959–9003, 2013Quantifying nitrous oxide mitigation
efficacy
A. M. S. McMillan et al.
Title Page
Abstract Introduction
Conclusions References
Tables Figures
◭ ◮
◭ ◮
Back Close
Full Screen / Esc
Printer-friendly Version
Interactive Discussion
Discussion
P
a
per
|
D
iscussion
P
a
per
|
Discussion
P
a
per
|
Discuss
ion
P
a
per
|
compared to the experimental plot scale; (3) that the artefacts of chamber sampling are minor compared to the magnitude of the differences between the fluxes.
It is therefore desirable to obtain a field scale estimate of mitigation efficacy by com-paring N2O emissions between treated and untreated fields using an independent mea-surement technique. It is generally impractical to attempt representative sampling of
5
N2O fluxes by random placement of chambers within a paddock due to the uneven
nature of excretal-N deposition (Giltrap et al., 2012), which is the main driver of N2O emissions in grazed pasture.
Micrometeorological techniques provide a means for verifying a mitigation efficacy at the field scale. They address concerns about chamber methodology by: (1)
avoid-10
ing interference with the soil/atmosphere environment by measuring N2O in air moving over the surface of interest; (2) measuring at a spatial scale that integrates the spatial heterogeneity that is a result of livestock excreta-N deposition; (3) measuring quasi-continuously and automatically, yielding several flux estimates per treatment per day at regular intervals; (4) measuring at the scale similar to that of the basic unit of
commer-15
cial management (e.g., the 1 to 10 ha field). While a micrometeorological approach may address some issues associated with static flux chamber sampling, there are relatively few studies in which micrometeorological systems have been deployed in a compara-tive mode to measure field treatment effects of N2O emissions (Wagner-Riddle et al.,
1996, 2007) and they have not previously been applied to the intensively grazed
pas-20
toral system.
Agricultural fluxes of N2O impart very small changes to the background N2O mixing
ratio. When attempting to measure these fluxes using a micrometeorological approach, we are not enclosing the surface of interest and N2O fluxes from the surface of
inter-est are diluted by the background air. Therefore, an extremely sensitive analyser with
25
AMTD
6, 8959–9003, 2013Quantifying nitrous oxide mitigation
efficacy
A. M. S. McMillan et al.
Title Page
Abstract Introduction
Conclusions References
Tables Figures
◭ ◮
◭ ◮
Back Close
Full Screen / Esc
Printer-friendly Version
Interactive Discussion
Discussion
P
a
per
|
D
iscussion
P
a
per
|
Discussion
P
a
per
|
Discuss
ion
P
a
per
|
A cost-effective solution is to design a sample collection system capable of deliver-ing air samples from multiple plots to a sdeliver-ingle analyser. Makdeliver-ing comparisons among different treatments requires an additional level of precision as the task will demand detecting differences between fluxes from mitigated and control plots. Such a design would require consideration of the layout of the experimental plots relative to the
mea-5
surement points. Since the source area is not constrained (as it would be using a static flux chamber) we must ensure that the sampled area is sufficiently large in order to minimise cross-contamination by fluxes from areas outside of the plot of interest. This requires evaluation of the flux footprint (the extent of the area that contributes to the measured fluxes). In practical terms, the upper limit to the spatial separation between
10
sampling points was limited by the distance over which we could reliably transport air in a tube from the sampling location to the analyser.
Here we describe a micrometeorological method, adapted from Pattey et al. (2006) and Wagner-Riddle et al. (1996), but applied to the specific problem of measuring mit-igation efficacy in an intensively grazed pasture. We refer to our method as the
Field-15
Scale Nitrous Oxide Mitigation Assessment System or FS-NOMAS, describe a novel approach for calibrating our gradient measurement, and evaluate its performance in as-sessing mitigation efficacy from multiple-plot measurement on intensively grazed pas-ture. The specific mitigation strategy examined was the post-grazing application of the nitrification inhibitor, dicyandiamide (DCD), which has been found to reduce N2O
emis-20
sions in a growing body of studies in New Zealand grazed systems (see Clough et al., 2007). This paper first assesses the ability of the FS-NOMAS to resolve small N2O
AMTD
6, 8959–9003, 2013Quantifying nitrous oxide mitigation
efficacy
A. M. S. McMillan et al.
Title Page
Abstract Introduction
Conclusions References
Tables Figures
◭ ◮
◭ ◮
Back Close
Full Screen / Esc
Printer-friendly Version
Interactive Discussion
Discussion
P
a
per
|
D
iscussion
P
a
per
|
Discussion
P
a
per
|
Discuss
ion
P
a
per
|
2 Methods and materials
2.1 Flux-gradient technique
The flux gradient approach was selected as the best-suited method for multi-site sam-pling with a single analyser. A tunable diode laser absorption spectrometer (model: TGA100A, Campbell Scientific, Logan, Utah), referred to hereafter as a TDLAS, was
5
used to make N2O gradient measurements that could be compared among multiple sites. It has been previously deployed for measuring N2O emissions in croplands
(Lav-ille et al., 1999; Wagner-Riddle et al., 2007; Wagner-Riddle and Thurtell, 1998), tur-fgrass (Maggiotto et al., 2000), and irrigated pasture in Australia and New Zealand (Phillips et al., 2007; Harvey et al., 2008). A thorough description of the measurement
10
of N2O gradients and the use of the flux gradient approach to determine N2O fluxes is
given by Pattey et al. (2006).
In the flux gradient approach, the flux of a gas, Fg, can be determined from the
product of its vertical gradient above the surface of interest, (∂Cg/∂z) and an eddy diffusivity term,kg(Eq. 1).
15
Fg=−Kg(∂Cg/∂z) (1)
Kg is estimated using Monin-Obukhov similarity theory, which posits that under
neu-tral conditions the turbulent diffusivities for momentum (Km), heat (Kh) and gas (Kg) are equal (i.e.,Kg=Km=Kh) (Monteith and Unsworth, 1990). Under non-neutral
con-ditions, corrections can be made to equate the diffusivities (e.g. Högström, 1988).
20
A tracer study by Flesch et al. (2002) indicating that Km may be only 0.6 of Kg has challenged this concept of equal diffusivities under neutral conditions, and we address this issue in the discussion section. Measurements of the three dimensional wind field and virtual temperature are made with a sonic anemometer, and can be used to esti-mate a value forKgthat we assume applies to the entire field over the gradient sampling 25
time. The gradient, (∂Cg/∂z), can be measured at points upwind of the treatment plots
AMTD
6, 8959–9003, 2013Quantifying nitrous oxide mitigation
efficacy
A. M. S. McMillan et al.
Title Page
Abstract Introduction
Conclusions References
Tables Figures
◭ ◮
◭ ◮
Back Close
Full Screen / Esc
Printer-friendly Version
Interactive Discussion
Discussion
P
a
per
|
D
iscussion
P
a
per
|
Discussion
P
a
per
|
Discuss
ion
P
a
per
|
The setup was designed so that it could be deployed in a commercial livestock graz-ing system with the capability to compare emissions from up to five 1.5 ha plots, but is particularly suited for the comparing up to two mitigation or N-manipulation treatments with an untreated control.
2.2 Set-up of experimental field for testing of the FS-NOMAS
5
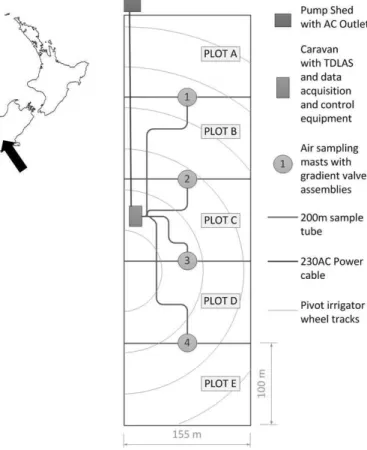
We tested the FS-NOMAS at an intensively managed, commercial dairy farm 6 km south-west of the Methven Township in Canterbury, New Zealand (Fig. 1). The field was located at 43◦40′S, 171◦35′E at an altitude of 308 m. The area has an annual average temperatures of 11.1◦C (2009–2011) and a total mean annual precipitation of 978 mm yr−1(1981–2010) (retrieved from the National Institute of Water and
Atmo-10
sphere’s Climate Database: http://cliflo.niwa.co.nz/). A centre-pivot irrigator was used to supplement rainfall to achieve a total water application rate of 6 mm d−1during summer. The soil is a well-drained sedimentary Pallic Firm Brown Soil described as a Lismore Stony Silt Loam (T. Webb, personal communication, 2011).
The North end of a 10 ha paddock was subdivided crosswise into 5 equal size plots of
15
dimensions: 100 m×155 m (the shorter edge oriented in the NNW direction (338◦), and the longer edge oriented in the ENE (68◦) direction) (Fig. 1). Four short (2 m) masts, equipped with air intakes were located at the centre point of each of the four common edges of the five plots. The wind regime was largely bi-directional.During northerly winds, the towers sampled fluxes from the adjacent plot in the northerly direction.
Dur-20
ing southerly winds, each tower sampled fluxes from plots to the south.
This configuration (Fig. 1) allowed the possible testing of different treatments on plots B and D, while the remaining plots (A, C and E) acted as experimental control plots. Two trials were conducted using several different nitrogen management tech-niques to test the ability of the FS-NOMS in determining treatment effects on N2O
25
AMTD
6, 8959–9003, 2013Quantifying nitrous oxide mitigation
efficacy
A. M. S. McMillan et al.
Title Page
Abstract Introduction
Conclusions References
Tables Figures
◭ ◮
◭ ◮
Back Close
Full Screen / Esc
Printer-friendly Version
Interactive Discussion
Discussion
P
a
per
|
D
iscussion
P
a
per
|
Discussion
P
a
per
|
Discuss
ion
P
a
per
|
(DCD). In the Spring Experiment (20 September 2010–25 November 2010), the FS-NOMAS was tested using plot treatments of (a) 10 kg ha−1of granular form of DCD in one plot and (b) a doubled urea-N application (60 kg ha−1 versus 30 kg ha−1 that was applied to control plots and DCD plot).
2.3 Sample collection and analysis of the N2O gradient,∆N2O
5
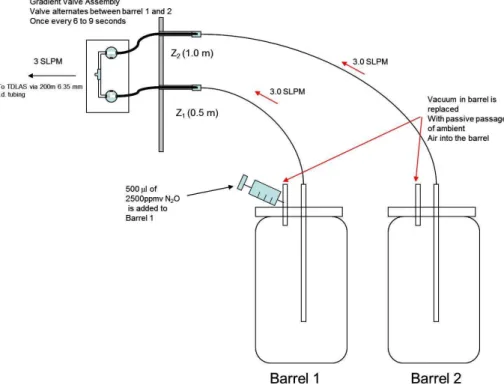
The plumbing system of FS-NOMAS consisted of gradient valve assemblies (GVA) installed on each of the four masts connected to a common sample manifold via sepa-rate 200 m lengths of 6.35 mm i.d. polythene tube (Fig. 2). Each GVA consisted of two solenoid valves that alternately connected inletsz1 or z2 in line with the 200 m tube.
The GVA was equipped with a 0.6 mm diameter critical orifice (O’Keefe Controls,
Trum-10
bull, CT) that choked flow to 3.1 L min−1 and prevented condensation of water within the tube by maintaining sub-ambient pressure en route to the TDLAS.
The sample manifold could be set to connect any one of the four GVAs to the TDLAS via a multi-core Nafion® membrane drier (PD1000 Series, Campbell Scientific Inc., Logan, NE, USA) and air collected from the three other GVAs to bypass the TDLAS
15
and drier and flow directly to the vacuum pump. The vacuum was achieved by a rotary-vane pump (Busch 0021, Busch USA, Virginia Beach, VA, USA).
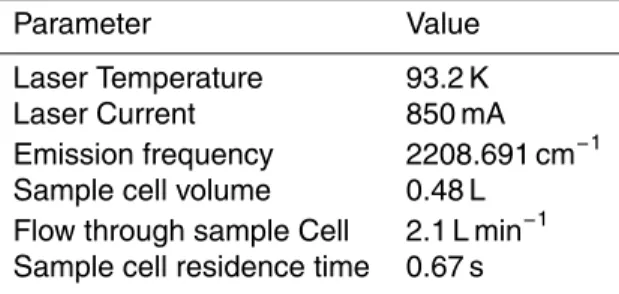
The TDLAS was tuned to a single mid-infrared absorbance line and was controlled precisely for laser temperature and current (Table 2). Throughout the measurement sequence vacuum in the TDLAS measurement cell was maintained at 5 kPa.
20
Measurements of N2O mole fraction were made on the airstream exiting the
particu-lar 200 m tube that was in line the TDLAS during a sampling interval. N2O mole fraction data was acquired at a rate of 10 Hz. This airstream consisted of discrete packets of air that resulted from the alternating sampling of inletsz1and z2at the GVA. The two
heights at which the gradient was measured, z1=0.5 m and z2=1.0 m, were fixed
25
throughout the study so that there was a constant relationship between the N2O
gra-dient (ppb/height) and the measured∆N2O (ppb betweenz1 andz2). Accordingly, the
AMTD
6, 8959–9003, 2013Quantifying nitrous oxide mitigation
efficacy
A. M. S. McMillan et al.
Title Page
Abstract Introduction
Conclusions References
Tables Figures
◭ ◮
◭ ◮
Back Close
Full Screen / Esc
Printer-friendly Version
Interactive Discussion
Discussion
P
a
per
|
D
iscussion
P
a
per
|
Discussion
P
a
per
|
Discuss
ion
P
a
per
|
N2O mole fractions could be assigned to each inlet based on knowledge of the transit time from the inlets to the TDLAS. This transit time from the inlets to the TDLAS was estimated by introducing a pulse of liquid nitrogen vapour (depleted in N2O) to the inlet
and measuring the time until a response at the TDLAS was observed (Pattey et al., 2006). This estimate of transit time was refined during post-processing of the data.
5
Having corrected for the transit time, the N2O signal from the air stream was
or-ganized into two data sets according to whether the air was collected fromz1 orz2. Data corresponding to the inlet transition period 1.5 s immediately before and the 1 s immediately after the GVA switched between inlets were omitted from each data set.
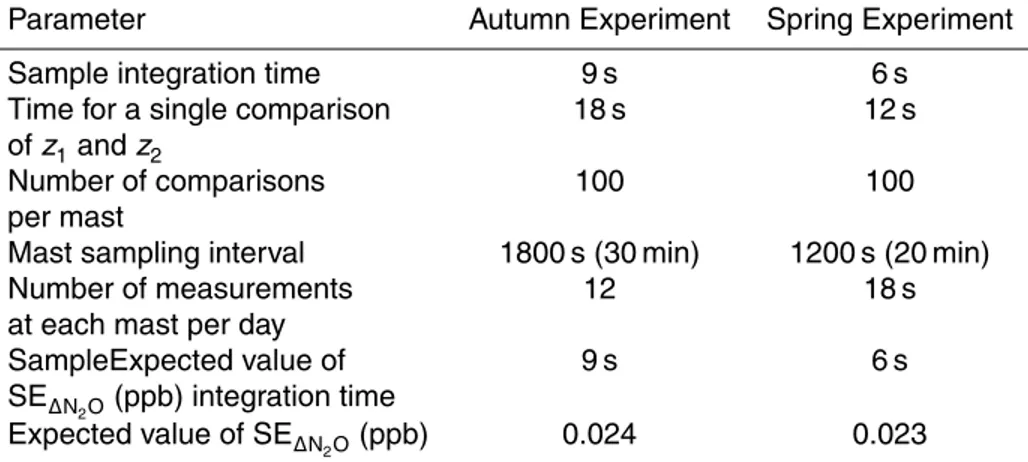
Two different valve timing schemes were tested (Table 1). In the Autumn Experiment,
10
the GVA switched betweenz1andz2 every 9 s and repeated the sequence 100 times before the manifold connected a GVA at another mast in line with the sensor. This resulted in a sampling time of 30 min at each mast. In the Spring Experiment, the switching time was reduced to 6 s, and with 100 repetitions of thez1/z2cycle resulted in a mast sampling time of 20 min.
15
When measuring N2O at more than one location (and using a single sample pump),
the flow must be split among all the four sample lines (the one in line with the TDLAS and the three others that are bypassing the laser, see Fig. 2). This resulted in a reduced flow through the sample cell (2.1 L min−1), which in turn increased the residence time within the sample cell to 0.67 s. This reduced the effective response time of the
instru-20
ment below that of the 10 Hz data acquisition rate. However, the sampling frequency was still sufficiently high to obtain a precise estimate of N2O. For the 9 s switching
time in the Autumn Experiment, 977 independent samples of N2O from each height were obtained. For the 6 s switching time in the Spring Experiment, 451 independent samples of N2O from each height were obtained.
AMTD
6, 8959–9003, 2013Quantifying nitrous oxide mitigation
efficacy
A. M. S. McMillan et al.
Title Page
Abstract Introduction
Conclusions References
Tables Figures
◭ ◮
◭ ◮
Back Close
Full Screen / Esc
Printer-friendly Version
Interactive Discussion
Discussion
P
a
per
|
D
iscussion
P
a
per
|
Discussion
P
a
per
|
Discuss
ion
P
a
per
|
The estimate of the uncertainty or error to which∆N2O was determined was calcu-lated from the standard error of the difference between two means (Zar, 1984):
SE∆N
2O=
v u u tσ
2 z1
nz
1
+σ
2 z2
nz
2
(2)
whereσz21 and σz22 are the pooled variances of the individual N2O determinations for
the upper and lower inlets,z1andz2, respectively.
5
The statistical significance of an observed∆N2O value was assessed by comparing
the Student’s t value of a gradient, t= ∆N2O/SE∆N2O, against the one-tailed critical
Student’stvalue with the number of degrees of freedom corresponding to the number of independent N2O determinations.
2.4 Laboratory determination of gradient resolution
10
A verification test, using fixed volumes spiked with N2O, was designed to confirm that
the FS-NOMAS was capable of (i) transporting packets of air collected at the inlets in an intact form to the TDLAS; (ii) that the N2O between inlets z1 and z2 were
accu-rately measured, and (iii) that very small values of N2O could be adequately resolved.
In principle, if we had the ability to create two calibration tanks that have very small
dif-15
ferences in N2O mole fraction we could test this directly. However, in practice, making
and calibrating gas mixtures with small mole fraction differences (below 1 ppb) level is laborious. Further, even if this was achieved, the large flow requirement of the sampling system (3.1 L min−1) would mean that any such tanks, once created, would be rapidly exhausted.
20
Instead, we compared the N2O content of two air streams (Fig. 3). The first air stream was extracted from a fixed ballast volume (60 L) that was continually flushed with am-bient air. The second air stream was also a continually flushed fixed ballast volume (60 L), and at a point in time was spiked with a dose of concentrated N2O.
Immedi-ately following the spiking, the mole fraction difference between the two air streams
AMTD
6, 8959–9003, 2013Quantifying nitrous oxide mitigation
efficacy
A. M. S. McMillan et al.
Title Page
Abstract Introduction
Conclusions References
Tables Figures
◭ ◮
◭ ◮
Back Close
Full Screen / Esc
Printer-friendly Version
Interactive Discussion
Discussion
P
a
per
|
D
iscussion
P
a
per
|
Discussion
P
a
per
|
Discuss
ion
P
a
per
|
was high (∼14 ppb). With continued flushing the mole fraction difference between the barrels decreased due to dilution of air in the second barrel with fresh ambient air. The time course of the mole fraction decrease followed a negative exponential function that was predictable using a first order exponential decay equation using the initial N2O spike amount and the residence time of air in the barrel as parameters. Over time, the
5
N2O difference between the two air streams became negligible. Just before this
oc-curred, in the final stages of the exponential decay, there is a period of time where the N2O difference between the two air streams is extremely small. It is during this period
that we can examine the limits of the instrument to resolve gradients of N2O.
The two air streams were achieved by attaching two 60 L plastic barrels to the inlets
10
z1andz2of the GVA . The barrels were capped with an airtight seal. The caps had two sampling ports that allowed attachments of tubes to the internal volume of the barrel. One port was attached to the sample inlet of the GVA, while the other port was left open.
This set-up closely approximated field sampling conditions. The remaining three
15
GVAs (those not attached to the barrels) were also in the same configuration as in the field, where by they continued alternating betweenz1and z2, but the sampled air bypassed the Nafion Drier and the TDLAS, and went directly to the pump.
The N2O trace from the TDLAS was measured for approximately one hour to
es-tablish that there was a minimal difference between the two barrels. Then one of the
20
barrels was injected with 0.5 mL of a N2O calibration mixture that had a mole fraction
of 2500 ppb (BOC Special Gases, gravimetrically prepared according to ISO6143 gas analysis methods). The 1250 nL aliquot of N2O increased the N2O mole fraction of the
z1barrel by∼14 ppb relative to the other barrel. However this elevation was short lived,
and decayed away (over∼5 min) as fresh, ambient air was continually drawn into both
25
barrels (from the same height) at an average rate of 1.5 L min−1.
An examination of repeated N2O (elevation above ambient) determinations indicated
AMTD
6, 8959–9003, 2013Quantifying nitrous oxide mitigation
efficacy
A. M. S. McMillan et al.
Title Page
Abstract Introduction
Conclusions References
Tables Figures
◭ ◮
◭ ◮
Back Close
Full Screen / Esc
Printer-friendly Version
Interactive Discussion
Discussion
P
a
per
|
D
iscussion
P
a
per
|
Discussion
P
a
per
|
Discuss
ion
P
a
per
|
the N2O mole fraction difference betweenz1andz2,∆N2O. The∆N2O closely followed the N2O predicted from a consideration of the exponential decay dilution of the added
N2O (Fig. 4) with fresh ambient air at a rate of 1.56 L min− 1
. Following the injection, the N2O mole fraction in the spiked barrel would decrease in an exponential manner
according to the decay function below:
5
∆N2Opred(t)=ce-bt (3)
where: ∆N2Opred is the mole fraction difference between the barrels at time, t
(min), following the injection;b=flow through barrel/barrel volume (1.56 L min−1/60 L=
0.026 min−1); andc=N2O injected (1250 nL).
We compared the agreement between observed ∆N2O and∆N2Opred for 5.1 h fol-10
lowing the injection. The correspondence was excellent (∆N2O=0.999∆N2Opred−
0.0922,r2=0.999) and indicated that the accuracy of the FS-NOMAS in determining
∆N2O differences was satisfactory over periods longer than the 20–30 min site
sam-pling duration for a wide range of∆N2O.
Finally, after 5.1 h of dilution, the mole fraction of the spiked barrel was only very
15
slightly greater than that of the unspiked barrel (∆N2O=0.058±0.019 ppb, Fig. 4)
yet this was a statistically significant difference (P<0.01) and indicated that the FS-NOMAS was capable of resolving extremely small values of N2O.
2.5 Calculation of the N2O flux,FN2O
The form of the equation used for the calculation of fluxes (Eq. 4) contains the termCTr, 20
which incorporates both the molar density of air and the stability-corrected diffusivity integrated over the height interval of interest:
FN2O=100.8×CTr×∆N2O (4)
whereCTris the transfer coefficient (molAirm−2s−1),∆N2O is the N2O mole fraction dif-ference (nmol mol−1) over the vertical distance between the air sample inlets,z2−z1,
AMTD
6, 8959–9003, 2013Quantifying nitrous oxide mitigation
efficacy
A. M. S. McMillan et al.
Title Page
Abstract Introduction
Conclusions References
Tables Figures
◭ ◮
◭ ◮
Back Close
Full Screen / Esc
Printer-friendly Version
Interactive Discussion
Discussion
P
a
per
|
D
iscussion
P
a
per
|
Discussion
P
a
per
|
Discuss
ion
P
a
per
|
and 100.8 is a conversion factor to convert nmol N2O m− 2
s−1 to µg N2O-N m− 2
h−1. The rationale for introducing the term CTr is to provide a single proportionality
fac-tor between gradient and the flux that is specific to a particular set of measurement heights and incorporates both the stability correction and the density of air. It allowed a simple assessment of the relative importance of the emission rate versus the
turbu-5
lent/advective conditions of the atmosphere in determining the N2O gradient measured at the mast.
CTr(molAirm−2s−1)=ρa×Da (5)
whereρais the molar density of air (molAirm− 3
) andDais the diffusion velocity (Miyata
et al., 2000).
10
Da(m s−1)=k u∗/J (6)
wherek is von Kármán’s constant (0.40),u∗ is the friction velocity. The friction velocity
u∗is calculated by
u∗(m s−1)=hhu′v′i2+hv′w′i2i0.25 (7)
whereu′,v′ and w′ are the instantaneous fluctuations in the streamwise, crosswind
15
and vertical wind components, measured by the sonic anemometer. The termJ in the denominator of Eq. (6) combines the heights of the air inlets and the corrections to the stability parameters:
J=
ln(z2−d)−Ψh((z2−d)/L)
−
ln(z1−d)−Ψh((z1−d)/L)
(8) where
20
Ψh((z2−d)/L)=2ln((1+y)/2) for (z−d)/L<0, and (9)
AMTD
6, 8959–9003, 2013Quantifying nitrous oxide mitigation
efficacy
A. M. S. McMillan et al.
Title Page
Abstract Introduction
Conclusions References
Tables Figures
◭ ◮
◭ ◮
Back Close
Full Screen / Esc
Printer-friendly Version
Interactive Discussion
Discussion
P
a
per
|
D
iscussion
P
a
per
|
Discussion
P
a
per
|
Discuss
ion
P
a
per
|
where y=0.95(1−11.6((z−d)/L)) after Högström (1988) and Paulson (1970). The term d represents zero plane displacement height and must be subtracted from the measuring height (z) to represent the aerodynamic height (Foken, 2008). L is the Obukhov length representing the balance between mechanical and convective turbulence.
5
L= −u
3
∗θv
kghw′θvi′ (11)
whereg is the gravitational constant, θv is the mean virtual temperature and hw′θvi′
is the virtual temperature flux. The quantitiesu′,v′,w′,hw′θvi′ andu∗ required forCTr
andLwere measured by two sonic anemometers (CSAT3, Campbell Scientific, Logan, Utah and WindMasterPro, Gill Instruments, Lymington UK) located at mast 2 and 3.
10
3 Results
3.1 Instrument signal characteristics and determination of N2O
Optimal performance of the TDLAS is achieved when it is used to measure relative, rather than absolute, mole fraction measurements (Edwards et al., 1994). The raw N2O mole fraction signal was acquired from the TDLAS at a frequency of 10 Hz and varied
15
by 0.8 ppb (standard deviation) over a 12 s integration period. The signal was also subject to drift over longer time scales due to small, temperature-driven interferences in the optical path of the instrument, caused by a phenomenon known as the Fabry-Perot effect (Edwards et al., 1994). Operating the instrument in a relative mode and making many repeated comparisons of the N2O mole fraction at z1 and z2 (following
20
the approach described in Pattey et al., 2006) optimised the instrument’s ability to resolve N2O.
The performance of the FS-NOMAS in measuring N2O under ambient field
AMTD
6, 8959–9003, 2013Quantifying nitrous oxide mitigation
efficacy
A. M. S. McMillan et al.
Title Page
Abstract Introduction
Conclusions References
Tables Figures
◭ ◮
◭ ◮
Back Close
Full Screen / Esc
Printer-friendly Version
Interactive Discussion
Discussion
P
a
per
|
D
iscussion
P
a
per
|
Discussion
P
a
per
|
Discuss
ion
P
a
per
|
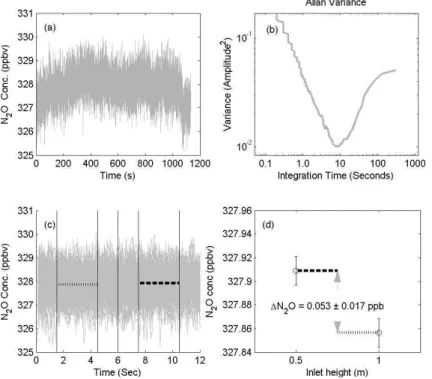
An example of a N2O time series collected during a single sampling period indicated that dominant modes of variability occur both on short (<10 s) and longer (>10 s) time scales (Fig. 5a). The shorter term variability is associated with random instrumental noise, while the longer term drift is associated with variations in ambient N2O mole fraction and the optical fringing that occurs due to the Fabry-Perot effect described
5
above. Allan Variance analysis (Allan, 1966) is useful for depicting the signal variance as a function of integration times and has been used to determine appropriate inte-gration times for laser signals (Hendriks et al., 2008; Mammarella et al., 2010). Allan Variance analysis on the TDLAS signal indicated that the optimal time over which to average the N2O signal is 6 to 10 s in order to minimise the influence of both short term
10
and long term variability (Fig. 5b).
The choice of the sample time, together with the choice of the number of N2O
deter-minations per sampling interval, dictated how many sampling intervals per mast could be achieved in a 24 h period. We tested sampling times of 9 s (Autumn Experiment) and 6 s (Spring Experiment). The 6 s sampling time was optimal (see Sect. 3.3
be-15
low) and consisted of 6 s of N2O determinations from air collected at z1 followed by
6 s of measurement at z2. This comparison interval of 12 s was repeated 100 times, resulting in a 20 min (1200 s) sampling interval for each mast. Accordingly, each mast was sampled 18 times per day. Figure 5c shows a time series of 100 consecutive 12 s comparisons plotted on a 0 to 12 s axis. Within each 6 s interval only measurements
20
from 1.5 s to 4.5 s were accepted for analysis, the remainder being omitted to avoid the possibility of cross-contamination between adjacent packets in the tube connection the inlets with the TDLAS. Over the 1200 s, the data set of 451 independent N2O de-terminations from each inlet were obtained, allowing a N2O difference to be measured
with many degrees of freedom (Fig. 5d). For the example shown in Fig. 5, the N2O 25
AMTD
6, 8959–9003, 2013Quantifying nitrous oxide mitigation
efficacy
A. M. S. McMillan et al.
Title Page
Abstract Introduction
Conclusions References
Tables Figures
◭ ◮
◭ ◮
Back Close
Full Screen / Esc
Printer-friendly Version
Interactive Discussion
Discussion
P
a
per
|
D
iscussion
P
a
per
|
Discussion
P
a
per
|
Discuss
ion
P
a
per
|
3.2 Gradient observations – values of N2O in ambient air and dependence on atmospheric mixing
Over the entire period of measurements, the largest ten gradients ranged between 15 and 88 ppb and generally occurred under very stable conditions. The lowest ten gradi-ents significant atP<0.01 ranged from 0.035 to 0.046 ppb. The most likely value for
5
N2O was 0.058 ppb (the peak value of the frequency distribution over all measurements of N2O). N2O gradients are affected both by the rate of vertical mixing in the surface
layer of the atmosphere and the source strength of the local fluxes. Therefore, when interpreting the magnitude of the observed N2O to infer flux strength, it is necessary to account for the atmospheric mixing, quantified here by the transfer coefficient,CTr.
10
Figure 6 shows individual frequency distributions of N2O and CTr and the frequency
of concurrent N2O-CTrobservations during the Spring Experiment. The individual
pop-ulations of N2O andCTr observations were generally skewed towards smaller values, and combined N2O-CTr observations were most frequent at N2O between 0.05 and
0.10 ppb and CTr values between 2.5 and 7.0 molAirm− 2
s−1, which covered the flux
15
range 1.3 to 70.5 µg N2O-N m−2h−1.
3.3 Resolution of gradient measurement – expected standard error of ∆N2O (SE∆N2O−exp) and the minimum resolvable gradient (∆N2OMinRes)
An estimate of the resolution achieved in the field was determined from an assessment of the ensemble SE∆N
2O for all observed N2O. The frequency distribution for SE∆N2O 20
indicated that these errors were log-normally distributed (Fig. 7) and that the most likely value was SE∆N2O=0.023 ppb. We considered this a conservative estimate of
the uncertainty of the FS-NOMAS and refer to this metric as the expected standard error of N2O or SE∆N
2O-exp (Table 1).
The minimum resolvable value of N2O must be significantly different from zero. 25
AMTD
6, 8959–9003, 2013Quantifying nitrous oxide mitigation
efficacy
A. M. S. McMillan et al.
Title Page
Abstract Introduction
Conclusions References
Tables Figures
◭ ◮
◭ ◮
Back Close
Full Screen / Esc
Printer-friendly Version
Interactive Discussion
Discussion
P
a
per
|
D
iscussion
P
a
per
|
Discussion
P
a
per
|
Discuss
ion
P
a
per
|
and P<0.05) (Zar, 1984) we can calculate the minimum resolvable gradient to be
tcrit×SE∆N2O-exp=1.65×0.023 ppb=0.039 ppb. We refer to this metric as∆N2OMinRes.
The great majority (>93 %) of N2O observations were above∆N2OMinRes, and
there-fore could be resolved to a confidence level of 95 %. The portion of gradients below this value accounted for less than 2 % of the cumulative N2O flux. We found that the 6 s 5
valve switching used in the Spring Experiment resulted in a slightly lower SE∆N2O-exp
than that found for the 9 s valve switching used in the Autumn Experiment (Table 1), so we adopt this valve timing scheme as the recommended option. The reason for the greater precision is not certain but could be either due to a more stable TDLAS signal, or less variance from the optical fringing effects.
10
The value∆N2OMinResis depicted on Fig. 6 to show that only a small portion of N2O observations fell below this value. Of the 1821 20 min N2O determinations observed
during this experiment, only 139 (7.6 %) observations were below∆N2OMinRes. If N2O
values that were calculated for these small gradients were indeed accurate then they would have accounted for only∼1 % of the total cumulative flux.
15
The contour lines of constant flux (isoflux lines) indicate the range of fluxes that are detectable using the FS-NOMAS. The isoflux line representing 10 µg N2O-N m−2h−1 falls below∆N2OMinResatCTrvalues above 2.6 molAirm−
2
s−1, indicating that a flux this small would only be measurable under gentle mixing conditions. The isoflux repre-senting 20 µg N2O-N m−2h−1falls below∆N2OMinResatCTrvalues of 4.4 molAirm−2s−1,
20
close to the median value ofCTr and suggesting that fluxes of this order can be
de-tected about 50 % of the time. Higher fluxes can be dede-tected under greater ranges of
CTr: fluxes of 50 µg N2O-N m−2h−1can be detected up to 95th percentile ofCTrvalues (13 molAirm−2s−1), while fluxes of 100 µg N2O-N m−2h−1can be detected at any value ofCTr.
AMTD
6, 8959–9003, 2013Quantifying nitrous oxide mitigation
efficacy
A. M. S. McMillan et al.
Title Page
Abstract Introduction
Conclusions References
Tables Figures
◭ ◮
◭ ◮
Back Close
Full Screen / Esc
Printer-friendly Version
Interactive Discussion
Discussion
P
a
per
|
D
iscussion
P
a
per
|
Discussion
P
a
per
|
Discuss
ion
P
a
per
|
3.4 Time series of N2O gradients, transfer coefficients and N2O fluxes and flux differences
Time series of∆N2O,CTr,FN
2Oand∆FN2Oare shown for a 48 h period in the Spring
Ex-periment to illustrate the determination of∆N2O in the field, diurnal variation inCTrand
subsequent calculation ofFN2Ofor two treatments and, ultimately calculation of∆FN2O, 5
the difference in N2O emission rates between the two treatments (Fig. 8). Overall, this 24 h period of data did not indicate obvious differences in N2O measured from
miti-gated versus control plots (Fig. 8a), although there were individual sampling intervals where the differences between N2O gradients were clearly resolved. For example, at 10.40 a.m. on 17 October,∆N2O values were 0.194±0.028 ppb and 0.079±0.036 ppb
10
for the control and mitigated plots, respectively. This translated to a flux of 225 and 97 µg N2O-N m−
2
h−1 (for the control and mitigated plots, respectively) and an instan-taneous mitigation efficacy of (225−97)/225×100 %=57 %. This period was subject to large variations in the transfer coefficient (∼1 to 15 molAirm−
2
s−1) (Fig. 8b). Despite this variability, the N2O differences between consecutive mitigated and control observa-15
tions translated into broadly corresponding differences of FN
2O (∆FN2O) because
hour-to-hour differences inCTrwere relatively minor.
4 Discussion
4.1 Did we have sufficient measurement precision to detect a mitigation effect?
The performance metrics of the FS-NOMAS are provided in Table 3. The resolution of
20
the N2O in this study was similar to resolutions cited in previous flux gradient studies of
N2O (Harvey et al., 2008; Pattey et al., 2006; Wagner-Riddle et al., 1996). However, it
AMTD
6, 8959–9003, 2013Quantifying nitrous oxide mitigation
efficacy
A. M. S. McMillan et al.
Title Page
Abstract Introduction
Conclusions References
Tables Figures
◭ ◮
◭ ◮
Back Close
Full Screen / Esc
Printer-friendly Version
Interactive Discussion
Discussion
P
a
per
|
D
iscussion
P
a
per
|
Discussion
P
a
per
|
Discuss
ion
P
a
per
|
here is conservative, as it is based on a 95 % confidence interval rather than the stan-dard error, and uses the peak of the frequency distribution of all stanstan-dard errors ob-served as the estimate for SE∆N2O. However, in the analysis below we argue that the
value of 0.034 ppb that we achieved for∆N2OMinRes was sufficiently precise to allow reasonable levels of mitigation efficacy to be detected.
5
The assessment of mitigation efficacy requires not only that FN2O at a particular
location can be measured at a high level of precision, but also that inter-plot diff er-ences between FN2O (∆FN2O) can be resolved, e.g., ∆FN2O might be the difference
between the FN2O of a mitigation treatment (FN2O-mitigated) and the FN2O of a control
treatment (FN
2O-control). FN2O measurement ability depends on the measurement pre-10
cision for each of the two variables that multiply to giveFN
2O,∆N2O andCTr (Eq. 4).
A carefully designed experimental plot configuration will ensure that plots are subject to similar turbulence regimes so that there are no systematic differences inCTr between
treatments. Hence, treatment effects on FN
2O will be detected by measuring inter-plot
differences in the N2O gradient,∆N2O. Accordingly, we first evaluate the performance 15
of the FS-NOMAS in assessing mitigation efficacy by examining how the resolution of the N2O measurement affected the resolution of a single instantaneous plot compari-son, ignoring the contribution to flux uncertainty from uncertainty inCTr (Sect. 4.1.1).
We then extend the analysis to incorporate errors in theCTr measurement and make
a more comprehensive evaluation of performance of the FS-NOMAS in determining
20
differences in cumulative fluxes (Sect. 4.1.2).
4.1.1 The level of mitigation efficacy that is detectable for a single comparison of plots
The ability of the FS-NOMAS to detect a mitigation effect can be evaluated by consider-ing the difference between N2O gradients measured on consecutive samples, denoted 25
here as∆∆N2O (when the values ofCTrare similar). We define mitigation efficacy as:
AMTD
6, 8959–9003, 2013Quantifying nitrous oxide mitigation
efficacy
A. M. S. McMillan et al.
Title Page
Abstract Introduction
Conclusions References
Tables Figures
◭ ◮
◭ ◮
Back Close
Full Screen / Esc
Printer-friendly Version
Interactive Discussion
Discussion
P
a
per
|
D
iscussion
P
a
per
|
Discussion
P
a
per
|
Discuss
ion
P
a
per
|
With the assumption that:CTr-control=CTr-mitigated it is apparent that the ability to mea-sureMeff is entirely dependent on the ability to measure a difference between the two
consecutive∆N2O values, referred to here as∆∆N2O.
If ∆∆N2O= ∆N2O-control−∆N2O-mitigated, and the errors of each are equal, then the
uncertainty of ∆∆N2O is
h
2SE∆N2O 2i1/2
. Assuming that our error of each individual
5
∆N2O measurement (SE∆N
2O) is 0.023 ppb, then the propagated error of SE∆N2O for
the difference in gradients, SE∆∆N2O=0.033 ppb. While this neglects uncertainty in the
error in determining the transfer coefficient, CTr, it quantifies the limits to precision in
theFN
2O measurement originating from the∆N2O measurement alone.
For the difference in gradients to be statistically significant, ∆∆N2O would need to 10
exceed SE∆∆N2O by a factor of 1.648, which is the critical one tailed Student’st value
at 450 degrees of freedom and P<0.05. Therefore, the minimum significant gradi-ent difference that we expect to be able to measure is∆∆N2O=0.033 ppb×1.648=
0.054 ppb.
From Eq. (4) and a median value for CTr of 4 molAirm−2s−1 (Fig. 6a) we
calcu-15
lated that the flux difference FN2O corresponding to a ∆∆N2O of 0.054 ppb would be
26.4 µg N2O-N m− 2
h−1. We can compare this value of minimum detectable FN2O to
typical values of FN2O from intensively managed pasture. In intensively farmed dairy
pasture in New Zealand, typical values range from 50 to 200 µg N2O-N m−2h−1in the several days following grazing when the bulk of N2O is emitted (De Klein et al., 2003). 20
If we assume an average flux of 100 µg N2O-N m− 2
h−1 for around 20 days following grazing, then the ability to detect a FN2O of 26.4 µg N2O-N m−
2
h−1 indicated that the FS-NOMAS is able to detect a mitigation effect of∼26 %.
4.1.2 The level of mitigation efficacy that is detectable for cumulative emissions
The analysis above examines how the precision of the gradient determination
cor-25
AMTD
6, 8959–9003, 2013Quantifying nitrous oxide mitigation
efficacy
A. M. S. McMillan et al.
Title Page
Abstract Introduction
Conclusions References
Tables Figures
◭ ◮
◭ ◮
Back Close
Full Screen / Esc
Printer-friendly Version
Interactive Discussion
Discussion
P
a
per
|
D
iscussion
P
a
per
|
Discussion
P
a
per
|
Discuss
ion
P
a
per
|
practice, an experimental campaign can extend over several weeks or months so that cumulative emissions can be quantified and emission factors be calculated. Rules of error propagation mean that the relative error of the cumulative flux becomes smaller as the time series of flux measurements becomes longer. The cumulative flux, on av-erage, will be proportional ton, the number of individual samplings, while the error on
5
the cumulative flux will be proportional to√n. Below we examine how the precision of the gradient measurement affects how well cumulative emissions are measured, using standard rules of error propagation.
We used data collected from a measurement period where differences in cumulative emissions occurred. This period was between 7 October and 30 November in 2010
10
during the Spring Experiment where the effects of increased nitrogen fertiliser and a granular form of dicyandiamide on N2O emission were studied. Grazing and nitrogen addition had occurred on 12 October and a 20 min flux measurement was obtained from each plot approximately every 80 min. An error was calculated for each flux mea-surement from the square root of the sum of squares (SRSS) of the component errors
15
of the flux calculation:
SEFN2O(20 min)=FN2O(20 min)
v u u u t h
SE∆N2O
i
20 min 2
∆N2O +
SECTr
20 min 2
CTr (13)
Where [SE∆N2O]20 min was the individual SE∆N2O for each 20 min period (Eq. 2) and
[SECTr]20 min was 0.12, which was the average relative error for the transfer coefficient
over the entire study, calculated from a detailed error analysis for this term (Mukherjee,
20
2013).
We aggregated the data to 4 h intervals so that we had valid observations for at least one control plot and each treatment plot. The fluxes were log-normally distributed so geometric means were used as the measure of central tendency within each in-terval. Errors in the fluxes for the 4 h interval were calculated from the SRSS of the
25
individual 20 min SEF
AMTD
6, 8959–9003, 2013Quantifying nitrous oxide mitigation
efficacy
A. M. S. McMillan et al.
Title Page
Abstract Introduction
Conclusions References
Tables Figures
◭ ◮
◭ ◮
Back Close
Full Screen / Esc
Printer-friendly Version
Interactive Discussion
Discussion
P
a
per
|
D
iscussion
P
a
per
|
Discussion
P
a
per
|
Discuss
ion
P
a
per
|
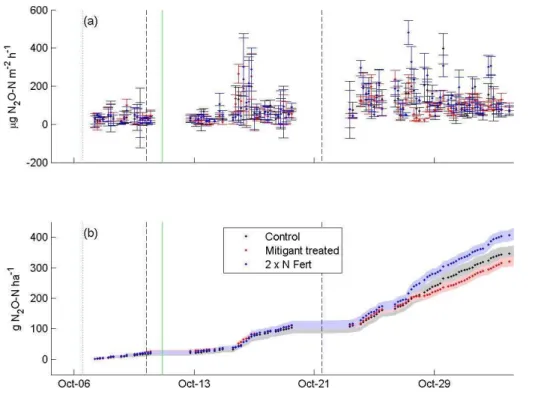
the magnitude of the fluxes, indicating that evaluating mitigation efficacy during short intervals is difficult (Fig. 9a).
The cumulative fluxes and associated errors provide a clearer indication of the ability of the FS-NOMAS to detect an effect of the field treatments (Fig. 9b). Cumulative fluxes were from the 4 hourly fluxes (to ensure equal numbers of observations from each plot).
5
Cumulative errors were calculated at each time step from the SRSS of the current and all previous errors.
For the purpose of this analysis, which is to compare the magnitude of cumulative flux with cumulative flux error, we ignored the contribution to uncertainty from periods when no measurements were available (36 % of the time in this case). We assume
10
that errors from such periods were representative of sampled periods and that their magnitude relative to that of the cumulative flux would also be similar to that of sampled periods. However we note that the absolute value of the cumulative flux over this period would need to be adjusted to account for data gaps.
Having acknowledged that this analysis is restricted only to the 110 4 hourly
inter-15
vals when at least one flux from each type of treatment plot was observed, we can now compare the magnitude of the cumulative fluxes with their corresponding errors. The cumulative sum of N2O fluxes were 401±26 g N2O-N ha−
1
from the control plot, 368±16 g N2O-N ha−
1
from the mitigant-treated plot and 468±20 g N2O-N ha− 1
from the double-N plot (Fig. 9b).
20
Compared to the control plot, the cumulative emissions from the mitigant-treated plot were 8.3 % smaller, but this difference was not significant at the 95 % level of confidence. However, the cumulative analysis does show consistently larger emission from the control plot over a period of 1 week at the end of the period presented. In contrast, the cumulative emissions from the double-N plot were 18.4 % higher and this
25
difference was significant (at the 95 % level of confidence).
Given that the cumulative fluxes from the control plot were 401 g N2O-N ha− 1
AMTD
6, 8959–9003, 2013Quantifying nitrous oxide mitigation
efficacy
A. M. S. McMillan et al.
Title Page
Abstract Introduction
Conclusions References
Tables Figures
◭ ◮
◭ ◮
Back Close
Full Screen / Esc
Printer-friendly Version
Interactive Discussion
Discussion
P
a
per
|
D
iscussion
P
a
per
|
Discussion
P
a
per
|
Discuss
ion
P
a
per
|
assume that this is a typical error, than the standard error of the difference between two fluxes with errors of this magnitude would be SE∆N
2O=
h
2×262i1/2=36.6 g N2 O-N ha−1. For a flux difference∆FN
2Oto be statistically significant, it must be a factor oftcrit
greater than SE∆N2O. Here,tcritis 1.97 (P>0.05, degrees of freedom=218). Therefore
the minimum measurable flux difference is tcrit×SE∆N2O=72.2 g N2O-N ha− 1
. This is
5
18 % of the control plot flux. This minimum measurable difference was persistently exceeded by the differences between the double N treatment and the control treatment from 23 days after the N application onwards. However, in the same time period, the minimum measureable difference was not exceeded by the differences between the mitigant-treated treatment plot and the control treatment.
10
We recognise that propagating error along time series is potentially problematic due to a lack of independence between consecutive samples. An alternative approach to estimating the cumulative error would entail a comprehensive modelling of the sources of variability (including serial correlation). Such an approach would introduce new un-certainties because it would involve choosing and parameterising a model, and
interpo-15
lation of the incomplete time series. The main uncertainty in the approach undertaken here – that cumulative error might be underestimated due to autocorrelation of the data – has the possible effect that small but persistent field treatment effects would take longer to become detectable.
In both approaches to assessing the resolution of the technique, the quantification
20
of diffusivity involves uncertainty. This uncertainty is due to possible error in the as-sumptions of equal diffusivities in heat, momentum and gas under neutral conditions and how the differences in these terms is parameterised under non-neutral conditions. Fortunately, the errors are unlikely to vary systematically with the effectiveness of a mit-igation strategy, which will be focused on reducing the rate of N2O production in the soil,
25
AMTD
6, 8959–9003, 2013Quantifying nitrous oxide mitigation
efficacy
A. M. S. McMillan et al.
Title Page
Abstract Introduction
Conclusions References
Tables Figures
◭ ◮
◭ ◮
Back Close
Full Screen / Esc
Printer-friendly Version
Interactive Discussion
Discussion
P
a
per
|
D
iscussion
P
a
per
|
Discussion
P
a
per
|
Discuss
ion
P
a
per
|
4.2 How would the technique perform in a field-scale version of a previously reported N2O mitigation study?
Having assessed the ability of the FS-NOMAS to detect differences between plots in a study where the field treatment effect was small, we now assess its hypothetical performance in a previously reported experiment where the mitigation effect was
com-5
paratively large. We refer to the study by Di and Cameron (2006), but scaled to the field. In their study, N2O emissions were measured from intact soil columns contained in lysimeters. The soil type used in this study was similar to that of the current study (Lismore Silt Loam) and N2O emissions were measured by static chambers following
amendment with cattle urine, urea and, in one treatment, an application of 10 kg ha−1
10
of DCD. This study aimed to quantify the emissions from a recent urine patch and concluded that DCD application at this rate and on this soil type resulted in a Meff of
70 %.
The absolute N2O emissions from the (Di and Cameron, 2006) study have been digi-tised from the original paper and scaled to a whole field, assuming that urine patches
15
cover 2 % of the surface (Moir et al., 2011) and the remaining 98 % of the surface emits 10 µg N2O-N m−2h−1. It is assumed here that DCD would be equally effective on the emissions from urine patches and the other 98 % of the field (non-urine patch area). Over the entire period of measurements, the background emissions accounted for 32 % (control treatment) and 43 % (DCD treatment) of cumulative emissions. The time series
20
of field-scale N2O fluxes that the FS-NOMAS would be required to measure is given
in Fig. 10a. The difference in these fluxes (∆FN2O) between the treated and untreated
plots is shown in Fig. 10b.
As discussed earlier, the smallest detectable flux difference for the FS-NOMAS depends on the extent of atmospheric mixing. The minimum resolvable gradient
25
(∆N2OMinRes) is associated with higher fluxes under well mixed conditions (high CTr) than under stable conditions (low CTr). The horizontal lines in Fig. 10b indicated the
AMTD
6, 8959–9003, 2013Quantifying nitrous oxide mitigation
efficacy
A. M. S. McMillan et al.
Title Page
Abstract Introduction
Conclusions References
Tables Figures
◭ ◮
◭ ◮
Back Close
Full Screen / Esc
Printer-friendly Version
Interactive Discussion
Discussion
P
a
per
|
D
iscussion
P
a
per
|
Discussion
P
a
per
|
Discuss
ion
P
a
per
|
are the 50th, 75th and 95th percentile of CTr. At the very largest values of CTr, only the largest differences between the treatments would be measurable. At the 95th per-centile whereCTr=10.2 molAirm−
2
s−1, the FS-NOMAS could only detect differences in excess of 56.2 µg N2O-N m−
2
h−1. At the 75th percentile whereCTr=6.3 molAirm− 2
s−1, only differences in excess of 34.4 µg N2O-N m−2h−1 could be detected. The median
5
(50th percentile) value ofCTrwas 4.8 molAirm−2s−1which would mean that differences above 26.4 µg N2O-N m−
2
h−1could be detected.
Finally we generate a new data set, based on the chamber flux data of Di and Cameron (2006), but with measurement error characteristics and a sampling rate sim-ilar to that of the FS-NOMAS. The Di and Cameron (2006) data were interpolated to
10
a four-hour sampling interval and standard errors for each interval were calculated by repeated random sampling of the propagated errors of the four-hourly fluxes col-lected during the trials of the FS-NOMAS described above Sect. 4.1.2. The time series of the random errors were propagated through time in the same way as described in Sect. 4.1.2 so that the cumulative error can be compared to the magnitude of the
15
cumulative fluxes. The results of this analysis indicated that the effect of the mitiga-tion treatment observed in the Di and Cameron (2006) experiment would have been clearly resolved by the FS-NOMAS. Cumulative fluxes were 604±28 g-N2O-N ha−1 from the control plot and 224±12 g-N2O-N ha−1from the mitigated plot. According to this method of error propagation, significant differences between the treatments would
20
have been detectable with the FS-NOMAS within the first week of measurements.
4.3 Flux footprint as a source of uncertainty
The reliability of field-scale (micrometeorological) approaches for mitigation assess-ment is also dependent on the extent to which the measured gradients were affected by fluxes from outside the area of interest, namely the 100 m×155 m plot immediately
25
AMTD
6, 8959–9003, 2013Quantifying nitrous oxide mitigation
efficacy
A. M. S. McMillan et al.
Title Page
Abstract Introduction
Conclusions References
Tables Figures
◭ ◮
◭ ◮
Back Close
Full Screen / Esc
Printer-friendly Version
Interactive Discussion
Discussion
P
a
per
|
D
iscussion
P
a
per
|
Discussion
P
a
per
|
Discuss
ion
P
a
per
|
and Unsworth, 1990). However, under stable conditions the source area can be con-siderably longer and gradients measured at a particular mast may be contaminated with fluxes originating from the areas outside of the plot immediately adjacent to the mast. We used a spreadsheet implementation (Neftel et al., 2008) of a well-established analytical footprint model (Kormann and Meixner, 2001) to assess the importance of
5
this issue. This analysis indicated that gradients measured at the masts were predom-inantly affected by fluxes that originated from within the immediately upwind plot, and only 4.3 % of the cumulative flux originated from fluxes occurring outside of this area (Mukherjee, 2013).
4.4 Reconciling measurements at different scales
10
The high rate of N2O flux from excreta patches is responsible for the patchy nature of N2O emissions. Because the spatial scale of this variability is similar to that of
a static flux chamber, it is difficult to obtain representative sampling when randomly placing replicate chambers within different treatment plots. For this reason, the major-ity of chamber sampling experiments to determine mitigation efficacy in New Zealand
15
grazing systems are made on replicated experimental plots where inputs of nitrogen are controlled to simulate natural urine or dung events (Gillingham et al., 2012). Both the excreta-treated and untreated plots are then subjected to the mitigation treatment. Results from studies that use this experimental design have been used to support the New Zealand’s successful application to the United Nations Framework Convention on
20
Climate Change (NZFCCC) to claim emissions reduction for the use of nitrification in-hibitors within its national greenhouse gas inventory (Clough et al., 2007). However, the upscaling of emissions measured at this scale to an estimate at the field scale is com-plicated because of uncertainties regarding the quantity and evenness of excreta-N distribution and differences between the implementation of the mitigation at the
exper-25
imental scale versus the management relevant field scale.