Nitrous oxide emissions in agricultural soils: a review
1Diana Signor2, Carlos Eduardo Pellegrino Cerri3
INTRODUCTION
Life on Earth depends on a temperature range controlled by the greenhouse effect. Changes in the concentration of greenhouse gases (GHG), mainly carbon dioxide (CO2), methane (CH4) and nitrous oxide (N2O), have occurred in the past years and have been related to the increase in global temperature. Among those gases, N2O is of great importance because it can stand in the atmosphere for more than 114 years and has a warming potential 298 times greater than CO2.
ABSTRACT
RESUMO
Global N2O emissions reach about 17.7 Tg of N per year, being 6.7 Tg (37.8%) from anthropic sources. Agricultural soils share 2.8 Tg of N per year, i.e., 15.3% of the total amount of emissions, or 41.8% of anthropic emissions (Denmanet al. 2007). According to the second Brazilian GHG inventory, N2O emissions were about 576 Gg, in 2005, i.e., 7.7% of the national emissions, which reached 2,200 Tg of CO2-eq (Brasil 2010). The agriculture sector was responsible for about 87.2% of N2O emissions, mainly from animal waste management and agricultural soils (Cerriet al.2009).
1. Article received in Aug./2012 and accepted for publication in Jul./2013 (Registration number: PAT 19871)
2. Empresa Brasileira de Pesquisa Agropecuária (Embrapa Semiárido), Petrolina, PE, Brasil. E-mail: [email protected]. 3. Universidade de São Paulo (USP), Escola Superior de Agricultura “Luiz de Queiroz”, Departamento de Ciência do Solo,
The greenhouse gases concentration in the atmosphere
have significantly increased since the beginning of the Industrial
Revolution. The most important greenhouse gases are CO2, CH4 and N2O, with CH4 and N2O presenting global warming potentials 25 and 298 times higher than CO2, respectively. Most of the N2O emissions take place in soils and are related with agricultural activities. So, this review article aimed at presenting the mechanisms of N2O formation and emission in agricultural soils, as well as gathering and discussing information on how soil management practices may be used to reduce such emissions. The N2O formation in the soil occurs mainly
through nitrification and denitrification processes, which are influenced by soil moisture, temperature, oxygen concentration,
amount of available organic carbon and nitrogen and soil C/N ratio. Among these factors, those related to soil could be easily altered by management practices. Therefore, understanding the processes of N2O formation in soils and the factors influencing
these emissions is fundamental to develop efficient strategies to
reduce N2O emissions in agricultural soils.
KEY-WORDS: Greenhouse gases emission; nitrification;
denitrification.
Emissões de óxido nitroso em solos agrícolas: uma revisão A concentração atmosférica de gases do efeito estufa tem
aumentado de forma significativa, desde o início da Revolução
Industrial. Dentre os principais gases estão o CO2, CH4 e N2O, sendo que o CH4 e N2O apresentam 25 e 298 vezes maior potencial de aquecimento global que o CO2. Grande parte das emissões de N2O ocorre nos solos e está relacionada a atividades agrícolas. Neste sentido, esta revisão objetivou apresentar os mecanismos de formação e emissão de N2O em solos agrícolas e reunir e discutir informações sobre como as práticas de manejo do solo podem ser usadas para reduzir tais emissões. A formação de N2O no solo se dá,
principalmente, pelos processos de nitrificação e desnitrificação, que são influenciados por fatores como umidade, temperatura,
presença de oxigênio, teores disponíveis de carbono orgânico e de nitrogênio e relação C/N do solo. Dentre estes fatores, aqueles relacionados ao solo podem facilmente ser alterados por práticas de manejo. Portanto, conhecer os processos de formação do N2O nos solos e compreender os fatores que alteram as emissões é
fundamental para que sejam desenvolvidas medidas eficientes de
redução das emissões de N2O em solos agrícolas.
PALAVRAS-CHAVE: Emissão de gases do efeito estufa;
nitrificação; desnitrificação.
If we consider the importance of N2O as a GHG and how much agricultural soils contribute to originate it, the development of strategies to decrease N2O in the atmosphere should necessarily include agricultural practices. So, this review article aimed at presenting the mechanisms of N2O formation and emission in agricultural soils, as well as gathering and discussing information on how soil management practices may be used to reduce such emissions.
ATMOSPHERE AND GREENHOUSE EFFECT
The Earth’s atmosphere is basically composed by nitrogen (N2) (78%) and oxygen (O2) (21%) (Le Treut et al. 2007). One third of the solar radiation that intercepts the outer atmosphere is bounced back to space. The remaining two thirds pass through the atmosphere and are absorbed by the Earth’s surface and by the atmosphere itself. Then, the surface emits back longwave radiation in the form of infrared rays. A great amount of this energy is absorbed by the atmosphere and re-emitted to the Earth’s surface. This process is known as greenhouse effect and, without this mechanism, the Earth’s surface temperature would be below the water freezing point and life as we know would not exist (Le Treutet al.2007).
Water vapor and CO2 are the most important GHG, but other gases such as CH4, N2O, ozone, halocarbons and aerosol can also increase the atmosphere temperature (Le Treutet al. 2007). Although water vapor is the main GHG in the atmosphere, it is little affected by human activities (Forsteret al. 2007), while CO2, CH4 and N2O are greatly influenced by them. Thus, these three gases are considered the most important ones related to the greenhouse effect.
Each GHG absorbs the infrared radiation and re-emits it as heat, increasing the atmosphere temperature, what is called global warming potential (GWP). The GWP is characteristic of each gas (Snyderet al. 2009) and is assigned as a function of its life time in the atmosphere and rated in relation to CO2, since this is the most abundant GHG in the atmosphere. Therefore, considering a time horizon of 100 years, CH4 has a life time of 12 years and a GWP of 25 and N2O has a life time of 114 years and a GWP of 298 (Forster et al. 2007).
The atmospheric CO2 concentration was about 280 ppm (parts per million), until 1750 (Industrial Revolution), and increased to 380 ppm, in 2005. This increase was mainly caused by fossil fuels burning,
cement industry and deforestation. Emissions of CH4 result from fossil fuel combustion, biomass burning,
paddy fields, landfill and cattle breeding (Denman
et al. 2007, Forster et al. 2007). The concentration of CH4 in the atmosphere has ranged between 400 ppb (parts per billion), during glacial periods, and 700 ppb, during interglacial periods, while present day concentrations reach 1,774 ppb (Denmanet al. 2007, Forsteret al. 2007).
The N2O concentration in the atmosphere increased (Denmanet al. 2007, Forsteret al. 2007, Le Treutet al. 2007) from 270 ppb, during the pre-industrial period, up to 319 ppb, in 2005 (IPCC 2007). The main sources of N2O are the application of N-fertilizers on soil, fossil fuel combustion and some natural mechanisms that occur in terrestrial and aquatic ecosystems. The annual increase rate varies from 0.2% to 0.3%.
Table 1 shows the main sources of N2O in the world, during the 1990 decade, discriminating anthropic and natural sources. Almost 38% of the global emissions were related to anthropic sources, and agriculture is the main component, with 15.82% of global emissions. In Brazil, N2O emissions from agricultural soils were estimated in 457 Gg, in 2005 (Brasil 2010). Thus, any strategy that aims at decreasing the GHG atmospheric concentration has to focus on the agricultural sector, because this is the main source of N2O. Moreover, the reduction of N lost to the atmosphere as N2O can increase the N use
efficiency, as it increases the amount of N available
to plants, increasing crop yields.
NITROUS OXIDE
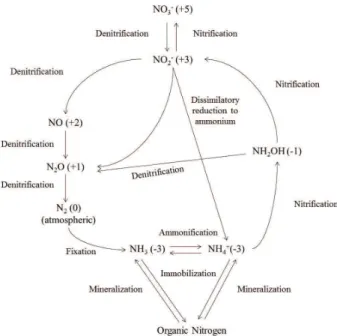
The nitrogen cycle is presented in Figure 1. Atmospheric N2 is fixed into ammonia (NH3) by free-living and symbiotic bacteria and archaea (diazotrophs), using the nitrogenase enzyme, the universal catalyst, to break the N2 triple bond. In soil, NH3 can be converted into ammonium ion (NH4+), which can be oxidized to nitrate ion (NO3-), in a
three-step process called nitrification. Nitrite (NO2-) and NO3- ions are generated during nitrification
and they may be reduced during the denitrification
process, that is the stepwise reduction of NO3- to N 2 by four enzymes, generating intermediate products: NO2-, NO and N
2O. During the NO3
- ammonification
to NH4+, via NO 2
-, it can also occur NO 3
- reduction,
Table 1. Main sources of N2O to the atmosphere.
*Denman et al. (2007); ** Brasil (2010).
Source N-N2O (Tg N year
-1)
World (1990)* Brazil (1990)** Brazil (2005)** Anthropic
Fossil fuel combustion and industrial processes 0.700 0.009 0.020
Agriculture 2.800 0.210 0.310
Land use change and forests - 0.009 0.010
Others 3.200 0.006 0.009
Total anthropic sources 6.700 0.230 0.350
Natural
Soils under native vegetation 6.600
Oceans 3.800
Lightning bolts
-Atmospheric chemistry 0.600
Total natural sources 11.000
Total 17.700
Figure 1. Nitrogen cycle. The oxidation states of N are given in parentheses and the name of processes are indicated.
SYNTHESIS OF N2O IN THE SOIL
Several concurrent processes are responsible for nitrogen gases emissions in agricultural soils (Bockman & Olfs 1998, Stevens & Laughlin 1998). Most of the N2O is produced through the biological processes of nitrification and denitrification. Autotrophic aerobic nitrification (by ammonia-oxidizing bacteria and nitrite-ammonia-oxidizing bacteria) and
anaerobic denitrification, mediated by denitrifying
bacteria, are the main microbial processes in the
nitrogen cycle in the soil. Other microorganisms are
involved in nitrification and denitrification processes:
anammox bacteria can convert NH4+ and NO 2
- into
N2, under anaerobic conditions, while some fungi can produce N2 and N2O by denitrification and
codenitrification, and archeae mediate nitrification
in marine ecosystems and are capable of promoting
denitrification in soils (Hayatsu et al. 2008)
A small fraction of N2O is produced in non-biological processes: the chemical decom-position of nitrite (chemidenitrification) and hydroxylamine oxidation (NH2OH) (Bremner
1997). Chemidenitrification is the decomposition of
NO2- that occurs in neutral and acidic soils, causing
volatilization and fixation of NO2- in the soil organic matter (Bremner et al. 1980, Bremner 1997). The amount of N2O produced this way is almost negligible (Bremner et al. 1980, Bremner 1997). Hydroxylamine is an intermediate compound in the oxidation of NH4+ to NO3- that can produce much more N
2O than the
chemidenitrification process (Bremner 1997). In
neutral and acidic soils, N2O is the main product of the NH2OH oxidation, due to its reaction with Mn and Fe, while in calcareous soils (pH from 7.8 to 8.2) the NH2OH reacts with CaCO3 and the main product is N2 (Bremner et al. 1980).
Nitrification and denitrification processes are further discussed, since they are the most important ones to the N2O formation in soils.
to NO2- by Nitrosomonas sp., Nitrosospira sp. and
Nitrosococcus sp.; and nitratation, in which the NO2 -is oxidized to NO3- by Nitrobacter sp., Nitrosospira sp. and Nitrococcus sp. (Moreira & Siqueira 2006).
In general, nitrification can be summarized by the
following reactions: nitritation: 2NH4+ + 3O 2 → 2NO2- + H
2O + 4H
+ + energy; nitratation: 2NO 2
- +
O2 → 2NO3- + energy. During this process, the NO
2
-concentration increases as NH4+ is being oxidized and then decreases as NO3- is being formed.
Denitrification is the reduction process of NO3
-to N2, mediated by facultative anaerobic bacteria, which correspond to 0.1-5.0% of the total bacteria population in the soil (Moreira & Siqueira 2006). This process can be complete, resulting in N2, or can be incomplete, and a variable fraction of N can be emitted as NO and N2O (Figure 1).
Despite denitrification is responsible for the
most part of the N2O produced in the soil, nitrification can also produce N2O, when O2 is limited. Bremner (1997) presented results from many researches which showed that nitrifying microorganisms can significantly contribute to N2O emissions from soils. According to this author, the N2O production
during nitrification is increased when the soil pH and
organic matter content increase and with increase in
soil moisture (from air dried to field capacity) and in soil temperature (5-40ºC), by addition of nitrifiable
N forms, animal manures and plant residues. N2O
produced by nitrification can be decreased when nitrification inhibitors are used.
Under anaerobic condition, the concentration of NO2-, which is a toxic compost, increases in the soil (Khalilet al. 2004), and it may be alternatively used
by the nitrifying microorganisms as an electron final
acceptor, resulting in N2O and NO during nitrification (Snyderet al. 2009), as it follows:
NH4+ → NO
2
- → NO
3
↓
NO → N2O → N2
Synthesis and emission of N2O by microbial processes result from complexes interactions among several factors, such as soil temperature, texture, structure and pH, availability of N, decomposable organic material and water (Bockman & Olfs 1998). Crop rotation, soil mobilization, N sources and rates, time and depth of N application interact
and significantly influence the N2O emission by
the soil (Liu et al. 2006, Tan et al. 2009, Signor et al. 2013).
FACTORS INFLUENCING N2O PRODUCTION
BY NITRIFICATION AND DENITRIFICATION
Despite the importance of N (NH4+ and NO 3
-)
to nitrification and denitrification reactions, these processes are also influenced by soil characteristics,
such as aeration, compaction, temperature, moisture, pH, organic matter, available N, C/N ratio, texture and also by soil management and crop rotation (Bremner 1997, Brentrup et al. 2000, Snyder et al.
2009). The main factors influencing emissions of N2O
from nitrification are temperature and soil density
(Davidson & Swank 1986). On the other hand, emissions of N2O from denitrification are mainly
influenced by the amount of water filled pores space
(WFPS).
Nitrification is strictly aerobic: NH4+ and NO2- oxidation are strongly diminished when the O
2 concentration is low (Khalilet al. 2004). Although
denitrification is an anaerobic process, Khalil et al. (2004) observed that it can occur even at high O2 pressure, because anaerobic conditions intra-aggregates are common in arable soils, what reduces
the nitrification rate and increases the share of N
emitted as N2O. In general, under aerobic or semi-aerobic conditions, N2O is produced by nitrifying microorganisms, while under anaerobic conditions it is produced by denitrifying microorganisms (Bremner 1997, Stevens et al. 1997, Khalilet al. 2004).
Akiyamaet al.(2000) observed a decrease in the amount of NH4+ and increase in NO
3
- in the soil,
during the N2O peak of emission. As NO3- is being produced while NH4+ is being consumed, then the
nitrification process is occurring and thus it was the
main source of N2O. Khalilet al. (2004) observed that N2O emissions achieved a steady state when the
nitrification also kept steady and NO3- concentration was minimal.
Temperature, moisture and aeration
Temperature and moisture are of great importance for nitrification and denitrification, because they determine the activity of microorganisms. Moreover, soil temperature and moisture strongly
influence not only the N2O production but also its
1986). Under mild temperatures, the rate of nitrogen conversion is small, increasing as temperature increases (Akiyamaet al.2000, Brentrup et al. 2000, Hao et al.2001). However, in a wider range, N2O emissions exponentially increase with increasing soil temperatures (0-50ºC) (Liuet al.2011). This explains the existence of a close relationship among seasonal variation of N2O flux and soil and air temperatures (Wolf & Brumme 2002, Zhang & Han 2008). It is important to highlight the positive feedback between
temperature and denitrification rate: increasing soil
temperatures stimulate soil respiration (microbial activity), also increasing anaerobic sites in which
denitrification can take place.
In general, the greater the soil moisture, the greater will be the N2O emission (Baggset al.2000, Giacominiet al.2006), because both the nitrification and denitrification processes are influenced by moisture (Davidson & Swank 1986). However, under very high moisture contents, the N2O production decreases, but when there are moisture alternations, with successive moist and dry periods, the N2O emissions increase (Brentrup et al. 2000). This occurs because the soil water content increases microbial activity, but, under very high moistures, the microbial activity is inhibited.
Liu et al. (2011) showed that N2O emissions initially increased and then decreased with increasing soil moisture. Perdomo et al. (2009) observed the largest N2O flux after rain or during periods of high soil temperature. Liu et al. (2006) related large emissions of N2O to rain or irrigation events and
affirmed that the N2O diffusion from soil to the
atmosphere markedly increased just after rain, going back to normal after three days.
The expression of the genes encoding the enzymes that produce and consume N2O is regulated by environmental signals, typically by low oxygen concentrations (Thomson et al. 2012). According to Brentrup et al. (2000), when the soil aeration is lower, N2 is the main nitrogen gas emitted to the atmosphere. Soil aeration has a close relationship with soil moisture. The greater the WFPS, the smaller
the number of soil pores filled with air, enhancing
N2O produced by denitrification. The amount of
WFPS is also positively correlated with available
carbon, nitrification potential and mineralization potential, confirming the importance of moisture
to microbial activities and to reactions that produce N2O in the soil (Davidson & Swank 1986). However,
very high water content in the soil decreases N2O emissions (Liuet al.2011). A general assumption is that the formation of N2O in soils is benefited when the WFPS reaches approximately 80% (Bockman & Olfs 1998, Denmeadet al.2010).
Denitrification is the main source of N2O in
WFPS higher than 70%, but nitrification is the main
process when the WFPS decreases to 60% (Ruser et al. 2006). Nevertheless, it is important to highlight that being the main process is not the same thing as having the higher emission rates.
Relief position
N2O emissions may be influenced also by the
relief position, since it affects other factors involved in the N2O emissions, such as moisture dispersion, C organic content and soil fertility. The low relief areas tend to be more humid and to have greater organic matter content, when compared to higher lands. Therefore, microorganism respiration and oxygen consumption
are potentially greater, influencing the N2O production in low lands (Davidson & Swank 1986).
Soil characteristics
The proportion of N2O in the total flux of N
gases emitted from soils is also influenced by soil type
(Stevens & Laughlin 1998). Clayey soils tend to show greater N2O emissions than sandy soils (Brentrup et al. 2000), and N management may increase the emission of N2O, particularly in soils of fine texture and without mobilization before seeding (Chenet al. 2008, Tanet al. 2009).
N2O emissions induced by soil management practices and by rain were four times greater in a clay loam soil than in a loamy sand (Tanet al.2009). In the clayey soil, the small amount of macropores would increase anaerobic microsites, also increasing N2O emissions. Neill et al. (2005) reported that emissions in sandy soils occur with greater soil moisture than that necessary for similar emissions in a clayey soil.
Denitrification enzymes require a variety of metal cofactors, including Mo, Fe, Cu and Zn. The absolute requirement of nitrous oxide redutase (enzyme that reduces N2O to N2) for Cu accounts
to the critical role of this element in denitrification.
Soil pH is another important factor influencing
N2O emissions, because nitrous oxide redutase is inhibited by low pH and in the presence of O2.
Generally, if denitrification is the main source of N2O, higher pH values decrease the soil N2O emissions, but
if nitrification is the main process of N2O production, then an increase in the soil pH stimulates the N2O production.
According to Bremner (1997), the production of N2O by denitrification is favored by high concentrations of NO3- and low pH in incubated soils. For low pH values, the emission of N2O would be greater, because a small amount of this gas would be reduced to N2 (Chapuis-Lardyet al. 2007).
Knowles (1982) affirmed that in soils with pH of
4.0, N2O is the main product of denitrification. The increase in one unit of pH may decrease 0.2 units in the molar fraction of the N2O emitted (Stevens &
Laughlin 1998). Thus, the continuing acidification of
agricultural soils through excessive use of nitrogen fertilizers could drastically enhance N2O emissions, while the careful adjustment of soil pH by liming would reduce emissions (Thomsonet al.2012). The
nitrification process (aerobic) tends to reduce the soil pH, while the denitrification (anaerobic) can increase
the soil pH (Khalilet al. 2004).
Available carbon
Increasing the soil organic C content can increase the N2O production (Brentrup et al. 2000). Furthermore, the soil moisture and soluble C content
show a significant correlation with N2O emissions,
during residue decomposition (Ciampittiet al. 2008).
Available C influences nitrification and denitrification
reactions (Bremner 1997), because it can stimulate microbial growth and activity, and also provide the
organic carbon needed by soil denitrifiers (Cameron
et al. 2013). Additionally, microbial growth increases the consumption of O2 and generates anaerobic
conditions necessary for denitrification.
In Amazonian soils, peaks of N2O emission occurred after the input of plant residues (Passianoto et al.2003) and after the addition of labile carbon (dextrose) to soil (Carmo et al. 2005). However, the effect of organic matter depends on the degree of anaerobic conditions created by microbial metabolism (Stevens & Laughlin 1998). When moisture and N availability are not limiting to N2O
production, greater fluxes are observed in soils with
high amounts of available organic carbon (Ruseret al. 2006).
C/N ratio
Nitrogen transformations in soils include two important biological processes: immobilization (or assimilation), that is the uptake of nitrogen by microorganisms and its conversion into organic
nitrogen, and mineralization (or ammonification),
that is the conversion of organic nitrogen to NH3 (Figure 1). The balance between mineralization and immobilization depends on the soil C/N ratio and cultural residues added. Soil and residues with a small C/N ratio (lower than 30/1) present a dominance of mineralization over the immobilization, and the available N can be absorbed by plants or used in microbial processes.
The presence of straw with high C/N ratio on the soil surface may increase the immobilization of the N fertilizer applied (Baggs et al. 2000),
and thus decrease the denitrification reactions and
N2O emissions. When no straw, or straw with a small C/N ratio, is present in the soil surface, the N immobilization probably will not occur, more N
will be available for nitrification and denitrification
processes and higher N2O emissions may occur (Baggset al.2000).
Interaction of factors to explain N2O emissions in soils
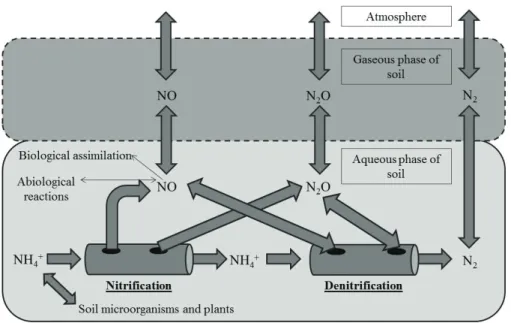
The model proposed by Firestone & Davidson (1989) satisfactorily represents the interactions and the control level of many factors involved in N2O emissions in the soil. Also known as “hole-in-the-pipe”,
the model summarizes the influence of microbiological
and ecological factors on NO and N2O emissions by soils (Figure 2), suggesting that the production of NO and N2O are related to available N in the soil.
The rate of N flowing through the pipe is
the first level of control of NO and N2O emissions
and roughly represents the N cycling in the system. Amounts of NO and N2O lost by the holes in the pipe are the second level of emission control, and are mainly related to soil moisture. The emissions of such gases depend on the balance among production, consumption and diffusive transport in soils.
In dry and well aerated soils, nitrification is
allowing a greater emission of the more oxidized form (NO), before it would be consumed in other processes. In moist soils, the rate of gas diffusion and aeration are smaller, and greater amount of NO would react before being released to the atmosphere. In such condition, the more reduced oxide (N2O) would be the
final dominant product released to the atmosphere.
Under supersaturation conditions (anaerobic soil), most part of the N2O is reduced to N2, before being released to the atmosphere (Davidsonet al. 2000).
SOIL AS A SINK OF N2O
In spite of these reports on production and emission of N2O, soils can sink N2O from the atmosphere. This phenomenon is still poorly understood, but it can be extremely important in agricultural systems. Factors influencing the consumption of N2O by soils are still unclear, but
negative fluxes have been reported in a wide range
of conditions frequently (but not always) associated to low availability of N and O2 in soils, i.e., favorable conditions to reduce N2O to N2. The consumption of N2O also depends on soil properties, water content, soil temperature, pH and availability of labile organic C and N. Such variety of conditions suggests that a great number of processes should be related to this phenomenon. The longer the N2O remains in the soil, whether because it was produced in deeper layers or due to slow diffusion to the atmosphere, the greater
amounts of N2O will be used as electron acceptor and greater will be the emissions of N2 (Chapuis-Lardy et al. 2007).
MANAGEMENT FACTORS AFFECTING N2O FORMATION
Despite the influence of climatic conditions
on the N2O production, soil management practices
affecting factors previously described and benefiting
microbial activity can also influence the N2O production. Among them, soil tillage, recycling N from crop residues and the application of N-fertilizers (mineral or organic) are of great importance. However, there are considerable shortcomings in the current state of knowledge on how dynamic
factors can control denitrification, and much of this
is due to the high spatial and temporal variability of
denitrification rates in the field (Groffman et al. 2009)
and to the failure to include functional differences in the microbial composition, in models that estimate N2O emissions (Cavigelli & Robertson 2001).
Soil tillage
have been reported as a soil management system that increases N2O emissions, when compared to conventional tillage (CT) (Liuet al. 2006, Rochette 2008, Carvalhoet al. 2009). In a subtropical Oxisol, in Brazil, N2O emissions after harvest were three times higher in NT than in CT (Escobaret al.2010). This can be explained by the greater population of
denitrifier microorganisms in the NT than in the CT
system (Linn & Doran 1984), the greater density of non-mobilized soils (Ball et al. 1999) and the maintenance of greater water content in NT soils (Baggset al.2003, 2006).
The higher soil moisture, due to the crop residue in NT (Baggs et al. 2006), can increase microbial activity near the soil surface, consuming the available O2 and creating anaerobic microsites. Liuet al.(2011) studied N2O emissions in a crop rotation system, in China, and showed that the incorporation
of maize and wheat straw significantly increased the
soil temperature, due to their heat-retaining property. This higher temperature could have stimulated
the enzymatic activity of nitrifiers and denitrifiers,
enhancing the microbial N2O production. In the CT system, such mechanism would be dissipated by the tillage in the upper soil layer, which increases the O2 concentration in soil and consequently decreases the N2O emission, in spite of the greater mineralization rate of crop residue and organic matter promoted by soil tillage (Baggset al.2003, 2006). According to Baggset al.(2000), most of N2O emissions induced
by residues incorporation occur in the first two weeks
after this event.
Nevertheless, not all reports agree with greater emissions in NT. Metayet al.(2007) and Jantaliaet al. (2008) did not observe differences in N2O emissions between CT and NT, in the Brazilian Savannah and in South of Brazil. This was also reported by Liuet al.(2005), for an irrigated corn field in northeastern Colorado. N2O emissions in NT areas with 12 and 22 years old, in Paraná State (Brazil), were similar
and influenced by the crop rotation system (Siqueira
Netoet al. 2009a). Perdomoet al.(2009) observed emissions four times greater in CT, as compared to NT, in Uruguay. Passianotoet al.(2003) estimated N2O emissions during pasture restoration in the Amazon region and observed greater emissions in CT than in NT. Laboratory experiments conducted by Huanget al. (2004) have shown that soil tillage and plant residue mixed into soil increased N2O and CO2 emissions.
Six et al. (2004) affirm that areas with recent adoption of NT (up to 10 years old) show N2O emissions higher than CT. In older NT areas, the behavior is different: NT in humid areas with 20 years old have lower emissions than CT, while, in dry areas, NT and CT have similar N2O emissions. Van Kessen et al. (2013) also showed that NT in humid areas increases N2O emissions in early years and then reduces them, in comparison to CT (NT for more than 10 years old). Omonode et al. (2011) showed that 30 years old NT areas presented N2O emissions lower than CT. This occurs because, in areas with early NT system, the soil moisture is
changed, favoring the denitrification process and thus causing N loss and inducing N deficiency in
plants, reducing the crop production (Six et al. 2004). Many of these conclusions were drawn for temperate climate regions, but we believe that similar responses would be observed in tropical regions. Thus, in studies comparing different soil tillages, it is important to take into account the time since NT has been introduced.
Residues quality
The biochemical composition of plant residues added to the soil is responsible for higher or lower N2O emissions (Gomes et al. 2009), because the maintenance of straw on the soil surface affects the N mobilization and immobilization and, consequently,
the N availability in the soil, and also the nitrification and denitrification processes.
Liu et al. (2011) reported that wheat straw incorporation increased N2O emissions in the subsequent maize season, while the incorporation of
maize straw did not influence the emissions. Toma &
Hatano (2007) observed greater N2O emissions in plots receiving low C/N ratio residues, possibly because these residues are easily decomposable. In a NT crop system, in southern Brazil, soil N2O emissions were lower after maize (higher C/N ratio) than after soybean harvest (lower C/N ratio) (Escobar et al.2010).
Siqueira Netoet al.(2009b) measured greater N2O emissions in areas cultivated with corn-wheat than in areas cultivated with soybean-wheat. They explained this by the high amount of N applied to
the corn field, in contrast to the biological N (via microorganism fixation) used as N source by the
using N-fixing in legume crops, N2O emissions were not altered in subsequent crops. In agreement with
such finding, Siqueira Netoet al.(2009a) suggested
that legume crops could be used as N source in agricultural systems, with the advantage of decreasing N2O emissions, in comparison to N-fertilizers.
An interaction between straw C/N ratio and mineral N-fertilizer addition may occur, increasing
nitrification and denitrification rates and, therefore,
increasing the N2O production and emission in agricultural soils. Liu et al. (2011) reported that the addition of wheat straw (C/N = 78.7) slightly decreased the mineral N content in the soil, due to the high C/N ratio, while the application of N-fertilizer in plots with this straw resulted in higher N2O emissions than in plots without wheat straw. In this case, in plots with straw, the high C and N contents did not limit the N2O biological production, while in plots without straw the C content limited the microbial activity and, thus, the N2O production was lower.
N2O emissions also depend on the phenological stage of the crop, or decomposition state of the residue, because this is related to the C/N rate. For soybean, N2O emissions increased during the growing and maturity processes, comprising 68% of the total emissions of N2O, during the crop cycle. Pastures with 4 and 10 years old had N2O emissions similar or slightly smaller than in forest areas, while in pastures older than 10 years emissions were smaller than in forests (Neillet al. 2005). Fernandes Cruvinelet al. (2011) reported higher nitrate availability and N2O
fluxes during the senescence of bean and soybean
and the post-harvest phase of cotton, which could be related to root mortality and N release from roots and nodules.
Nitrogen fertilization
Before 1950, less than 50% of N2O emissions was caused directly or indirectly by the use of N-fertilizers in agriculture, being most of the emissions associated to animal breeding. As a result of the increase in food production and the consequent use of N-fertilizers, two thirds of the N2O emissions were related to crop production, in 1996 (Mosier 2001).
Once the N2O emissions by nitrification and denitrification depend on the N content in the soil (Akiyama et al. 2000), the rate of N2O emissions is also related to the N-fertilizer applied
in the soil (Passianotoet al. 2003, Chenet al. 2008, Zanatta et al. 2010, Signor et al. 2013). The use
of N-fertilizers influences directly the amount of
NH4+ or NO 3
- available in the soil. The greater the
amount of N-NH4+ in the fertilizer, the greater will
be the nitrification process (Mosier 2001, Khalilet
al. 2004, Liuet al. 2005). As a consequence, the loss of N2O can also increase, because the NO2- formed during the nitrification process can be used as electron acceptor, if O2 is limited, and also because
the denitrification can occur after the nitrification,
when soil conditions are favorable. Emissions of N2O will also be greater when NO3- in the soil is high (Carmoet al. 2005, Ruseret al. 2006, Zanatta et al. 2010). When the NO3- availability decreases, N
2O
emissions will also decrease, because denitrification
is reduced (Hellebrand et al. 2008). On the other hand, N-fertilization implies a higher plant biomass production, and then more crop residues (and carbon sources) would be available in the soil, what could increase N2O emissions for a long period, after the N-fertilizer application (Hellebrandet al. 2008).
A mathematical relationship between accu-mulated N2O emission and amount of N applied as
fertilizer is not well defined. Chenet al.(2008) and
Zhang & Han (2008) affirm that this relation is linear
and can be used to estimate N2O emissions by soil, whereas Ma et al. (2010) presented results of N2O emissions exponentially related to N-fertilization
rates in maize crop fields, in Canada. Signor et al.
(2013) showed that N2O emissions in sugarcane fields increase as ammonium nitrate rates applied to the soil increase (exponential or linear relation), while N2O emissions induced by urea reach a point of maximum that occurs around 114 kg N ha-1.
In addition, the type of fertilizer also influences
the behavior of N2O emissions. In general, ammoniacal fertilizers increase N2O emissions slower than nitric
fertilizers, because nitric sources can be denitrified
immediately, while ammonia sources still have to be
nitrified before the denitrification.
Abbasi & Adams (2000) measured emissions three to eight times greater in soils treated with KNO3, as compared to those receiving ammoniacal fertilizers. From 60% to 100% of N applied as fertilizer disappeared (by plant uptake or
denitrification losses) seven days after the application
N-NO3in Amazonian soils increased N2O emissions more than the N-NH4 application. The use of N-NO3 fertilizer increased N2O emissions in 56%, while the use of N-NH4 promoted an increase of only 15% (Delaune et al. 1998). Zanatta et al. (2010) studied the application of different N-fertilizers and N2O emissions in southern Brazil and showed that nitric fertilizers induce larger N2O emissions than amidic (urea) or ammonium fertilizers. Signor et al. (2013)
studied N fertilization in two sugarcane fields, in
Brazil, and showed that N2O emissions induced by ammonium nitrate were more intense and faster than emissions induced by urea.
Velthof & Mosquera (2011) observed lower emissions from animal slurry than from calcium ammonium nitrate, for grassland, and attributed this to the uptake of ammonium present in the
slurry, before it can be nitrified, reducing the N available for denitrification in the soil. Shimizu
et al. (2013), studying N2O emissions induced by
mineral N-fertilizer and manure in five grassland
areas, during six years, showed that the N2O emission factor (proportion of applied N that is lost to the atmosphere as N2O) of manure is lower than that of mineral fertilizer.
Pelster et al. (2012) evaluated N2O emissions in two soil types (silty clay and sandy loam), for two years. They compared emissions induced by calcium ammonium nitrate, poultry manure, liquid cattle manure and liquid swine manure and suggested that the manure application only increases N2O emissions in soils with low C content, i.e., in soils where C was limiting the biological production of N2O. Nevertheless, there are some reports of no differences in N2O emissions induced by different N sources.
Bergstrom et al. (2001) observed no differences in N2O emissions induced by urea, ammonium sulfate and calcium nitrate. However, during 24 days of evaluation, these authors carried out just eight samplings. They also highlighted the limited number of measurements in each sampling day and the spatial variability on soil N2O emissions to explain why they did not detect differences between N sources.
N2O emissions induced by N-fertilizers are concentrated in some weeks after the fertilizer application. The largest N2O fluxes occur during
the first two weeks after the fertilizer application
(Bergstrom et al. 2001, Liu et al. 2005, Liu et al. 2006, Schils et al. 2008), while the N effect on N2O emissions disappear in two months after
the application (Zhang & Han 2008). Therefore, researches should give priority to measurements of N2O emissions during the first two weeks after fertilization (Schils et al. 2008), with more interspaced measurements after this period.
N2O emissions are reduced in cases of small availability of N in the soil (Yang & Cai 2007) and when small precipitations occur after the N application (Perdomo et al. 2009). In conditions of soil saturation (but not soaked), the split application of KNO3 decreased the emission of N2O, as compared to a single application (Ciarloet al. 2008). However, if a single dose of N-fertilizer at seeding is followed by rain, it can produce elevated N2O emissions (Tanet al. 2009). Splitting the doses of N-fertilizers increases
their efficiency and reduces losses by leaching and denitrification, implying in benefits for reducing
GHG emissions and ensuring natural resources preservation (Tanet al. 2009). Splitting N rates is also important to supply N during the crop cycle, mainly in periods in which it is more requested, ensuring a higher crop yield.
The fertilizer application depth also influences
the N2O emission (Liuet al. 2006). Van Kessen et al. (2013), in a meta-analysis study, showed that the application of N-fertilizer at more than 5.0 cm depth can decrease N2O emissions, particularly in humid climates. Emissions are smaller when the N-fertilizer is deposited at 10.0 cm depth, as compared to the deposition at the soil surface or at 5.0 cm depth. The application at 10.0 cm depth increases the residence time of N2O in the soil, also increasing the chance of its reduction to N2 (Chapuis-Lardyet al.2007).
However, Velthof & Mosquera (2011) showed that the application of cattle slurry by shallow or deep injection on grassland or maize land increased N2O emissions, as compared to surface application. In this case, slurry applications in inner soil layers are indicated to reduce NH3 volatilization and increase the amount of mineral N entering the soil. Moreover, the slurry injection increases the available C concentration in the soil and thus the microbial activity that also enhances the O2 consumption and
stimulates denitrification (Velthof & Mosquera 2011).
et al.(2007) observed the greatest emission of N2O when the application of fertilizer was concurrent to precipitation events, and Passianoto et al. (2003) reported intense emissions of N2O induced by fertilizer associated to the first rain after the N application. However, with small N availability, even in conditions of high moisture content, emissions will be reduced (Denmeadet al.2010).
The use of slow releasing fertilizers is an important strategy to reduce N2O emissions induced by N-fertilizers, because they are involved in slower nutrient release, despite the fact that the rate, patterns and duration of the release are not well controlled (Shaviv 2001). The use of controlled release N-fertilizer in southern Brazil promoted lower N2O emissions, in comparison to ammonium nitrate, calcium nitrate, ammonium sulphate and uran (Zanatta et al. 2010).
Slow release fertilizers are classified in three
groups: (i) organic-N low-solubility compounds, that include biologically and chemically decomposing products, as urea-formaldehyde and isobutyledene-diurea, respectively; (ii) fertilizers with a physical barrier, i.e., fertilizers coated with organic polymers (thermoplastic or resins) or inorganic materials (sulfur or mineral based) that can be hydrophobic or hydrophilic; (iii) inorganic low-solubility compounds, for example, metal ammonium phosphates and partially acidulated phosphates rocks (Shaviv 2001).
Jiang et al. (2010) demonstrated that N2O emissions from coated urea (with calcium and magnesium phosphate, polymer or sulfur) were higher than from common urea emissions, especially when precipitation events occurred following basal N application. However, the application of
urea-formaldehyde and urea with nitrification inhibitors
(hydrochinone and dicyandiamide) reduced N2O emissions and this was not accompanied by a decrease in the biomass production.
Moreover, N-fertilizers stabilized or
bio-amended by inhibitors are classified as slow-acting nitrogen (Shaviv 2001). Nitrification inhibitors are
also indicated as an important strategy to reduce N2O emissions induced by N-fertilizers (Zanatta et al. 2010).
Di & Cameron (2012) observed that dicyandiamide (DCD) and 3,4-dimethylpyrazole phosphate (DMPP) reduced from 62% to 66% the N2O emissions induced by urine on grazed pasture. During a two years study, Pfab et al. (2012) reported
that DMPP reduced N2O emissions from 40% to 45%, without affecting cropping yields. DMPP reduces N2O fluxes, but do not delay or change their temporal pattern, when compared to conventional fertilizer
(Menéndez et al. 2012). The DMPP efficiency is
dependent on temperature and soil water content. Menéndez et al. (2012) showed that, at 40% WFPS, the DMPP reduced emissions from 17% to 42%. However, at 80% WFPS, the DMPP efficiency decreased from 45% to 23%.
DCD and DMPP can also significantly increase
the soil organic N, shift the main form of N in the soil (from NO3- to NH
4
+), increase the soil dissolved
organic carbon, crop yield, aboveground biomass, C and N uptake by plants (Liu et al. 2013). However, the use of DCD for seven years, in three pasture soils, did not change the soil microbial C and N, protease and deaminase activities, and had no negative impact on the abundance of archea and bacteria in the soils, indicating the DCD as an effective N2O mitigation technology (Guo et al. 2013). Despite the fact that
slow release fertilizers and nitrification inhibitors
may reduce N2O emissions, they are more expensive than conventional fertilizers and have not been widely used (Cameron et al. 2013).
The International Panel on Climate Change (IPCC) suggests a methodology to estimate soil N2O emissions, according to mineral and organic fertilizers, and also for the mineralization of N from crop residues added to soil. In these cases, it may be considered that 1% (uncertainty range from 0.3% to 3%) of the N added is converted into N2O (IPCC 2006). This value, known as emission factor, was suggested to simplify the calculation in the life cycle study of agricultural crops (Brentrupet al. 2000).
Table 2 presents the emission factors reported in several papers, for many crops, where values vary from 0.03% to 21%. Schilset al.(2008) and Zhang & Han (2008) attribute the small emission factors they observed to the low soil water content. The high emission factor value reported by Denmead et al. (2010) (21%) was related to the combination of high concentration of organic carbon and frequent rain, causing many events of pore saturation and increasing the N2O emission.
Table 2. Crops and N2O emission factors reported by several authors around the world.
Crop N2O emission factor (%) Location Reference
Rapeseed, corn and sugarcane 3.00-5.00 Based on average data from literature (Crutzenet al. 2008)
Soybean 0.55-1.97 Argentina (Ciampittiet al. 2008)
Pasture for bale 0.28-0.62 Scotland (Smithet al. 1998)
Potato 0.86-1.90 Scotland (Smithet al. 1998)
Winter wheat 0.17 Scotland (Smithet al. 1998)
Spring barley 0.67 Scotland (Smithet al. 1998)
Winter wheat 1.68 China (Chenet al. 2008)
Forest 0.10-0.03 USA (Delauneet al. 1998)
No-till 2.80 Brazil (Passianotoet al. 2003)
Conventional till 0.90 Brazil (Passianotoet al. 2003)
Pasture (mineral fertilizer) 0.17 Netherlands (Schilset al. 2008) Pasture (mineral fertilizer and cow manure) 0.29 Netherlands (Schilset al. 2008)
Pasture 0.35 China (Zhang & Han 2008)
Abandoned agriculture area 0.52 China (Zhang & Han 2008)
Sugarcane (acid drainage soil) 21.00 Australia (Denmeadet al.2010)
Sugarcane (silt-clayey soil) 2.80 Australia (Denmeadet al.2010)
No-till 0.20 Brazil (Giacominiet al. 2006)
Reduced till 0.25 Brazil (Giacominiet al. 2006)
No-till and conventional till in the
Brazilian Savannah 0.03 Brazil (Metayet al. 2007)
Pasture in the Amazon 2.80 Brazil (Neillet al. 2005)
Meta-analysis study 0.70-1.20 - (Bouwman & Boumans 2002)
Meta-analysis study 0.17-2.90 - (Novoa & Tejeda 2006)
applied to the soil. Velthof & Mosquera (2011) reported that increasing the N application rate on maize field also increased the emission factor, independently of the N source (calcium ammonium nitrate, injected cattle slurry or injected pig slurry).
Thus, a fixed emission factor does not reflect the
effect of the N application rate on N2O emissions (Velthof & Mosquera 2011).
The use of an emission factor proposed by the
IPCC is very simplistic and do not reflect variations
in management activities, climate and ecosystems (Rees & Ball 2010). The proposed value does not take into account the soil type and the fact that the climate within a region is not always adequate to describe the spatial and temporal variability of N2O emissions (Rees & Ball 2010), as well as the crops to which the fertilizer is applied (Flynn et al. 2005). Although there are not enough long-term datasets to provide the information needed to design emission factors for different climate
zones or soil types, the use of specific emission factors that reflect regional variability in climate,
soil type and management is a requirement to improve greenhouse gases inventories (Thomson et al.2012).
SUMMARIZING N2O MITIGATION PRACTICES
Considering the previous comments and observations made by Thomson et al. (2012), it is possible to highlight some present and future strategies that can be adopted to reduce soil N2O emissions:
(i) Prioritizing the use of low N2O emission fertilizers: in general, N-NH4+ fertilizers emit less N2O than N-NO3-. So, it is interesting to use manure or organic fertilizers as N source when it is possible, because their N2O emissions are lower than for mineral N-fertilizers;
(ii) Managing the N-fertilizer application: N2O emissions from soils are reduced when N-fertilizers are depth applied, instead of surface application. Moreover, it reduces the N available in the soil, especially when heavy rains are expected, and decrease the proportion of N lost as N2O. So, splitting the rate of N-fertilizer recommended to the crop and applying the fertilizers to the inner soil layers can be used to reduce N2O emissions;
(iii) Managing the soil chemistry and microbiology: understanding the enzymology and
example, when Cu concentration in the soil is low and
pH values are below 7.0, denitrification is incomplete,
producing N2O instead of N2. Then, using liming to reduce soil acidity and adjusting micronutrients, specially Cu contents, can reduce N2O emissions;
(iv) Plant breeding: reducing the dependence on fertilizers through engineering crop plants to
fix nitrogen by themselves, or by capitalizing C-N
interactions in the rhizosphere, can be useful to reduce emissions. The composition of plant-derived
C flow or N uptake demand can be changed to avoid
N losses to the atmosphere as N2O. Moreover, the
release of biological nitrification inhibitors could be
promoted by plant breeding;
(v) Promoting sustainable agricultural
inten-sification: this could be done by using crop varieties
and livestock breeds with high yield, avoiding unnecessary external inputs, improving the fertilizer
use efficiency, using lime to increase the soil pH, using nitrification inhibitor technology, adopting
agro-ecological practices, quantifying and minimizing the impact of management systems. In order to increase sustainability, it is important to understand how agricultural inputs can positively or negatively affect the biological process and ecosystem services that support agriculture.
FINAL CONSIDERATIONS AND FUTURE DIRECTIONS
Nitrous oxide is an important greenhouse gas, due to its high global warming potential (298 times higher than CO2). Agricultural soils are the main N2O source to the atmosphere, and the key
processes affecting its production (nitrification and denitrification) are influenced by various factors that can be modified by agricultural management
practices. The available N in the soil is the most important of these factors and is directly related to the N-fertilizers application. Therefore, if, on one hand, the use of N-fertilizer is important to provide that plants reach a desirable yield, on the other hand, a portion of this added N can be lost to the atmosphere as N2O, enhancing the greenhouse effect.
Despite the importance of N-fertilizers to nitrous oxide emissions, many questions about it remain unclear. The behavior of N2O emissions from different N sources, different responses according to
the crop the fertilizer is applied to, influence of native
soil organic matter content and quality, interactions
between N and other nutrients, as well as the real
influence of micronutrients on N2O emissions should
be better explored in future researches. Another important point is to explore the N plant demands and
N2O emissions, trying to find management practices
to maximize plant yield and minimize N2O emissions, also considering splitting the N recommended dose. Information on how differently N-fertilizers induce N2O emissions is useful in GHG inventories and contributes to reliable final values in these studies. However, nowadays, N2O emissions in agricultural soils are estimated by using a default emission factor that was not necessarily obtained in the place for which the estimative is being done, and
do not taking into account the environmental specific
characteristics where the fertilizer is applied (soil type and characteristics, crop, type and quantity of N added to the area), what can generate unreliable GHG inventories.
In Brazil, there are few studies available about this theme. When elaborating Brazilian GHG inventories or life-cycle assessments, it is important
to use information generated under specific climate
and soil conditions, and for crops planted in the country. So, it is necessary to develop long term studies, comprising different N sources and rates, evaluating N2O emissions during all the crop cycle
and also taking into account the influence of crop
residues on these emissions. It is also important to repeat these measurements in different regions, in order to obtain consistent values that will really contribute to the national GHG estimatives.
REFERENCES
ABBASI, M. K.; ADAMS, W. A. Gaseous N emission during simultaneous nitrification-denitrification associated with mineral N fertilization to a grassland soil under field conditions. Soil Biology and Biochemistry,Oxford, v. 32, n. 8-9, p. 1251-1259, 2000.
AKIYAMA, H.; TSURUTA, H.; WATANABE, T. N2O and NO emissions from soils after the application of different chemical fertilizers. Chemosphere: Global Change
Science,Oxford, v. 2, n. 3-4, p. 313-320, 2000.
BAGGS, E. M.; CHEBII, J.; NDUFA, J. K. A short-term investigation of trace gas emissions following tillage and no-tillage of agroforestry residues in western Kenya.
Soil & Tillage Research,Amsterdam, v. 90, n. 1-2, p.
69-76, 2006.
conventional tillage. Plant and Soil,Dordrecht, v. 254, n. 2, p. 361-370, 2003.
BAGGS, E. M. et al. Nitrous oxide emission from soils after incorporating crop residues. Soil Use and
Management, Oxford, v. 16, n. 2, p. 82-87, 2000.
BALL, B. C.; SCOTT, A.; PARKER, J. P. Field N2O, CO2 and CH4 fluxes in relation to tillage, compaction and soil quality in Scotland. Soil & Tillage Research,Amsterdam, v. 53, n. 1, p. 29-39, 1999.
BERGSTROM, D. W. et al. Nitrous oxide production and flux from soil under sod following application of different nitrogen fertilizers. Communications in Soil Science and
Plant Analysis, New York, v. 32, n. 3-4, p. 553-570, 2001.
BOCKMAN, O. C.; OLFS, H. W. Fertilizers, agronomy, and N2O. Nutrient Cycling in Agroecosystems, Dordrecht, v. 52, n. 2/3, p. 165-170, 1998.
BOUWMAN, A. F.; BOUMANS, L. J. Modeling global annual N2O and NO emissions from fertilized fields.
Global Biogeochemical Cycles, Washington, DC, v. 16,
n. 4, p. 281-289, 2002.
BRASIL. Ministério da Ciência e Tecnologia. Coordenação Geral de Mudanças Globais do Clima. Segunda comunicação nacional do Brasil à convenção-quadro
das Nações Unidas sobre mudança do clima.Brasília, DF:
Ministério da Ciência e Tecnologia, 2010.
BREMNER, J. M. Sources of nitrous oxide in soils.
Nutrient Cycling in Agroecosystems, Dordrecht, v. 49,
n. 1-3, p. 7-16, 1997.
BREMNER, J. M. et al. Formation of nitrous oxide and dinitrogen by chemical decomposition of hydroxylamine in soils. Soil Biology and Biochemistry, Oxford, v. 12, n. 3, p. 263-269, 1980.
BRENTRUP, F. et al. Methods to estimate on-field nitrogen emissions from crop production as an input to LCA studies in the agricultural sector. The International Journal of Life
Cycle Assessment, Berlin, v. 5, n. 6, p. 349-357, 2000.
CAMERON, K. C. et al. Nitrogen losses from the soil/plant system: a review. Annals of Applied Biology, Warwick, v. 162, n. 2, p. 145-173, 2013.
CARMO, J. B. et al. Nitrogen availability and N2O fluxes from pasture soil after herbicide application. Revista
Brasileira de Ciencia do Solo,Viçosa, v. 29, n. 5, p.
735-746, 2005.
CARVALHO, J. L. N. et al. Conversion of Cerrado into agricultural land in the southwestern Amazon: carbon stocks and soil fertility. Scientia Agricola, Piracicaba, v. 66, n. 2, p. 233-241, 2009.
CAVIGELLI, M. A.; ROBERTSON, G. P. Role of denitrifier diversity in rates of nitrous oxide consumption
in a terrestrial ecosystem. Soil Biology & Biochemistry, Oxford, v. 33, n. 3, p. 297-310, 2001.
CERRI, C. C. et al. Brazilian greenhouse gas emissions: the importance of agriculture and livestock. Scientia
Agricola,Piracicaba, v. 66, n. 6, p. 831-843, 2009.
CHAPUIS-LARDY, L. et al. Soils, a sink for N2O?: a review. Global Change Biology, Oxford, v. 13, n. 1, p. 1-17, 2007.
CHEN, S. T.; HUANG, Y.; ZOU, J. W. Relationship between nitrous oxide emission and winter wheat production. Biology and Fertility of Soils,Berlin, v. 44, n. 7, p. 985-989, 2008.
CIAMPITTI, I. A.; CIARLO, E. A.; CONTI, M. E. Nitrous oxide emissions from soil during soybean (Glycine max (L.) Merrill) crop phenological stages and stubbles decomposition period. Biology and Fertility of Soils, Berlin, v. 44, n. 4, p. 581-588, 2008.
CIARLO, E. et al. Soil N2O emissions and N2O/(N2O+N2) ratio as affected by different fertilization practices and soil moisture. Biology and Fertility of Soils,Berlin, v. 44, n. 7, p. 991-995, 2008.
CRUTZEN, P. J. et al. N2O release from agro-biofuel production negates global warming reduction by replacing fossil fuels. Atmospheric Chemistry and Physics, Katlenburg-Lindau, v. 8, n. 2, p. 389-395, 2008.
DAVIDSON, E. A.; SWANK, W. T. Environmental parameters regulating gaseous nitrogen losses from 2 forested ecosystems via nitrification and denitrification.
Applied and Environmental Microbiology, Baltimore,
v. 52, n. 6, p. 1287-1292, 1986.
DAVIDSON, E. A. et al. Testing a conceptual model of soil emissions of nitrous and nitric oxides. Bioscience, Washington, DC, v. 50, n. 8, p. 667-680, 2000.
DELAUNE, R. D. et al. Nitrification and denitrification estimates in a Louisiana swamp forest soil as assessed by N-15 isotope dilution and direct gaseous measurements.
Water Air and Soil Pollution,Dordrecht, v. 106, n. 1-2,
p. 149-161, 1998.
DENMAN, K. L. et al. Couplings between changes in the climate system and biogeochemistry. In: SOLOMON, S. et al. (Eds.). Climate change 2007: the physical science basis. Cambridge: Cambridge University Press, 2007. p. 499-588.
DENMEAD, O. T. et al. Emissions of methane and nitrous oxide from Australian sugarcane soils. Agricultural and
Forest Meteorology,Amsterdam, v. 150, n. 6, p. 748-756,
2010.
emissions and nitrate leaching from cow urine in grazed pastures? Soil Use and Management, Oxford, v. 28, n. 1, p. 54-61, 2012.
ESCOBAR, L. F. et al. Postharvest nitrous oxide emissions from a subtropical oxisol as influenced by summer crop residues and their management. Revista Brasileira de
Ciência do Solo, Viçosa, v. 34, n. 2, p. 507-516, 2010.
FERNANDES CRUVINEL, E. B. et al. Soil emissions of NO, N2O and CO2 from croplands in the Savanna region of central Brazil. Agriculture, Ecosystems and Environment, Amsterdam, v. 144, n. 1, p. 29-40, 2011.
FIRESTONE, M. K.; DAVIDSON, E. A. Microbial basis of NO and N2O production and consumption in soils. In: ANDRAE, M. O.; SCHIMEL, D. S. (Eds.). Exchange of trace gases between terrestrial ecosystems and the
atmosphere. New York: John Wiley, 1989. p. 7-21.
FLYNN, H. C. et al. Climate and crop-responsive emission factors significantly alter estimates of current and future nitrous oxide emissions from fertilizer use. Global Change
Biology,Oxford, v. 11, n. 9, p. 1522-1536, 2005.
FORSTER, P. et al. Changes in atmospheric constituents and in radiative forcing. In: SOLOMON, S. et al. (Eds.). Climate change 2007: the physical science basis. Cambridge: Cambridge University Press, 2007. p. 129-234.
GIACOMINI, S. J. et al. Nitrous oxide emissions following pig slurry application in soil under no-tillage system. Pesquisa Agropecuaria Brasileira,Brasília, DF, v. 41, n. 11, p. 1653-1661, 2006.
GOMES, J. et al. Soil nitrous oxide emissions in long-term cover crops-based rotations under subtropical climate.
Soil & Tillage Research,Amsterdam, v. 106, n. 1, p.
36-44, 2009.
GROFFMAN, P. M. et al. New approaches to modeling
denitrification. Biogeochemistry, Dordrecht, v. 93, n. 1-2,
p. 1-5, 2009.
GU, J. X. et al. Regulatory effects of soil properties on background N2O emissions from agricultural soils in China. Plant and Soil,Dordrecht, v. 295, n. 1-2, p. 53-65, 2007.
GUO, Y. J. et al. Effect of 7-year application of a nitrification inhibitor, dicyandiamide (DCD), on soil microbial biomass, protease and deaminase activities, and the abundance of bacteria and archea in pasture soils.
Journal of Soils and Sediments, Berlin, v. 13, n. 4, 2013.
p. 753-759.
HAO, X. et al. Nitrous oxide emissions from an irrigated soil as affected by fertilizer and straw management.
Nutrient Cycling in Agroecosystems, Dordrecht, v. 60,
n. 1-3, p. 1-8, 2001.
HAYATSU, M.; TAGO, K.; SAITO, M. Various players in the nitrogen cycle: diversity and functions of the microorganisms involved in nitrification and
denitrification. Soil Science and Plant Nutrition, Tokyo,
v. 54, n. 1, p. 33-45, 2008.
HELLEBRAND, H. J.; SCHOLZ, V.; KERN, J. Fertilizer induced nitrous oxide emissions during energy crop cultivation on loamy sand soils. Atmospheric Environment, Oxford, v. 42, n. 36, p. 8403-8411, 2008.
HUANG, Y. et al. Nitrous oxide emissions as influenced by amendment of plant residues with different C:N ratios.
Soil Biology & Biochemistry,Oxford, v. 36, n. 6, p.
973-981, 2004.
INTERGOVERNMENTAL PANNEL ON CLIMATE CHANGE (IPCC). Climate change 2007: synthesis report. Geneva: IPCC, 2007.
INTERGOVERNMENTAL PANNEL ON CLIMATE CHANGE (IPCC). Guidelines for national greenhouse
gas inventories. Japan: IPCC, 2006.
JANTALIA, C. P. et al. Fluxes of nitrous oxide from soil under different crop rotations and tillage systems in the south of Brazil. Nutrient Cycling in Agroecosystems, Dordrecht, v. 82, n. 2, p. 161-173, 2008.
JIANG, J. et al. Nitrous oxide emissions from Chinese cropland fertilized with a range of slow-release nitrogen compounds. Agriculture, Ecosystems and Environment, Amsterdam, v. 135, n. 3, p. 216-225, 2010.
KHALIL, K.; MARY, B.; RENAULT, P. Nitrous oxide production by nitrification and denitrification in soil aggregates as affected by O2 concentration. Soil Biology &
Biochemistry,Oxford, v. 36, n. 4, p. 687-699, 2004.
KNOWLES, R. Denitrification. Microbiological Reviews,
Bethesda, v. 46, n. 1, p. 43-70, 1982.
LE TREUT, H. et al. Historical overview of climate change. In: SOLOMON, S.; QIN, D. et al. (Eds.). Climate
change 2007: the physical science basis.Cambridge:
Cambridge University Press, 2007. p. 93-127.
LINN, D. M.; DORAN, J. W. Aerobic and anaerobic microbial-populations in no-till and plowed soils. Soil
Science Society of America Journal,Madison, v. 48, n. 4,
p. 794-799, 1984.
LIU, C. et al. Effects of irrigation, fertilization and crop straw management on nitrous oxide and nitric oxide emissions from a wheat-maize rotation field in northern China. Agriculture, Ecosystems and Environment, Amsterdam, v. 140, n. 1-2, p. 226-233, 2011.
LIU, C. et al. Effects of nitrification inhibitors (DCD and DMPP) on nitrous oxide emissions, crop yield and nitrogen uptake in a wheat-maize cropping system. Biogeosciences