Post
-
merger
Innovative P
erformance
in
the Renewable Energy Sector
Maastricht University
Faculty of Economics and Business Administration
Department Organization and Strategy
Student: Julia Koester
Student ID: i6083623
Supervisor I: Prof. Dr. J. Hagedoorn
Supervisor II: Ass. Prof. Paulo Soares de Pinho
Abstract
Table of Content
1 Introduction ... 1
2 Theory Development ... 3
2.1 Industry Background – Energy Sector ... 3
2.2 Theory Background – M&A and Innovation ... 6
2.3 Hypotheses Development ... 8
3 Sample and Method ... 11
3.1 Data and Sample ... 11
3.2 Variables ... 12
3.3 Method and Model ... 16
4 Results ... 18
4.1 Model Fit ... 18
4.2 Results Negative Binomial Regression ... 19
5 Discussion and Conclusion ... 23
6 Limitations and Suggestions for Future Research ... 27
7 References ... 29
8 Appendices ... 34
8.1 Appendix 1: Descriptive Statistics and Variable Summary ... 34
List of Tables
Table 1: Hausman test: random vs. fixed effects model ... 18
Table 2: Negative Binomial Regression Model ... 21
Table 3: Summary of Hypothesis Tests ... 22
Table 4: Descriptive Statistics ... 34
Table 5: Negative Binomial Regression 2007 ... 37
Table 6: Negative Binomial Regression 2008 ... 38
Table 7: Negative Binomial Regression 2009 ... 39
Table 8: Negative Binomial Regression 2010 ... 40
1
Introduction
Due to increasing concerns about global warming and shrinking fossil fuel and gas reserves, the renewable energy sector has undergone a rapid growth in the last decade (Yoo et al., 2013). Since global warming and shrinking fossil fuels are topics of worldwide attention, governments all over the world have started to support existing players and motivate new entrants to engage with energy generation from sources that are naturally replenished (Eisenbach et al., 2011). The European Union (EU) for example, committed to a decrease of 20% greenhouse gas (GHG) emission until 2020 (IEA, 2014). Since energy generation and consumption account for the largest part of GHG emission, the energy sector came into focus. However, in order to realize the required reduction of GHG, innovation is acknowledged to be the key for change (Wiesenthal et al., 2012). Consequently, renewable energy business models are maturing and starting to break even, and becoming more attractive for corporate investors.
One way corporate investors can engage with this innovative new field is through mergers and acquisitions (M&A). Defined as the process in which once separated firms combine their resources into one new entity (Hagedoorn and Duysters, 2002), M&A, next to a firm’s innovation, are central aspects of competitive strategies in today’s business reality (Cassiman et al., 2005).
importance of renewable energy technologies trigger an increase in the number of M&A (Eisenbach et al., 2011). So far, research about the impact of M&A on firm’s innovativeness has mainly focused on the high-technology sector. Low-technology sectors, like the energy sector, have been resistant to change and innovation for many years (Weiss and Bonvillian, 2013). Furthermore, major energy providers that have focused on incremental technology improvements, are now shifting their focus towards renewable energy technology (Eisenbach et al., 2011).
The economic effects of M&A on the firm performance in the renewable energy sector have been discussed and found to be positive (Yoo et al., 2013, Eisenbach et al., 2011). However, to the best knowledge of the author the link between innovation and M&A in this industry has not been examined yet.
Simultaneously, the increasing demand for new technologies will let innovation become a key competitive advantage for the energy sector too (Wiesenthal et al., 2012). Developing the link between the increasing M&A activities in the renewable energy sector and the increasing demand for innovation, the thesis at hand is dedicated to the following research question:
How do M&A influence the acquirer’s post-merger innovative performance in the
renewable energy sector?
2
Theory Development
This chapter provides a comprehensive overview of the industry as well as a theory background. After highlighting the importance of the renewable energy sector and providing relevant definitions, the industry background paragraph discusses essential challenges, development stages and recent sector trends in M&A. The second paragraph gives an introduction of the underlying theory. The link between innovation and interfirm exchange in general and M&A in particular is discussed and potential challenges are delineated. Thirdly and lastly, three hypotheses are developed based on the industry and the theory background.
2.1
Industry Background – Energy Sector
Since global warming has become a topic of social as well as political interest, the energy market is undergoing major changes (Eisenbach et al., 2011). The focus is shifting towards the generation of energy from renewable and sustainable sources. The International Energy Agency (IEA) defines renewable energy as energy that “is derived from natural processes that are replenished constantly. In its various forms, it derives directly or indirectly from the sun, or from heat generated deep within the earth. Included in the definition is energy generated from solar, wind, biofuels, geothermal, hydropower and ocean resources, and biofuels and hydrogen derived from renewable resources.” (IEA, 2014, p.17). These renewables find use in the three main areas of the energy sector: primary energy supply, electricity production, and installed generating capacity (IEA, 2014). In 2013, worldwide renewable power generation rose from 7.8% to 8.5%, which led to a decrease of the energy-generated CO2 emission by
There are three key parties of stakeholders in the renewable energy sector: society, government, and companies. These three stakeholder groups have partly conflicting goals. In the development process of the renewable energy sector, governmental interventions play an important role, because of the mismatch between social goals and producers and/or consumer incentives. Further challenges of the sector development are market imperfections, like network economies and lumpiness of investments, and public habits. The quasi-free market in energy technology leads to conflicts between innovators, who want to protect their technology through IP, and environmental and security externalities (Weiss and Bonvillian, 2013). Therefore, governmental initiatives, such as research and development subsidies (technology push policies) or deployment subsidies and feed-in tariffs (market pull polices) are supposed to incentivize clean energy innovation and further aimed reduce investment risks (Lee and Zhong, 2014). Albeit stakeholders from both developing and developed countries have expressed their concerns about the negative impact of traditional energy generation on the environment, the different regions still differ a lot in their stage of development (Lee and Zhong, 2014).
Although many studies have found a positive and significant impact of government interventions on inventive activities (Popp et al., 2011), corporate actors play an important role in the market stabilization and expansion process (Corsatea et al., 2014, Klaassen et al., 2005, Popp et al., 2011).
development stages. While the first two stages are mainly financed through private equity and supported by public research and development (R&D), the third and fourth stage are characterized through increasing M&A initiatives and public markets (Lee and Zhong, 2014 & UNEP-Center/BNEF, 2014). Since in many fields of the renewable energy sector technologies have started to enter stage (3) or (4), it is not surprising that the number of M&A have followed an upward trend in the past 10 years (Yoo et al., 2013, Eisenbach et al., 2011, UNEP-Center/BNEF, 2014). For instance, hydro and thermal energy technologies are already in mature development stages, whereas solar and wind has just started to scale up and role out (Johnstone et al., 2009).
In summary, the renewable energy sector is not only gaining social but also economic importance. The sector has entered a consolidation stage, in which the number of M&A and alliances increases. Governments and companies have to strive for innovation and learning in order to achieve the ambitions GHG emission reduction goals. By doing so, new technologies can achieve a reduction in CO2 and newly gained knowledge may
reduce costs for technologies and power generation.
2.2
Theory Background – M&A and Innovation
Innovation can be considered as an indirect return of acquisition activities (Ahuja and Katila, 2001). The ability to keep up with the increasing path of technological change has become a fundamental factor to maintain the firm’s position in the market. New and disruptive technologies can rob incumbents of their previous dominant position. As such, innovations have the potential to change a mature market (Powell et al., 1996). Networks are the place where innovation takes place, because breakthroughs often demand skills and knowledge that exceed the capabilities of a single company (Powell et al., 1996). Partnerships, therefore, can be beneficial to the partnering firms through skills and knowledge spillovers, leading to rising numbers of interfirm exchange. Strategies of interfirm exchange, such as M&A, first focus on knowledge distribution, absorption and creation to eventually obtain competitive advantage (Chen et al., 2014). Thereby, the partnering firms get access to a broader scope of information and can better understand and evaluate new technology developments (Ahuja, 2000).
companies merge into one company or if one company acquirers a majority ownership of another company (Hagedoorn and Duysters, 2002). M&A can increase the acquirer’s market power and can affect the technology competition, if the acquisition has the potential to create barriers to entry (Cassiman et al., 2005). Through M&A the company takes control over the resources of another company (Yoo et al., 2013). In other words, the firm gains access to the entire innovative abilities of the other firm (de Man and Duysters, 2005). However not all M&A are driven by innovation motives. As aforementioned, they can be also motivated, for example, by market power gains, synergy aims, risk reduction, diversification, or market access (Hagedoorn, 1993, Ahuja and Katila, 2001, Yoo et al., 2013, Cloodt et al., 2006).
Moreover, today’s knowledge builds the foundation for future knowledge. It develops the ability to identify and exploit external knowledge. This ability is called absorptive capacity (Cohen and Levinthal, 1989). Absorptive capacity is the ability to learn, incorporate, and apply new external knowledge. The firm’s absorptive capacity depends among others on organizational institutions involved (Chen et al., 2014). In other words, the acquisition of an external knowledge stock does not only increase the company’s knowledge base, but also improves the ability to identify and exploit trends and changes (Cloodt et al., 2006). Relating it back to the resource-based view, which emphasizes the importance of internal, unique, inimitable and innovative firm capabilities in order to gain or sustain competitive advantage (Barney, 1991), the acquirement of external knowledge and the appropriate use of the knowledge is key to a firm’s long-term competitive advantage (Cloodt et al., 2006).
necessarily driven by innovation motives and are very time and cost consuming. Consequently, not all M&A lead to higher innovative performance.
2.3
Hypotheses Development
M&A of renewable energy companies have emerged as a dominant strategy in the energy sector (UNEP-Center/BNEF, 2014). Moreover, innovation is seen as the key driver to GHG emission reduction. In this context it is crucial to understand the interdependency between both aspects. The following three hypotheses aim to answer the research question with regard to the M&A motive, the absolute acquired knowledge base and the relatedness between target and acquirer. They are based on the study of Ahuja and Katila (2001) and Cloodt et al. (2006), as both studies recognize the fact that M&A do not lead to innovation per se and, hence, provide a comprehensive consideration of the relation between M&A and innovation.
Technology versus non-technology motivated M&A
Hypothesis 1: Non-technological acquisitions will have either a negative or a
non-significant impact on the acquirer’s post-merger innovative performance.
Absolute knowledge base
The impact of the target’s absolute knowledge base has been examined by Ahuja and Katila (2001) and replicated by Cloodt et al. (2006). The rationale behind the argument can be explained by the absorptive capacity: an increasing knowledge base also increases the ability to recognize, evaluate, and ultimately use new information (Cohen and Levinthal, 1989). Differently spoken, a greater knowledge base increases the opportunities for innovation (Ahuja and Katila, 2001). Furthermore, research has shown that an increasing knowledge leads to a higher innovation output in the renewable energy sector (Klaassen et al., 2005, Popp et al., 2011, Wiesenthal et al., 2012)
Hypothesis 2: The absolute knowledge base of the target company will have a positive
impact on the acquirer’s post-merger innovative performance.
Relatedness of target and acquirer
a significant and positive effect on post-merger financial performance of M&A of firms that are both from the renewable energy sector.
Based on the idea of absorptive capacity, it is easier for firms to adapt external knowledge that is linked to their already existing knowledge base (Cloodt et al., 2006). Literature about corporate control highlights the potentially negative effect of acquisitions on innovative performance. This negative effect results from agency problems as well as from a shift of management priority from innovation towards organizational integration. In other words, the higher the degree of diversification, the more likely is a non-significant or negative impact on post-merger innovativeness (Hitt et al., 1991). To sum it up, it is expected that the relatedness of target and acquirer has a positive effect on the innovativeness of the acquiring firm.
Hypothesis 3: The relatedness between target and acquirer has a positive impact on the
3
Sample and Method
The sample and method chapter explains the data collection as well as the data analysis. First, the used databases, time frames, and existing data are clarified. Next, each variable is defined and examined. The last paragraph explains the applied model and the used statistical tool.
3.1
Data and Sample
The study explores the post-merger innovative performance in the renewable energy sector between 2005 and 2011. The number of M&A has risen immensely within the past 10 years. However, before 2005, renewable energy related companies and technologies were still in early stage of development and hence had a comparably low economic importance and so was the number of M&A (UNEP-Center/BNEF, 2014). Therefore, M&A between 2005 and 2010 have been considered. To be able to consider the time lag between M&A and innovation, post-merger innovative performance one year after the M&A have been analyzed resulting in a period from 2006 to 2011.
are already coming from the renewable energy sector in order to ensure that renewable energy is part of their core business. The definition of the renewable energy sector through the primary SIC 499-A includes both the previously defined renewables and traditional players that have a notable share in renewables. The subdivision is based on information provided by SDC Platinum. This left a total number of 10 subsectors. A list of the subsectors including distribution within the sample can be found in Appendix 2. The data was extracted according to the following criteria: (1) the acquisition/ merger deal took place between the 01.01.2005 and 31.12.2010, (2) the acquirer owns more than 50 % of the target after the acquisition, (3) the deal has been closed and unconditional (4) the acquirer is considered to be part of the renewable energy sector (Primary SIC 499-A). Acquirers that have been acquired or went bankrupt in the time of analysis were excluded. Furthermore, companies without any patent application between 2005 and 2011 have been ignored too. This left a total number of 117 acquirers. Forty six % of the acquirers are from Europe, 40 % from North America, 9 % from Asia, 3 % from others, and 2 % from Latin America.
In order to measure the innovative performance patent application counts are used. Espacenet was used in order to collect the number of patents of both acquiring and acquired company. Espacenet is the patent search platform of the European Patent and is frequently used in studies about innovation in the renewable energy sector (Bointner, 2014, Popp et al., 2011).
3.2
Variables
Dependent variable
variables. Patents have positive as well as negative aspects as a measure of a firm’s innovativeness. A patent is a strong measure, as it signals economic importance (Scherer and Ross, 1990) and externally accepted novelty (Griliches, 1990). Furthermore, patents have been used as a count for renewable energy innovativeness before (Johnstone et al., 2009, Popp et al., 2011, Bointner, 2014). However, patent counts have certain shortcomings as a measure for innovativeness (Griliches, 1990). For example, not all inventions are patented and hence, patents cover not the entire innovation capability of the firm. Furthermore, the patenting behavior depends on the respective industry (Cohen and Levinthal, 1989). In this paper, patent applications are used as a measure for firms’ innovativeness. By doing so, the time difference between the actual invention and the external acceptance is reduced. Patent citation, which might allow evaluating inventions not only on a quantitative level, but also on a qualitative level, are excluded, as it would require in-depth knowledge about the respective technology (Hagedoorn and Cloodt, 2002).
For example, electric, gas, and water distribution companies, that do not only distribute renewable energy, but also conventional energy.
Independent variables
Technology versus non-technology M&A
Within a time frame of six years (2005-2010), the number of M&A initiated by renewable energy firms has been collected. These M&A are distinguished in technology and non-technology M&A. An M&A is considered to be technology motivated, if the number of acquired patents is greater than zero. A dummy variable was created to distinguish between technology and non-technology M&A.
Relatedness of target and acquirer
Depending on whether the target and acquirer have the same core business, M&A can be either related or unrelated. Research has shown that M&A in the renewable energy sector yield to a higher premium, if target and acquirer are both coming from the renewable energy sector (Yoo et al., 2013). Finkelstein and Haleblian (2002) found similar results on a more general level. The more the target fits into the strategic orientation of the firm, the higher the acquisition performance will be. The relatedness is measured in terms of industry relatedness. In other words, whether the primary SIC are identical.
Absolute acquired knowledge
Control Variables
Acquirer Nationality
On the one hand several studies have found a positive link between technology push policies or market pull polices and the patenting activities of firms in the renewable energy sector (Bointner, 2014, Klaassen et al., 2005, Wiesenthal et al., 2012). On the other hand governmental interventions can also have a negative impact on the innovativeness of the firm (Weiss and Bonvillian, 2013). In order to control for the link between country specific policies and the innovativeness of the firm, a dummy variable representing the different regions has been introduced.
Sub-Sector
The renewable energy sector is characterized by heterogeneity in the level of consolidation as well as technology development. Whereas wind and hydro have the highest level of market concentration, biomass and solar will most likely experience a high M&A activity in the near future (Eisenbach et al., 2011). Three generations of renewable energy exist: (1) mature technologies such as hydropower and thermal, (2) second-generation technologies, which are undergoing rapid changes, such as wind and solar, and (3) third generation technologies in early stages such as bio-energy systems and ocean energy (Johnstone et al., 2009). Therefore, the acquiring firms have been further distinguished according to their core business.
International M&A
Patent applications previous year
In order to account for the individual patenting behavior of each firm within the data set, the number of patent applications has been included as a control variable.
Years
A dummy variable has been introduced in order to control for the differences in patenting behavior in each year of the period.
3.3
Method and Model
Since patents are integer, non-negative values, the assumptions of normal distribution and homoscedasticity are violated (Long and Freese, 2006). Therefore, either a Poisson or Negative Binomial regression model has to be applied. A Poisson model, however, follows the restrictive assumption that 𝑉 𝑦 =𝐸 𝑦 = 𝜇, i.e. the variance equals the conditional mean. If this assumption does not hold, the data is over dispersed. Since individual counts are usually more variable than the Poisson model requires, over-dispersion is likely to occur (Gardner et al., 1995). The negative binomial regression model addresses these shortcomings by including a random effects component with an error term ε and by adding α to conditional mean 𝑉𝑎𝑟 𝑦! 𝑥 =𝜇! +𝛼𝜇!! (Long and Freese, 2006).
Moreover, the unit of analysis was analyzed in a period of six years. In other words, N observations of n individuals have been observed in T time periods. Therefore, a cross-sectional panel data model is applied.
intercept with the y-axis, the random effects model assumes that 𝛼! is independently
distributed of the predicted variables (Wooldridge, 2010). Like Cloodt et al. (2006), this thesis works with random effects and, hence, postulates that the individual effects 𝛼! are independent from the predicted variables.
Therefore, the following negative binomial regression is used:
𝑃!" =exp (𝑿!!"!!𝜸!+𝑨!!"!!𝜷′)
𝑃!" = 𝑛𝑢𝑚𝑏𝑒𝑟 𝑜𝑓 𝑝𝑎𝑡𝑒𝑛𝑡 𝑎𝑝𝑝𝑙𝑖𝑐𝑎𝑡𝑖𝑜𝑛 𝑜𝑓 𝑎𝑐𝑞𝑢𝑖𝑟𝑒𝑟 𝑖 𝑖𝑛 𝑦𝑒𝑎𝑟 𝑡
𝑿′!,!!! =𝑉𝑒𝑐𝑡𝑜𝑟 𝑜𝑓 𝐶𝑜𝑛𝑡𝑟𝑜𝑙 𝑉𝑎𝑟𝑖𝑎𝑏𝑙𝑒𝑠
𝜸! =𝑉𝑒𝑐𝑡𝑜𝑟 𝑜𝑓 𝑟𝑒𝑔𝑟𝑒𝑠𝑠𝑖𝑜𝑛 𝑐𝑜𝑒𝑓𝑓𝑖𝑐𝑖𝑒𝑛𝑡𝑠 𝑓𝑜𝑟 𝑡ℎ𝑒 𝑐𝑜𝑛𝑡𝑟𝑜𝑙 𝑣𝑎𝑟𝑖𝑎𝑏𝑙𝑒𝑠
𝑨!!"!! = 𝑉𝑒𝑐𝑡𝑜𝑟 𝑜𝑓 𝐼𝑛𝑑𝑒𝑝𝑒𝑛𝑑𝑒𝑛𝑡 𝑉𝑎𝑟𝑖𝑎𝑏𝑙𝑒𝑠
𝜷! =𝑉𝑒𝑐𝑡𝑜𝑟 𝑜𝑓 𝑟𝑒𝑔𝑟𝑒𝑠𝑠𝑖𝑜𝑛 𝑐𝑜𝑒𝑓𝑓𝑖𝑐𝑖𝑒𝑛𝑡𝑠 𝑓𝑜𝑟 𝑡ℎ𝑒 𝑖𝑛𝑑𝑒𝑝𝑒𝑑𝑒𝑛𝑡 𝑣𝑎𝑟𝑖𝑎𝑏𝑙𝑒
4
Results
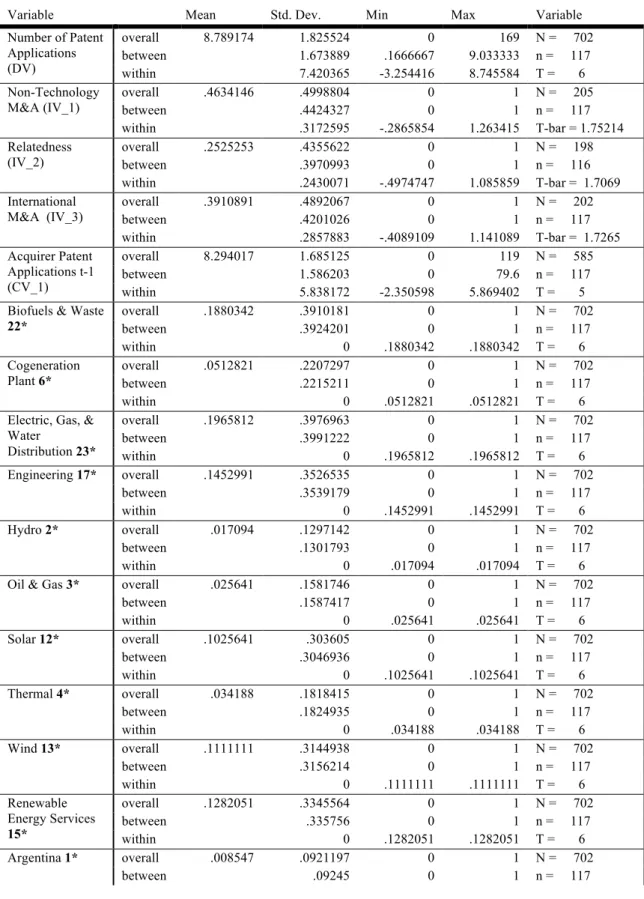
This paragraph shows and discusses the results of the negative binomial regression model of panel data starting with a model fit test. The summaries of the variables and the corresponding descriptive statistics are in Appendix 1.
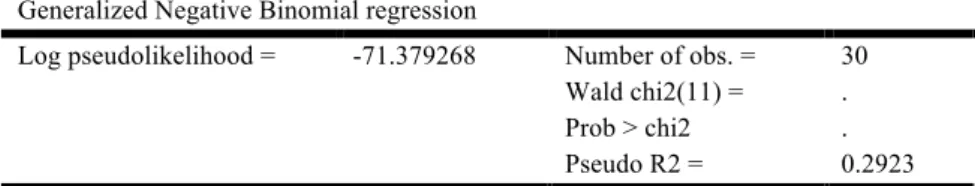
Appendix 2 provides a generalized negative binomial regression model for each year. In this way, one can see the large differences among the results of the years.
4.1
Model Fit
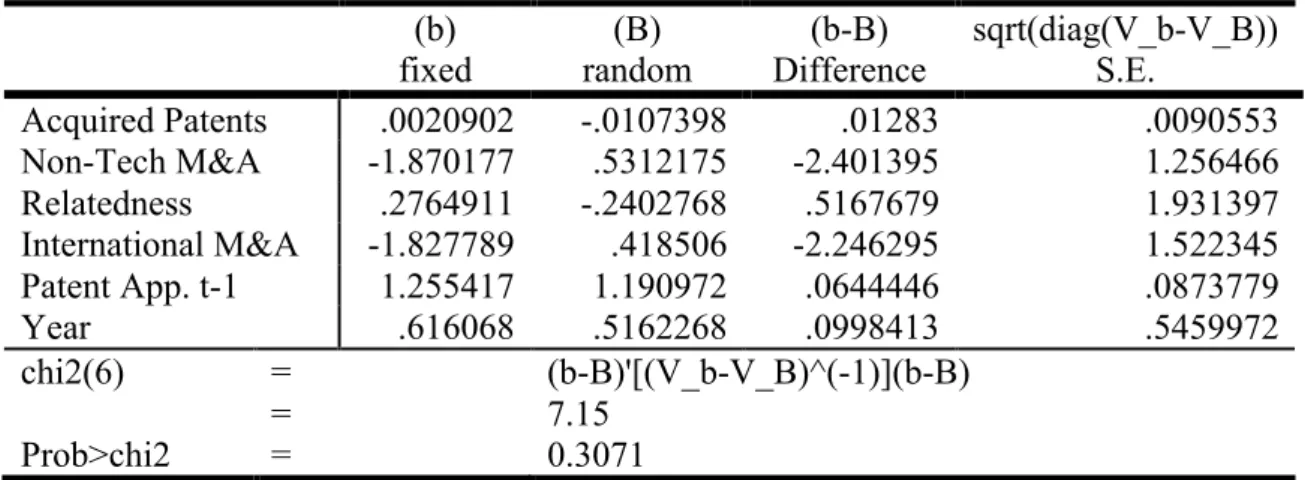
The Hausman test evaluates the consistency of the fixed effects model versus the random effects model. The test compares the regression coefficients of the random effects model (b) versus the random effects model (B). The H0 Hypothesis postulates
that the random effects model is consistent and efficient. In other words, the difference in coefficients is not systematic (Greene, 2012). Whereas (b) is consistent under H0 and
Ha, (B) is inconsistent under Ha and efficient under H0. Since Prob>chi2=0.3071, the
result is not significant. Hence, the H0 cannot be rejected and the random effects model
has to be applied. Table 1 shows the results of the Hausman test. Table 1: Hausman test: random vs. fixed effects model
(b) fixed
(B) random
(b-B) Difference
sqrt(diag(V_b-V_B)) S.E.
Acquired Patents .0020902 -.0107398 .01283 .0090553
Non-Tech M&A -1.870177 .5312175 -2.401395 1.256466
Relatedness .2764911 -.2402768 .5167679 1.931397
International M&A -1.827789 .418506 -2.246295 1.522345
Patent App. t-1 1.255417 1.190972 .0644446 .0873779
Year .616068 .5162268 .0998413 .5459972
chi2(6) = (b-B)'[(V_b-V_B)^(-1)](b-B)
= 7.15
4.2
Results Negative Binomial Regression
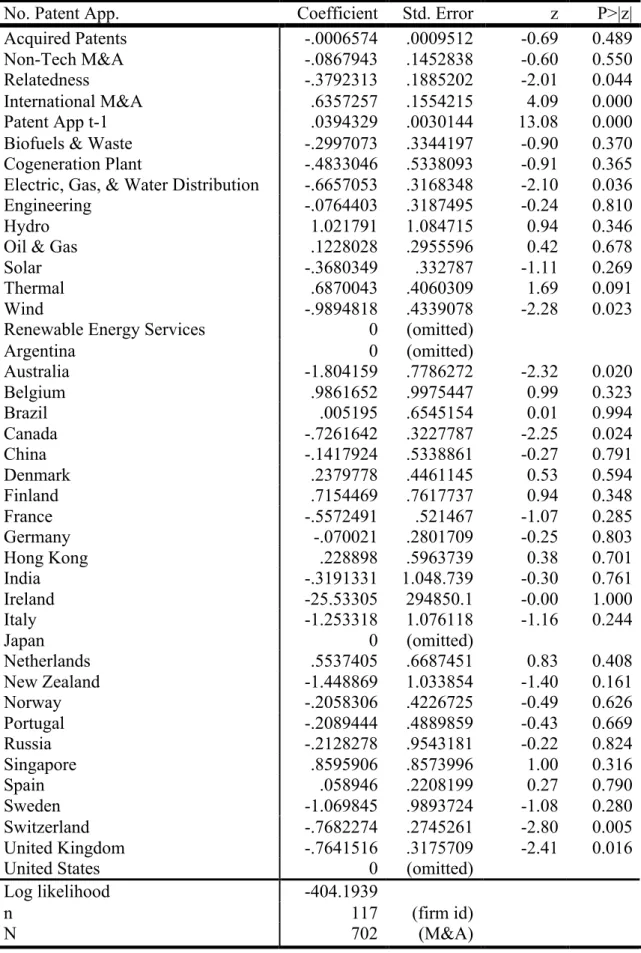
Table 2 shows the results of the random effects negative binomial regression. The data set is highly balanced, meaning that no company has entered or left during the time period under investigation.
Hypothesis 1 postulates that technology M&A will have either a negative or non-significant impact on post-merger innovative performance. If a target company has not applied for any patents in the 5 years prior the acquisition, the M&A is considered to be a non-technology M&A. The variable “Non-Tech M&A” shows a non-significant and negative value of -.0867943. Therefore, Hypothesis 1 is supported.
Hypothesis 2 argues that the absolute acquired knowledge has a positive impact on post-merger innovative performance. The absolute knowledge base was measured by the number of patent applications of the target in the 5 years prior the acquisition. The number of acquired patents is non-significant and marginally negative (-.0006574). Hence, Hypothesis 2 is rejected.
dependent variable positively and significantly. If a firm has already applied for patents in t-1, it will increase the patent application t by a factor of .0394329.
Dummies for the different countries have been included to account for the country-specific differences like governmental regulations in the energy sector. Australia, Canada, Switzerland, and United Kingdom are significant. Interestingly, all four countries have a negative impact on patent applications in the renewable energy sector (Australia: 1.804159; Canada: .7261642; Switzerland: .7682274; United Kingdom: -.7641516).
Subsector dummies control for the differences among the development stages of the different renewable energy areas. Among the ten defined subsectors, only Wind (-.9894818) and Electric, Gas, & Water Distribution (-.6657053) are significant.
Table 2: Negative Binomial Regression Model
No. Patent App. Coefficient Std. Error z P>|z|
Acquired Patents -.0006574 .0009512 -0.69 0.489
Non-Tech M&A -.0867943 .1452838 -0.60 0.550
Relatedness -.3792313 .1885202 -2.01 0.044
International M&A .6357257 .1554215 4.09 0.000
Patent App t-1 .0394329 .0030144 13.08 0.000
Biofuels & Waste -.2997073 .3344197 -0.90 0.370
Cogeneration Plant -.4833046 .5338093 -0.91 0.365
Electric, Gas, & Water Distribution -.6657053 .3168348 -2.10 0.036
Engineering -.0764403 .3187495 -0.24 0.810
Hydro 1.021791 1.084715 0.94 0.346
Oil & Gas .1228028 .2955596 0.42 0.678
Solar -.3680349 .332787 -1.11 0.269
Thermal .6870043 .4060309 1.69 0.091
Wind -.9894818 .4339078 -2.28 0.023
Renewable Energy Services 0 (omitted)
Argentina 0 (omitted)
Australia -1.804159 .7786272 -2.32 0.020
Belgium .9861652 .9975447 0.99 0.323
Brazil .005195 .6545154 0.01 0.994
Canada -.7261642 .3227787 -2.25 0.024
China -.1417924 .5338861 -0.27 0.791
Denmark .2379778 .4461145 0.53 0.594
Finland .7154469 .7617737 0.94 0.348
France -.5572491 .521467 -1.07 0.285
Germany -.070021 .2801709 -0.25 0.803
Hong Kong .228898 .5963739 0.38 0.701
India -.3191331 1.048.739 -0.30 0.761
Ireland -25.53305 294850.1 -0.00 1.000
Italy -1.253318 1.076118 -1.16 0.244
Japan 0 (omitted)
Netherlands .5537405 .6687451 0.83 0.408
New Zealand -1.448869 1.033854 -1.40 0.161
Norway -.2058306 .4226725 -0.49 0.626
Portugal -.2089444 .4889859 -0.43 0.669
Russia -.2128278 .9543181 -0.22 0.824
Singapore .8595906 .8573996 1.00 0.316
Spain .058946 .2208199 0.27 0.790
Sweden -1.069845 .9893724 -1.08 0.280
Switzerland -.7682274 .2745261 -2.80 0.005
United Kingdom -.7641516 .3175709 -2.41 0.016
United States 0 (omitted)
Log likelihood -404.1939
n 117 (firm id)
N 702 (M&A)
Table 3 provides a summary of the Hypotheses and the respective results of the negative binomial regression analysis. In summary, only hypothesis 1 could be supported. Interestingly, Hypothesis 2 was neither significant nor positive. Moreover, the negative binomial regression shows contrary and significant results for Hypothesis 3.
These findings suggest new and interesting rationales, which are discussed in the next paragraph.
Table 3: Summary of Hypothesis Tests
Hypotheses Description Results
Hypothesis 1
Non-technological acquisitions will have either a negative or a non-significant impact on the acquirer’s post-merger innovative performance.
insignificant negative supported
Hypothesis 2
The absolute knowledge base of the target company will have a positive impact on the
acquirer’s post-merger innovative performance.
insignificant negative rejected
Hypothesis 3
The relatedness between target and acquirer has positive impact on the acquirer’s post-merger innovative
performance.
5
Discussion and Conclusion
This study examined innovation in the renewable energy sector from a new perspective by discussing the influence of M&A on post-merger innovative performance. As M&A as well as innovation have become dominant and important topics in the discussion about sustainable and renewable energy generation, this study filled a research gap by investigating the relation between those two.
Three hypotheses, based on the studies of Ahuja and Katila (2001) and Cloodt et al. (2006) were investigated. First, the impact of technology versus non-technology M&A have been tested via Hypothesis 1. Second, the impact of the absolute acquired knowledge base was examined in Hypothesis 2. Third and last, Hypothesis 3 tested the relation between post-merger innovative performance and target and acquirer relatedness.
Although only Hypothesis 1 could be supported, the present thesis contributes some important insights to research. First, the negative and significant effect of non-technology M&A on post-merger innovative performance supports the assumption that M&A do not drive innovation per se. M&A can be driven by several motives and hence do not necessarily aim to increase the acquirer’s innovativeness (Hagedoorn, 1993). Moreover, the integration process of newly acquired firms requires a large amount of resources (Hitt et al., 1991). Putting the findings in the context of the sector, the starting consolidation of the renewable energy sector led increase the number of M&A (Eisenbach et al., 2011). Due to price decreases in sectors like wind and solar, corporate investors looked for external growth opportunities (UNEP-Center/BNEF, 2014).
acquired knowledge on the acquirer’s innovativeness, this work could not identify any significant relation.
As a third contribution, the thesis disproves the positive impact of relatedness on post-merger innovative performance in the renewable energy sector. Based on findings of Finkelstein and Haleblian (2002) and Yoo et al. (2013), Hypothesis 3 postulated a positive relation. In other words, due to economies of scale and scope, relatedness will eventually lead to a higher post-merger innovative performance than diversity. Conversely, the result recommends that new and diverse acquired knowledge will have a positive impact on the innovative performance of the acquiring firm. In this way the acquirer generates more room for learning (Bartlett, 1993).
The results of Hypotheses 2 and 3 reach the conclusion that not the quantity, but rather the diversity of the acquired knowledge contributes to the acquirer’s innovativeness. Disruptive or radical innovation creates new market structures, new market actor, new institutions and new socio-technical configurations (Markard and Truffer, 2008). Moreover, sustainable innovation, like the generation of energy from sustainable sources, is not limited to the development of clean technologies, but includes entire systems of production and consumption. This multi-level perspective asks companies to look for innovation in networks, new learning processes, knowledge infrastructure, and entrepreneurial capabilities (Smith et al., 2010).
Interestingly, the different subsectors show mostly insignificant results. Only the subsectors Wind and Electric, Gas & Water Distribution show significant but negative impact on the acquirer’s innovativeness. Like Yoo et al. (2013) pointed out, Electric, Gas & Water Distribution companies engage in renewable energy M&A in order to execute policies by external growth strategies than by internal innovative performance. For instance, Richter (2013) found out that Electric Distribution companies do not see the need to innovate yet.
The positive impact on international mergers further support the findings by Cloodt et al. (2006). Although the energy sector is still very national orientated (Klaassen et al., 2005, Lee and Zhong, 2014, Popp et al., 2011, Weiss and Bonvillian, 2013) the results suggest that a more international energy market enhances companies’ innovative performance.
6
Limitations and Suggestions for Future Research
The study suffers from certain limitations and provides suggestions for future research. The limitation of this work concerns the sample, the collected data, and the employed model.
First, the sample exclusively focused on acquirers that are clearly defined as renewable energy companies by the Primary SIC 499-A. As mentioned before, the change of an entire sector also attracts and creates new players. This restriction biased the sample towards energy generation and distribution companies. Eisenbach et al. (2011), for example, identified 26 different SIC Codes to be linked to renewable energy. Therefore, future research should extend the sample towards a broader definition and sample of renewable energy companies.
20 years (Bointner, 2014). Moreover, the renewable energy sector has just reached a consolidation stage. Only in 2004, M&A started to emerge in the renewable energy sector (UNEP-Center/BNEF, 2014). Thus, the available data is still very limited. In the next years, the data will certainly become more comprehensive, which will improve the data quality.
The applied model was a negative binomial regression model with a panel data set. The model used a time lag of one year in order to account for the time needed to transform the acquired knowledge into an innovation. However, the full extent of the influence of M&A on the post-merger innovative performance might become visible not only in year t+1, but also in the following years. Therefore, a model that applies different time lags could be used for future research purposes.
7
References
AHUJA, G. 2000. Collaboration networks, structural holes, and innovation: A longitudinal study. Administrative science quarterly, 45, 425-455.
AHUJA, G. & KATILA, R. 2001. Technological acquisitions and the innovation performance of acquiring firms: A longitudinal study. Strategic management journal, 22, 197-220.
BARNES, B., HARP, N. & OLER, D. 2011. Evaluating the SDC mergers and acquisitions database. Working paper, Texas Tech University.
BARNEY, J. 1991. Firm resources and sustained competitive advantage. Journal of management, 17, 99-120.
BARTLETT, C. A. 1993. Commentary: strategic flexibility, firm organization, and managerial work in dynamic markets. Advances in Strategic Management, 9, 293-298.
BOINTNER, R. 2014. Innovation in the energy sector: Lessons learnt from R&D expenditures and patents in selected IEA countries. Energy Policy, 73, 733-747. CASSIMAN, B., COLOMBO, M. G., GARRONE, P. & VEUGELERS, R. 2005. The
impact of M&A on the R&D process. Research Policy, 34, 195-220.
CHEN, H. H., LEE, A. H. I., XING, X. & CHEN, H. 2014. The relationships of different modes of international alliance with performance of renewable energy enterprises. Renewable Energy, 69, 464-472.
COHEN, W. M. & LEVINTHAL, D. A. 1989. Innovation and learning: the two faces of R & D. The economic journal, 569-596.
CORSATEA, T. D., GIACCARIA, S. & ARÁNTEGUI, R. L. 2014. The role of sources of finance on the development of wind technology. Renewable Energy, 66, 140-149.
DE MAN, A.-P. & DUYSTERS, G. 2005. Collaboration and innovation: a review of the effects of mergers, acquisitions and alliances on innovation. Technovation, 25, 1377-1387.
EISENBACH, S., ETTENHUBER, C., SCHIERECK, D. & VON FLOTOW, P. 2011. Beginning Consolidation in the Renewable Energy Industry and Bidders’ M & A-Success. Technology and Investment, 2, 81.
FINKELSTEIN, S. & HALEBLIAN, J. 2002. Understanding Acquisition Performance: The Role of Transfer Effects. Organization Science, 13, 36-47.
GARDNER, W., MULVEY, E. P. & SHAW, E. C. 1995. Regression analyses of counts and rates: Poisson, overdispersed Poisson, and negative binomial models. Psychological bulletin, 118, 392.
GREENE, W. H. 2012. Econometric analysis, Boston, MA [etc.], Pearson.
GRILICHES, Z. 1990. Patent statistics as economic indicators: a survey. Journal of economic literature, 28, 1661-1707.
HAGEDOORN, J. 1993. Understanding the rationale of strategic technology partnering: Nterorganizational modes of cooperation and sectoral differences. Strategic management journal, 14, 371-385.
HAGEDOORN, J. & DUYSTERS, G. 2002. External sources of innovative capabilities: the preferences for strategic alliances or mergers and acquisitions. Journal of management studies, 39, 167-188.
HITT, M. A., HOSKISSON, R. E., IRELAND, R. D. & HARRISON, J. S. 1991. Effects of acquisitions on R&D inputs and outputs. Academy of Management journal, 34, 693-706.
HITT, M. A., HOSKISSON, R. E., JOHNSON, R. A. & MOESEL, D. D. 1996. The market for corporate control and firm innovation. Academy of management journal, 39, 1084-1119.
IEA 2014. Renewables Information 2014, IEA.
JENSEN, M. C. & RUBACK, R. S. 1983. The market for corporate control: The scientific evidence. Journal of Financial economics, 11, 5-50.
JOHNSTONE, N., HAŠČIČ, I. & POPP, D. 2009. Renewable Energy Policies and
Technological Innovation: Evidence Based on Patent Counts. Environmental and Resource Economics, 45, 133-155.
KLAASSEN, G., MIKETA, A., LARSEN, K. & SUNDQVIST, T. 2005. The impact of R&D on innovation for wind energy in Denmark, Germany and the United Kingdom. Ecological Economics, 54, 227-240.
LEE, C. W. & ZHONG, J. 2014. Top down strategy for renewable energy investment: Conceptual framework and implementation. Renewable Energy, 68, 761-773. LONG, J. S. & FREESE, J. 2006. Regression models for categorical dependent
variables using Stata, Stata press.
MITCHELL, M. L. & MULHERIN, J. H. 1996. The impact of industry shocks on takeover and restructuring activity. Journal of financial economics, 41, 193-229. POPP, D., HASCIC, I. & MEDHI, N. 2011. Technology and the diffusion of renewable
energy. Energy Economics, 33, 648-662.
POWELL, W. W., KOPUT, K. W. & SMITH-DOERR, L. 1996. Interorganizational collaboration and the locus of innovation: Networks of learning in biotechnology. Administrative science quarterly, 116-145.
RICHTER, M. 2013. German utilities and distributed PV: How to overcome barriers to business model innovation. Renewable Energy, 55, 456-466.
SCHERER, F. M. & ROSS, D. R. 1990. Industrial market structure and economic performance, Boston, Mass., [etc.], Houghton Mifflin.
SMITH, A., VOS, J.-P. & GRIN, J. 2010. Innovation studies and sustainability transitions: the allure of the multi-level perspective and its challenges. Research policy, 39, 435-448.
UNEP-CENTER/BNEF, F. S. 2014. Global Trends in Renewable Energy Investment 2014. In: ANGUS MCCRONE (LEAD AUTHOR, C. E., ERIC USHER (LEAD EDITOR), VIRGINIA SONNTAG-O'BRIEN, ULF MOSLENER (LEAD EDITOR), CHRISTINE GRÜNING (ed.). Frankfurt am Main.
VEEFKIND, V., HURTADO-ALBIR, J., ANGELUCCI, S., KARACHALIOS, K. & THUMM, N. 2012. A new EPO classification scheme for climate change mitigation technologies. World Patent Information, 34, 106-111.
WIESENTHAL, T., MERCIER, A., SCHADE, B., PETRIC, H. & DOWLING, P. 2012. A model-based assessment of the impact of revitalised R&D investments on the European power sector. Renewable and Sustainable Energy Reviews, 16, 105-112.
WOOLDRIDGE, J. M. 2010. Econometric analysis of cross section and panel data, MIT press.
8
Appendices
8.1
Appendix 1: Descriptive Statistics and Variable Summary
Table 4: Descriptive Statistics
Variable Mean Std. Dev. Min Max Variable
Number of Patent Applications (DV)
overall 8.789174 1.825524 0 169 N = 702 between 1.673889 .1666667 9.033333 n = 117 within 7.420365 -3.254416 8.745584 T = 6 Non-Technology
M&A (IV_1)
overall .4634146 .4998804 0 1 N = 205 between .4424327 0 1 n = 117 within .3172595 -.2865854 1.263415 T-bar = 1.75214 Relatedness
(IV_2)
overall .2525253 .4355622 0 1 N = 198 between .3970993 0 1 n = 116 within .2430071 -.4974747 1.085859 T-bar = 1.7069 International
M&A (IV_3)
overall .3910891 .4892067 0 1 N = 202 between .4201026 0 1 n = 117 within .2857883 -.4089109 1.141089 T-bar = 1.7265 Acquirer Patent
Applications t-1 (CV_1)
overall 8.294017 1.685125 0 119 N = 585 between 1.586203 0 79.6 n = 117 within 5.838172 -2.350598 5.869402 T = 5 Biofuels & Waste
22*
overall .1880342 .3910181 0 1 N = 702 between .3924201 0 1 n = 117 within 0 .1880342 .1880342 T = 6 Cogeneration
Plant 6*
overall .0512821 .2207297 0 1 N = 702 between .2215211 0 1 n = 117 within 0 .0512821 .0512821 T = 6 Electric, Gas, &
Water
Distribution 23*
overall .1965812 .3976963 0 1 N = 702 between .3991222 0 1 n = 117 within 0 .1965812 .1965812 T = 6 Engineering 17* overall .1452991 .3526535 0 1 N = 702
between .3539179 0 1 n = 117 within 0 .1452991 .1452991 T = 6 Hydro 2* overall .017094 .1297142 0 1 N = 702
between .1301793 0 1 n = 117 within 0 .017094 .017094 T = 6 Oil & Gas 3* overall .025641 .1581746 0 1 N = 702
between .1587417 0 1 n = 117 within 0 .025641 .025641 T = 6 Solar 12* overall .1025641 .303605 0 1 N = 702
between .3046936 0 1 n = 117 within 0 .1025641 .1025641 T = 6 Thermal 4* overall .034188 .1818415 0 1 N = 702
between .1824935 0 1 n = 117 within 0 .034188 .034188 T = 6 Wind 13* overall .1111111 .3144938 0 1 N = 702
between .3156214 0 1 n = 117 within 0 .1111111 .1111111 T = 6 Renewable
Energy Services
15*
overall .1282051 .3345564 0 1 N = 702 between .335756 0 1 n = 117 within 0 .1282051 .1282051 T = 6 Argentina 1* overall .008547 .0921197 0 1 N = 702
within 0 .008547 .008547 T = 6 Australia 3* overall .025641 .1581746 0 1 N = 702
between .1587417 0 1 n = 117 within 0 .025641 .025641 T = 6 Belgium 1* overall .008547 .0921197 0 1 N = 702
between .09245 0 1 n = 117 within 0 .008547 .008547 T = 6 Brazil 1* overall .008547 .0921197 0 1 N = 702
between .09245 0 1 n = 117 within 0 .008547 .008547 T = 6 Canada 13* overall .1111111 .3144938 0 1 N = 702
between .3156214 0 1 n = 117 within 0 .1111111 .1111111 T = 6 China 4* overall .034188 .1818415 0 1 N = 702
between .1824935 0 1 n = 117 within 0 .034188 .034188 T = 6 Denmark 1* overall .008547 .0921197 0 1 N = 702
between .09245 0 1 n = 117 within 0 .008547 .008547 T = 6 Finland 2* overall .017094 .1297142 0 1 N = 702
between .1301793 0 1 n = 117 within 0 .017094 .017094 T = 6 France 3* overall .025641 .1581746 0 1 N = 702
between .1587417 0 1 n = 117 within 0 .025641 .025641 T = 6 Germany 8* overall .0683761 .2525701 0 1 N = 702
between .2534757 0 1 n = 117 within 0 .0683761 .0683761 T = 6 Hong Kong 2* overall .017094 .1297142 0 1 N = 702
between .1301793 0 1 n = 117 within 0 .017094 .017094 T = 6 India 3* overall .025641 .1581746 0 1 N = 702
between .1587417 0 1 n = 117 within 0 .025641 .025641 T = 6 Ireland 2* overall .017094 .1297142 0 1 N = 702
between .1301793 0 1 n = 117 within 0 .017094 .017094 T = 6 Italy 3* overall .025641 .1581746 0 1 N = 702
between .1587417 0 1 n = 117 within 0 .025641 .025641 T = 6 Japan 1* overall .008547 .0921197 0 1 N = 702
between .09245 0 1 n = 117 within 0 .008547 .008547 T = 6 Netherlands 1* overall .008547 .0921197 0 1 N = 702
between .09245 0 1 n = 117 within 0 .008547 .008547 T = 6 New Zealand 1* overall .008547 .0921197 0 1 N = 702
between .09245 0 1 n = 117 within 0 .008547 .008547 T = 6 Norway 3* overall .025641 .1581746 0 1 N = 702
between .1587417 0 1 n = 117 within 0 .025641 .025641 T = 6 Portugal 2* overall .017094 .1297142 0 1 N = 702
within 0 .008547 .008547 T = 6 Singapore 1* overall .008547 .0921197 0 1 N = 702
between .09245 0 1 n = 117 within 0 .008547 .008547 T = 6 Spain 14* overall .1196581 .3247927 0 1 N = 702
between .3259573 0 1 n = 117 within 0 .1196581 .1196581 T = 6 Sweden 2* overall .017094 .1297142 0 1 N = 702
between .1301793 0 1 n = 117 within 0 .017094 .017094 T = 6 Switzerland 4* overall .034188 .1818415 0 1 N = 702
between .1824935 0 1 n = 117 within 0 .034188 .034188 T = 6 United Kingdom
7*
overall .0598291 .237339 0 1 N = 702 between .23819 0 1 n = 117 within 0 .0598291 .0598291 T = 6 United States 33* overall .2820513 .450319 0 1 N = 702
between .4519337 0 1 n = 117 within 0 .2820513 .2820513 T = 6 Year Dummies
(2006-2011)
8.2
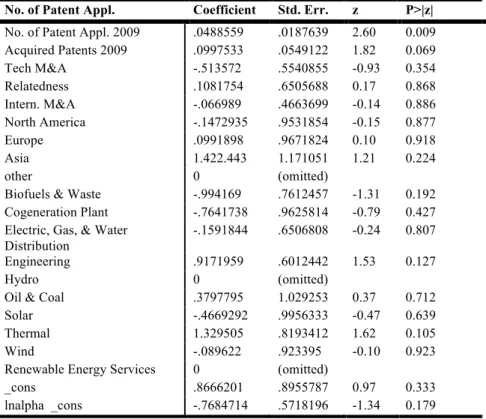
Appendix 2: Negative Binomial Regression for 2007-2011
Table 5: Negative Binomial Regression 2007
Generalized Negative Binomial regression
Log pseudolikelihood = -79.185.088 Number of obs. = 34 Wald chi2(11) = . Prob > chi2 . Pseudo R2 = 0.1790
No. of Patent Appl. Coefficient Std. Err. z P>|z|
No. of Patent Appl. 2006 .0815309 .0348355 2.34 0.019 Acquired Patents 2006 .0066708 .0217424 0.31 0.759 Tech M&A .1589918 .4081712 0.39 0.697 Relatedness -2.670808 . . . Intern. M&A .1810632 .5215958 0.35 0.728 North America -.3882104 .4824694 -0.80 0.421 Europe -.1424418 .6038029 -0.24 0.814 Asia -1.051866 .9232505 -1.14 0.255 Biofuels & Waste 1.156746 .8018064 1.44 0.149 Cogeneration Plant 0 (omitted)
Electric, Gas & Water Distribution
-.1351701 .5913847 -0.23 0.819
Engineering .8000677 .4922825 1.63 0.104 Hydro 0 (omitted)
Oil & Coal 0 (omitted)
Solar -2.280.848 . . . Thermal 1.366.852 .6878258 1.99 0.047 Wind 1.170.245 .7472857 1.57 0.117 Renewable Energy Services 0 (omitted)
Table 6: Negative Binomial Regression 2008
Generalized Negative Binomial regression
Log pseudolikelihood = -71.379268 Number of obs. = 30 Wald chi2(11) = . Prob > chi2 . Pseudo R2 = 0.2923
No. of Patent Appl. Coefficient Std. Err. z P>|z|
No. of Patent Appl. 2007 .0638811 .0055975 11.41 0.000 Acquired Patents 2007 .032604 .0136548 2.39 0.017 Tech M&A -.2548574 .1912431 -1.33 0.183 Relatedness -1.462.789 .8488755 -1.72 0.085 Intern. M&A -.5654504 .3870667 -1.46 0.144 North America .2364361 .9101398 0.26 0.795 Europe .991812 .8011669 1.24 0.216 Asia -4.285.162 . . . Biofuels & Waste .5304985 .4738508 1.12 0.263 Cogeneration Plant 0 (omitted)
Electric, Gas & Water Distribution
-.1034808 .1184759 -0.87 0.382
Engineering -.0375346 .3260765 -0.12 0.908 Hydro 0 (omitted)
Oil & Coal 1.296446 .711569 1.82 0.068 Solar .9559996 .4216629 2.27 0.023 Thermal 1.775.728 .461794 3.85 0.000 Wind 0 (omitted)
Renewable Energy Services 0 (omitted)
Table 7: Negative Binomial Regression 2009
Generalized Negative Binomial regression
Log pseudolikelihood = -91.91055 Number of obs. = 37 Wald chi2(11) = . Prob > chi2 . Pseudo R2 = 0.1893
No. of Patent Appl. Coefficient Std. Err. z P>|z|
No. of Patent Appl. 2008 .0484138 .007493 6.46 0.000 Acquired Patents 2008 -.0028679 .0010863 -2.64 0.008 Tech M&A .2404512 .3684114 0.65 0.514 Relatedness -.1528277 .3715658 -0.41 0.681 Intern. M&A .7279959 .4494765 1.62 0.105 North America 1.441591 1.079993 1.33 0.182 Europe 1.107821 1.031346 1.07 0.283 Asia 0 (omitted)
other 0 (omitted)
Biofuels & Waste -.5573162 .7748386 -0.72 0.472 Cogeneration Plant .2980471 .4398426 0.68 0.498 Electric Gas, & Water
Distribution
.1503559 .325968 0.46 0.645
Engineering 1.606961 .5000349 3.21 0.001 Hydro 0 (omitted)
Oil & Coal 1.296446 .711569 1.82 0.068 Solar .9559996 .4216629 2.27 0.023 Thermal 0 (omitted)
Wind .2669517 .4960319 0.54 0.590 Renewable Energy Services 0 (omitted)
Table 8: Negative Binomial Regression 2010
Generalized Negative Binomial regression
Log pseudolikelihood = -83.183848 Number of obs. = 35 Wald chi2(11) = . Prob > chi2 . Pseudo R2 = 0.2100
No. of Patent Appl. Coefficient Std. Err. z P>|z|
No. of Patent Appl. 2009 .0488559 .0187639 2.60 0.009 Acquired Patents 2009 .0997533 .0549122 1.82 0.069 Tech M&A -.513572 .5540855 -0.93 0.354 Relatedness .1081754 .6505688 0.17 0.868 Intern. M&A -.066989 .4663699 -0.14 0.886 North America -.1472935 .9531854 -0.15 0.877 Europe .0991898 .9671824 0.10 0.918 Asia 1.422.443 1.171051 1.21 0.224 other 0 (omitted)
Biofuels & Waste -.994169 .7612457 -1.31 0.192 Cogeneration Plant -.7641738 .9625814 -0.79 0.427 Electric, Gas, & Water
Distribution
-.1591844 .6506808 -0.24 0.807
Engineering .9171959 .6012442 1.53 0.127 Hydro 0 (omitted)
Oil & Coal .3797795 1.029253 0.37 0.712 Solar -.4669292 .9956333 -0.47 0.639 Thermal 1.329505 .8193412 1.62 0.105 Wind -.089622 .923395 -0.10 0.923 Renewable Energy Services 0 (omitted)
Table 9: Negative Binomial Regression 2011
Generalized Negative Binomial regression
Log pseudolikelihood = -108.46501 Number of obs. = 45 Wald chi2(11) = . Prob > chi2 . Pseudo R2 = 0.2248
No. of Patent Appl. Coefficient Std. Err. z P>|z|
No. of Patent Appl. 2010 .0448611 .007957 5.64 0.000 Acquired Patents 2010 .0058348 .0032227 1.81 0.070 Tech M&A .5730087 .3521026 1.63 0.104 Relatedness 1.333.138 .437296 3.05 0.002 Intern. M&A .8815738 .5131015 1.72 0.086 North America -1.061.678 .7072124 -1.50 0.133 Europe -1.881.362 .8845018 -2.13 0.033 Asia -.9392362 .5541332 -1.69 0.090 other 0 (omitted)
Biofuels & Waste 1.533.671 .9228676 1.66 0.097 Cogeneration Plant 1.263.516 .9911179 1.27 0.202 Electric, Gas, & Water
Distribution
.6511862 .5537209 1.18 0.240
Engineering 2.486.163 .7760621 3.20 0.001 Hydro 1.325.375 .804272 1.65 0.099 Oil & Coal 3.538.392 .9246241 3.83 0.000 Solar 1.120.303 .6885398 1.63 0.104 Thermal .2123665 .8257618 0.26 0.797 Wind .9893356 .6477819 1.53 0.127 Renewable Energy Services 0 (omitted)