MASTER IN FINANCE
MASTER FINAL WORK
DISSERTATION
FINANCIAL PERFORMANCE IN PORTUGUESE CREATIVE INDUSTRIES AND
MACROECONOMIC FLUCTUATIONS: A FIRM-BASED ANALYSIS (2004-2011)
AUTHOR: MARIANA SERRAS CELORICO DA SILVA FIALHO
1
MASTER IN FINANCE
MASTER FINAL WORK
DISSERTATION
FINANCIAL PERFORMANCE IN PORTUGUESE CREATIVE INDUSTRIES AND
MACROECONOMIC FLUCTUATIONS: A FIRM-BASED ANALYSIS (2004-2011)
AUTHOR: MARIANA SERRAS CELORICO DA SILVA FIALHO
SUPERVISOR: ELSA MARIA NOBRE DA SILVA FONTAINHA
2
Abstract
The present study assesses the financial performance of the Portuguese Creative Industries and their contribution to the development of the global and local economy and job creation. After the presentation and discussions of the significant literature, the empirical hypothesis were tested based on SCIE microdata for the period of 2004-2011 which covers a large number of firms during this period (N=19,464).
The empirical results suggest that the performance of the firms that belongs to the Cultural and Creative Industries are allied to the macroeconomic context which influences their appearance as well the firm’s survival. Indeed, these firms tend to develop
their activities on favorable periods, otherwise they slow down and in extreme cases they declared the end of their activities (death). Besides of the effects of the business cycle, the access to finance also impact the financial performance of these firms. As being mostly micro-enterprises these firms are subject to financial dependence to develop their activities. We also found that Portuguese Cultural and Creative Industries has an important role on the economy growth and job creation, which justifies the European policy makers and national governments attention. In a regional perspective, the firms of Cultural and Creative Industries have a clear tendency to locate near to the large urban zones (Lisbon Metropolitan Area and North) benefiting from the urbanized economies.
Keywords: Cultural and Creative Industries; macroeconomic context; survival analysis; government subsidies; financial performance.
3
Resumo
O presente estudo investiga o desempenho financeiro das Indústrias Criativas portuguesas e o seu contribuito para o desenvolvimento global e local da economia bem como a criação de emprego. Após a apresentação e discussão da literatura relevante, foram testadas hipóteses empíricas com base nos microdados SCIE para o período de 2004-2011, abrangendo um elevado número de empresas durante este período (N=19.464).
Os resultados empíricos sugerem que o desempenho destas empresas estão relacionados com o contexto macroeconómico que, por sua vez, influencia tanto o aparecimento como a sobrevivência das mesmas. De facto, estas empresas desenvolvem as suas actividades nos períodos mais favoráveis, sendo que, em caso contrário tendem a diminuir as a suas actividades atingindo, por vezes, situações extremas (encerram). Para além dos efeitos do ciclo macroeconómico, o acesso ao financiamento também tem impacto no seu desempenho financeiro. Sendo a sua maioria microempresas, estas estão sujeitas a uma grande dependência financeira para desenvolver as suas atividades. Podemos também constatar que estas empresas têm um papel importante no crescimento da economia e na criação de emprego, justificando a atenção dos European policy makers
e dos respectivos governos nacionais. Numa perspectiva regional, estas empresas tendem a concentrarem-se perto das grandes zonas urbanas (Área Metropolitana de Lisboa e Norte), beneficiando das economias urbanizadas.
Palavras-chave: Indústrias Culturais e Criativas; Contexto Macroeconómico; Análise de Sobrevivência; Subsídios Governamentais; Desempenho Financeiro.
4
Index
Abstract ... 2
Resumo ... 3
Appendix Index ... 5
Introduction ... 8
1. Creative Industries ... 11
1.1. Definition of Creative Industries ... 11
1.2. The Moving Boundary Between Creative and Cultural Industries ... 16
2. Literature Review ... 18
2.1. Business Cycle Effects on the Financial Economic Performance of Creative Industries and Survival Analysis... 18
2.1.1. Business Cycle and Creative Firms Financial Performance ... 18
2.1.2. Business Cycle and Creative Firm Survival ... 21
2.2. Public Policies and Subsidies Effects on Financial Performance of Creative Industries ... 23
2.3. Creative Industries Role on the Global and Local Economic Growth and Job Creation 27 2.4. Dynamic of Regional Specialization of Creative Industries ... 29
3. Empirical Study of Creative Industries Sector in Portugal... 31
3.1. Data Source and Sample Selection ... 31
5
4. Results and Discussion ... 35
4.1. Business Cycle and CCI Firms’ Performance ... 35
4.2. Government Funding and CCI Firms’ Performance and Survival ... 37
4.3. CCI Firms Contribution to Employment and Growth ... 39
4.4. Spatial Location of CCI and Regional Development ... 41
5. Conclusions and Future Research ... 42
References ... 48
Appendix ... 54
Appendix Index TABLE A.I CCI BY FIRMS’ SIZE CATEGORIES (2004-2011)... 54
TABLE A.IICCI BY CREATIVE FUNCTIONS(2004-2011) ... 54
TABLE A.III CULTURAL CREATIVE ACTIVITIES WITH CAE REV.3 CLASSES BY FUNCTIONS ... 55
TABLEA.IVAVERAGESIZEOFBORN,DEATH&CONTINUINGFIRMS(2004-2011) ... 55
TABLEA.VRELATIVESIZEOFBORNANDDEATHFIRMS(2004-2011) ... 56
TABLE A.VI AVERAGE AND RELATIVE SIZE OF BORN AND DEATH FIRMS ACCORDINGTOREALGDPGROWTHRATE ... 56
FIGUREB.IPORTUGUESEREALGDPGROWTHRATE(2004-2014) ... 56
FIGUREB.IIPORTUGUESEUNEMPLOYMENTRATECHANGE(2004-2014) ... 57
TABLEA.VIIENTRYANDEXITRATESACCORDINGTOCYCLICALINDICATORS ... 57
6
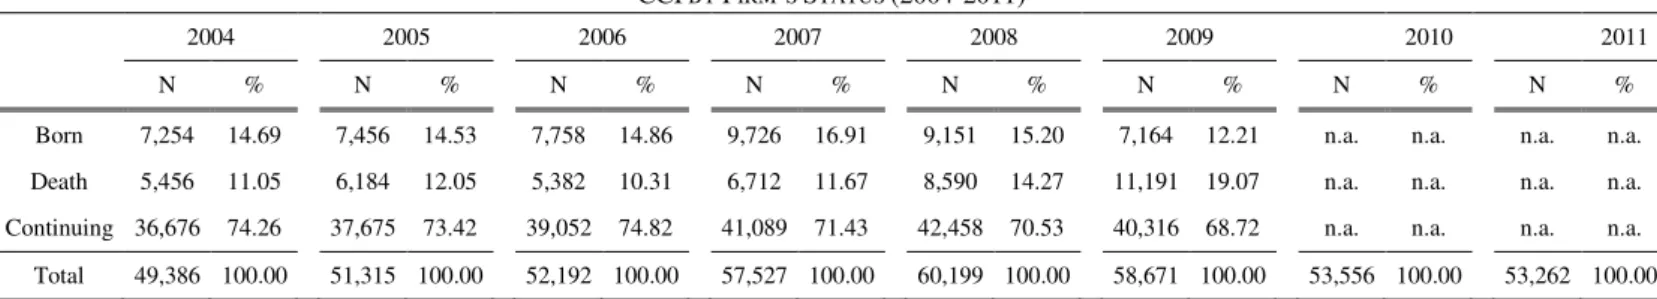
TABLEA.IXCCIBYFIRM’SSTATUS(2004-2011) ... 59
FIGURESB.IIIKAPLAN-MEIERSURVIVALESTIMATES(FIRMSBORNIN2004;N=7,254) ... 59
FIGURESB.IVKAPLAN-MEIERSURVIVALESTIMATES(FIRMSBORNIN2005;N=7,456) ... 59
FIGURESB.VKAPLAN-MEIERSURVIVALESTIMATES(FIRMSBORNIN2006,N=7,758) ... 59
FIGURESB.VIPERCENTAGEOFCCIFIRMSONBUSINESSCYCLE(2004-2011) ... 60
TABLEA.XAVERAGEOFFINANCIALTRANSFERSBYCREATIVEFUNCTIONS (2004-2011)... 60
TABLEA.XIAVERAGEOFFINANCIALTRANSFERSBYREGIONS(2004-2011) ... 60
TABLEA.XIISTATISTICS(2004-2011) ... 61
FIGURESB.VIIDESCRIPTIVEANALYZE OFTHESUBSIDIESANDTAXES(2004-2011) ... 61
TABLEA.XIIIANOVA-TESTBYCREATIVEFUNCTIONS(2004-2011) ... 62
TABLEA.XIVANOVA-TESTBYFIRMS’SIZECATEGORIES(2004-2011) ... 62
TABLEA.XVANOVA-TESTBYREGIONS(2004-2011) ... 62
TABLEA.XVIWEIGHTOFCREATIVEFUNCTIONSBYREGIONS(2004-2011)... 63
Acronyms
CAE – Classificação das Actividades Económicas
CCI – Cultural and Creative Industries
7
ESSnet-Culture – European Statistical System Network on Culture
GDP – Gross Domestic Product GVA – Gross Value Added
KEA – KEA European Affairs
OCDE –Organização para a Cooperação e Desenvolvimento Económico
OECD – Organization for Economic Cooperation and Development
SCIE –Sistema de Contas Integradas das Empresas
SIC – Standard Industrial Classification
UNCTAD – United Nations Conference on Trade and Development
UNESCO – United Nations Educational, Scientific and Cultural Organization
Acknowledgements
8
Introduction
The creative and cultural industries are a fairly under-researched sector (Chaston & Sadler-Smith, 2012) nevertheless since the beginning of the 2000s there were a growing consideration by the European policy makers due to the positive economic development of this sector (European Commission, 2013; Mateus, 2013 and 2010).
The Cultural and Creative Industries (CCI) present specific characteristics related to: (i) their intrinsic features (e.g. high weight of intangible assets, extremely dependent on internal demand); (ii) business composition (e.g. firm’s size, high dependence on public funding, shortage of business managerial skills; and (iii) market conditions (e.g.
small market size, specific location) (European Commission, 2013). Some of these
features impact negatively on the access to finance, being the size dimension the principal barrier (Beck & Demirguc-Kunt, 2006) and information asymmetry the main reason of this problem (European Commission, 2013).
9
The present research follows as key definition and composition of the cultural sector the adopted in the EC report ESSnet-Culture Final Report (Bina et al., 2012) which
defines cultural activities as “all types of activities based on cultural values and/or artistic expressions”, which includes “market- or non-market-orientated activities, with or without a commercial meaning and carried out by any type of producers and structure (individuals, organizations, business, groups, amateurs or professionals)” (Bina et al., 2012 – pp. 57). Delimitation and classification of this sector is still a matter with a lack of consensus (Cruz & Teixeira, 2015), despite of the effort to conciliate distinct definitions (Flew & Cunningham, 2010).
10
appraise different definitions of this sector by using the employment rate of the core creative industries’ activities.
This dissertation focus on financial performance of firms which are operating in creative industries sector between 2004 and 2011 and contributes to the increase of the knowledge about CCI in general and in Portugal through different ways: (i) studying the financial performance of the private firms in the sector and the relation to the business cycle which is done for the first time, as far as we know; (ii) determined the impact of the subsidies on the duration of the CCI through a survival analyze, which also represents a debut for this sector in Portugal in our field of knowledge; (iii) analyzing the relevance of subsidies a public transfers to the economic and financial performance of the sector; (iv) measuring the contribution of the sector for employment and regional development; (v) making a profound research concerning the definition, delimitation and characterization of the cultural and creative sector in the Portuguese case.
The empirical study are based on the Sistema de Contas Integradas das Empresas
(SCIE) accounting firm-level microdata and for the period between 2004 and 2011, considering both a larger sample of CCI firms including micro firms (N = 19,464) and a smaller sample (N = 1,431). The empirical strategy is organized around five hypotheses drawn for the performance and role of Portuguese creative industry sector: Hypothesis 1: The business cycle affect the size and financial performance in creative industries.;
Hypothesis 2: The creative firms’ survival is affected by the business cycle and the
government funds or subsidies are crucial to their survival.; Hypothesis 3: There are
different sources which finance CCI development and the public funding is the CCI’
development booster.; Hypothesis 4: The creative industries contribute positively to the
11
The clusters of industries are geographically distributed according each sub-sector
characteristics.
This thesis is divided in five sections. On the first section are presented and
discussed the definitions of the creative industries adopting different criteria and categorization. In the second section, a literature review regarding to this type of
industries is presented. In this part we putted together all the important approaches that are relevant to go ahead with the empirical component of this research. The third section
is related to the empirical analyze of creative industries in Portugal. This part corresponds to the data sources, the characterization of the sector and its evolution and designs the empirical strategy. The fourth section shows and discusses the empirical results organized
according the 5 research hypotheses. Finally, in the last section the conclusions are
presented and some lines for a future research agenda are enounced.
1. Creative Industries
1.1. Definition of Creative Industries
12
industries, has been emerging to a consensus (Bina et al., 2012; Flew & Cunningham, 2010). Then it will be briefly presented the six different studies, which display different concepts, criteria and methodologies concerning to the delimitation of the Creative and Cultural Sector.
ESSnet on Culture Statistics 2009-2011
The European Statistical System Network on Culture developed at Eurostat consists on statistical framework built with the aim to harmonize the European statistics on Cultural and Creative Sector providing reliable comparisons at a European level. To make this real it was produced a guideline for the states embraced to this framework to treat similarly the collection of cultural data (Bina et al., 2012). The delimitation of the Cultural and Creative Sector is organized according to ten cultural domains and six functions taking into account several aspects of culture (e.g. economic, social and some other aspects linked to audience, consumption and financing) (Bina et al., 2012).
The ten cultural domains are: Heritage; Archives; Libraries; Book & Press; Visual arts; Performing arts; Audiovisual & Multimedia; Architecture; Advertising and Art crafts. The six functions correspond to Creation, Production/Publishing, Dissemination/Trade, Preservation, Education and Management/Regulation (Table I, Appendix). According to this study, the delimitation of the cultural and creative sector includes 29 fields with 4 digit code adopting the Portuguese Classification of Economic Activities the Classificação das Actividades Económicas – Rev. 3 (CAE – Rev. 3) (INE,
13
European Cultural Foundation
The European Cultural Foundation published “The “Creative Sector” – An Engine for Diversity, Growth and Jobs in Europe” (Wiesand & Soendermann, 2005) and established that all the private and public activities related to the culture should be include to the CCI concept. Nevertheless, it does not present a clear distinction between cultural sector and creative sector. It includes arts, media and heritage activities connected with both public and private organizations and also comprises bordering activities such as design, architecture, cultural tourism and to the production of musical instruments. The classification adopted excludes from CCI other activities like advertising and software. This study also presents some actions that could be made to promote the development of these activities in order to contribute to the growth of GDP and to the job creation.
European Commission (KEA)
14
Department for Culture, Media and Sports (DCMS)
In 1998, the DCMS published “The Creative Industries Task Force and Mapping Documents” in UK, and was the pioneer on the identification of the creative industries as the sector that promote an important contribution to the economic growth and development. In DCMS (1998) it was not clear the identification and categorization of the distinct creative activities. Although, there are a continue development of its designation keeping up the economic and technologic evolution. Therefore, the concept of creative industries was not well-marked. Later, the DCMS (2007) published a follow-up study of the previous one and also inspired on the KEA (2006) report for the European Commission. The DCMS (2007) displays a classification of the creative activities with 13 categories such as advertising, architecture, visual arts (arts and antiques market and crafts), design, fashion, film and video, music, performing arts, publishing, software, television and radio, video and computer games, excluding property, cultural tourism and sports. A recent study, “Creative Industry Performance – A statistical analysis for the DCMS” (Economics, 2007) brought a new statistical update of the delimitation of creative industries without changing the concept previously presented by DCMS (2007). It considers 5 digits of SIC (Standard Industrial Classification) instead of 4. The five digit
15
leisure software with software and computer services and music with performing arts (DCMS, 2009).
OCDE
The “International Measurement of the Economic and Social Importance of Culture” (Gordon & Beilby-Orrin, 2007) addresses the OCDE classification methodology, which is based on a review of the limitation of the international methodologies, namely those full-blown by UNESCO and Eurostat-LEG. The OCDE methodology focuses mainly on both the implementation of a regular data system and the production of international reliable statistics to allow international comparisons between several subsectors of the Creative Industry. The production of statistical data has been made based on a remarkable effort to standardize the distinct methodologies employed by different statistical systems. In order to produce comparable internationally statistics there are necessary adjustments on national statistics. The combination of the two methodologies employed in UK (DCMS) and Canada, was the first step to delimitate the cultural sector. The use of this combination with statistical systems of Australia, Canada, France, UK and US made it possible to study the contribution of the cultural and creative sector on GDP for those counties. The boundary sectors that are not included in the 2007 review are the cultural tourism, sports and activities related to entertainment such as gambling and betting because these activities sectors are not consistent to produce reliable statistics (Gordon & Beilby-Orrin, 2007) .
UNCTAD
16
on intellectual property and for as wide a market as possible” (UNCTAD, 2004, page 4). Later, in UNCTAD (2008) creative industries are defined as “the cycles of creation, production and distribution of goods and services that use creativity and intellectual capital as primary inputs”, which “constitute a set of knowledge-based activities, focused on but not limited to arts, potentially generating revenues from trade and intellectual property rights”, comprising “tangible products and intangible intellectual or artistic services with creative content, economic value and market objectives”. It is also mentioned that these types of industries “are at the cross-road among the artisan, services and industrial sectors” and “constitute a new dynamic sector in world trade” (UNCTAD, 2008 page 13). The classification of creative industries is subdivided into four groups such as heritage, arts, media and functional creations. There are some boundary sectors that are not included in CCI: cultural tourism and sports.
According to Mateus (2010) despite of these considerable studies and other researches that are been made, the delimitation of the Cultural and Creative Sector is still on developing both conceptually and statistically.
1.2. The Moving Boundary Between Creative and Cultural Industries
17
The study prepared for the European Commission by KEA (2006) (previously mentioned) clearly distinguishes both concepts: creative and cultural. Cultural sector includes all the activities related to the traditional arts and to the culture in the broad sense, while the creative sector embraces the activities that use cultural resources as inputs in the production of non-cultural goods. Thereby, the creative sector is view as a source of innovation. On the other hand, the cultural sector is subdivided into two groups: non-industrial sector which add simply the production of non-reproducible goods and services that are for an immediate consumption, and the industrial sector which aggregate all cultural products produced for the” mass reproduction, mass dissemination and exports”. The non-industrial sector includes the entire arts field (visual and performing arts and heritage) while the industrial sector includes the “cultural industries” such as “film and
video, video-games, broadcasting, music, book and press publishing”.
According to UNCTAD (2008), the cultural activities are a subset of creative industries. The cultural industries are basically those that produce cultural goods and services. It also mentioned the difference between upstream activities (traditional arts including both visual and performing arts) and downstream activities (activities that are more close to the market such as publicity, editing and printing press and media activities). UNESCO defined cultural industries as those that can “combine the creation,
18
Briefly, the activities embraced by these two types of industries, cultural and creative, are in a permanent transformation, depending on different methodologies, and therefore it will always be a continue moving boundary between them.
Considering the previous survey about the concepts of CCI, from this point we will denominate these industries as Cultural and Creative Industries (CCI), with the content defined by the current literature, and basing our approach on the ESS-net Culture Final Report (2009).
2. Literature Review
2.1. Business Cycle Effects on the Financial Economic Performance of
Creative Industries and Survival Analysis
2.1.1. Business Cycle and Creative Firms Financial Performance
The business cycle is a crucial indicator for the industries’ and firms’ performance
and their survival. Audretsch & Acs (1994) stated that when there is a macroeconomic expansion it can be observed an increase of the startup new firms in practically every sector, as well as in a macroeconomic recession it is expected that the startups firms slow down. The relationship between the macroeconomic context and firm’s dynamic and financial performance in the Creative Sector in Portugal was not studied yet, as far as we know.
19
Lee & Mukoyama (2015), who will be followed by the present research on section 4.1., approached the cyclical analyze from several empirical perspectives for the U.S. manufacturing firms between 1992 and 1997. They tried to understand the dynamic of the firms studying the average and relative size measured by the number of employees for three types of firms: born, continuing and death. They conclude that the continuing firms present a number of employees higher than the firms that born and death. To determine the relative size of the firms, Lee & Mukoyama (2015) divided the size of the born and death firms type by the average of the continuing firms (adopted as reference type), and they verified that born and death firms are smaller than the continuing ones by 40% and 50%, respectively. They explained this result by the level of productivity, being the born and the death firms less productive.
Additionally, considering the macroeconomic context, Lee & Mukoyama (2015), divided the period under analysis into two categories – good and bad years – based on the growth rate of the manufacturing output. They considered as a good (bad) year if the period between year t-1 to t was above (below) the average of the growth rate of the manufacturing output. The two most relevant contributions for the present research, are the cyclical measures developed by Lee & Mukoyama (2015): (i) the average and relative size of born and death firms; and (ii) the entry and exit rates.
For the average firms’ size and the firms’ size relative to the continuers firms the authors observed that both average and relative firms’ size present similar conclusions:
20
The entry (exit) rate corresponds to the number of born (death) firms as a percentage of total number of firms each period. When analyzing the entry and exit rates based on the good and bad years, they observed a positive significant difference on entry rates between booms and recessions, but when the exit rates are analyzed that difference vanish. The reason for the entry rates be higher during booms is mainly due to the existence of barriers during the non-favorable period and the authors conclude that independently from the indicators used to classify the ‘good’ and the ‘bad’ years (e.g.
GDP growth rate or unemployment rate), the entry rate presents higher values for good years.
21
situation in the short term. Nevertheless, when analyzing the long term indicator (solvency ratio) Portugal, as well as Italy, Latvia, Luxemburg, Malta and Romania, indicates low solvency values. However, the average values per country should be prudently interpreted since among countries there is a large diversity of the composition of CCI.
To study the impact of the macroeconomic context on the creative sector (size and financial performance) following hypothesis will be tested.
Hypothesis 1: The business cycle affect the size and financial performance in
creative industries.
2.1.2. Business Cycle and Creative Firm Survival
22
23
In this research, it will be analyzed by year the number of firms that remain active since their born since 2004 until 2011 and if the subsidies are an important explanatory factor for their survival. Thus, I will try to answer the following:
Hypothesis 2: The creative firms’ survival is affected by the business cycle and
the government funds or subsidies are crucial to their survival.
2.2. Public Policies and Subsidies Effects on Financial Performance of
Creative Industries
The financial tools and the public policies (for example the monetary policy) are extremely important to the development of any enterprise. Several studies discussed that the principal barrier of the CCI development is the access to finance (Mateus 2013 and 2010; European Commission, 2013). Mostly of these firms are very small and one of the most notable facts regarding to the Small and Medium Enterprises (SME) is that these type of firms have more difficulties to access to finance than the large ones (Beck & Demirguc-Kunt, 2006) being information asymmetry the main reason of this problem (European Commission, 2013).
The financing needs for CCI is not studied very often and the main European research about this issue is the Survey on access to finance for cultural and creative sector
24
CCI have specific features that emphasize the difficulty of attracting external finance. European Commission (2013), divides the CCI characteristics into three groups related to: (i) their intrinsic features; (ii) business composition; and (iii) market conditions. The inherent characteristics are that they present high weight of intangible assets which is the opposite of most of the tangible-intangible mix in most of the sectors.
Because the tangible assets are very desirable as collateral on bank loans, this characteristic impacts negatively on the credit access. CCI are extremely dependent on internal demand mainly because most of them are linked to tourism. Secondly, the CCI
present similar business composition. Probably the most visible feature is the size: in the CCI sector most of the firms are micro, it means, has less than ten workers. The firm’s
dimension consists in a real barrier to access to finance apart from their potential to develop, being the lack of financing funds the biggest contributor to the non-development of these firms. It is cross-cut to CCI firms the high dependence on public funding (with
few exceptions) and the low knowledge and shortage of business managerial skills.
Regardless the subsector (or function) of the firm, the CCI shows a specific market profile, with a small market size (niches of demand in some cases) and the firms usually remained on a specific local, regional or country due to the difficulties of exporting
(KEA, 2010).
The CCI’s firms are also characterize for specific financial needs and resort
mainly to their own earnings, government subsidies, and largely short-term credit. The financial sources, based on the annual accounts of 2010, correspond to three main groups: “shareholders’ funds [which includes also subsidies]; noncurrent liabilities (debts which are due in more than 1 year); and current liabilities (due and payable within 1 year).”
pre-25
financing the business plans and to mitigate the financial gap caused by the period of waiting for other funds such as medium or long run bank loans, loans from private investors or organizations (e.g. sponsors) and crowdfunding. The short-term credit, the most expensive way of obtaining bank financing, is used more often because it is easier to obtain compared to other instruments. Although, the long-term finance is also essential to ensure the stabilization of the business projects. In 2010, the short-term credit is the most sought financing source (European Commission, 2013). Exception are Education and Preservation which are most financed by shareholders’ funds, with respectively 60%
and 57% share in total financing
How the creative firms are financed depends on the specific structure of CCI sector and also on the government budget share allocated to finance this sector. For example, in Northern and Western European countries CCI firms are mainly financed by shareholders’ funds. Comparing the financial sources which support the Portuguese
creative firms and the EU-27 countries, Portugal presents in 2010 year a significant lower percentage of financing through government subsidies (17% over 33%), financing by long-term debt presents a difference that is not so sharp (34% over 22%), and the share financed by short-term debt is similar to EU-27 countries (49% over 45%). Mateus (2010) stressed the relevance of the government subsidies on financing Portuguese’s creative firms as an important contributor to its expansion and development.
26
financial risk of the investment. The fact that the intangible assets owned by the CCI firms do not fit as a collateral was also mentioned from the perspective of the financiers as the main barrier although they argue that the scarce of a well-designed business plan and good managerial skills amplifies this problem, being more likely the funding rejection by banks. Because CCI are very often community or municipal activities also worsens this situation because only few banks invest on this type of activities. For specific CCI activities the equity investment is the major financial source considering the high levels of novelty and risk associated to CCI.
The financing gap is mostly used to describe the firms’ early-stage and it corresponds to the required amount of money to fund the ongoing and development projects of a firm that has not currently access to finance (European Commission, 2013). This indicator exists due to the existence barriers to access to finance and it is sharpest on some CCI as Visual and Preforming Arts, Arts & Crafts, Music, Books, Architecture, Advertising and Design which when comparing with Audiovisual, Heritage & Education exhibit a considerable lower loan amount. European Commission (2013) states that it is likely that the subsidies assignment decrease during the current decade due to the intensification of the stiffness of the financiers’ criteria (financial crisis effect), which will
affect the access to finance and consequently the financing gap. The new Creative Europe Programme (2014-2020)1 which appears as a third party guarantee facility encouraging
banks on financing CCI could mitigate this financing gap. It will be test the following hypothesis:
1
27
Hypothesis 3: There are different sources which finance CCI development and the
public funding is the CCI development booster.
2.3. Creative Industries Role on the Global and Local Economic
Growth and Job Creation
The CCI are recognized as important contributors to societal development worldwide and the firms which belong to CCI are crucial as a component of the modern economic infrastructure (Heinze & Hoose, 2012). The relevance of these firms as a social developer are also stressed as drivers of the economic growth (INE, 2015; European Commission, 2013; Mateus, 2010), and the booster of employment (Cruz & Teixeira, 2015a & 2015b). Potts & Cunningham (2008) argues that the impact of the CCI on economic growth is not purely measured through the CCI economic value (e.g. the production of cultural goods or the employment creation) because these firms have more than a static role and their contribution to economic growth and development exceeds the CCI contribution to culture and society. Moreover, CCI also contributes and develops the society through the innovation and dynamism created in the places where they are located (Cruz & Teixeira, 2014; Boix et al., 2014; Power, 2014; Berg & Hassink, 2013).
CCI contribution varies across countries and regions because they have different compositions and distinct national policy makers (Boix et al., 2014). Geographically, across the EU-27 countries2the CCI employment is mostly concentrated on Germany,
United Kingdom, France and Italy, even though there are a couple of Eastern Europe3 that
also present a higher number of employees on CCI (European Commission, 2013).
2 This analyze excludes countries that present data missing which could change the top four. The countries
excluded was Spain, Ireland, Luxemburg and Estonia.
28
The fact that Portugal does not fit on the top four, the Portuguese economy does not run away from this trend about the growing relevance of this sector. INE (2015) recently published a report for three consecutive years (2010-2012), based on Culture Satellite Account in accordance with National Accounts (2011), and shows that there are approximately 66,000 Portuguese firms belonging to the CCI defined according to the “ESS-net Culture final report” (Bina et al., 2013). This creative sector corresponds, on average, to 2.0% of employment and 1.7% of the GVA of the global Portuguese economy. Cruz & Teixeira (2015a) analyzed the employment of core CCI4 on private sector
(excluding activities which the main purpose is not wholly the production/creative of creative and cultural goods), and conclude that it corresponds to 3.5% of the total Portuguese employees.
The inclusion of the technology and innovation in the CCI has a great impact on the economy. The creative technological industries, firms that include the information and communication technology (ITC) provided an increase of the importance of the CCI (Garnham, 2005) and the ITC growth helps the development of CCI (Potts & Cunningham, 2008), making its activities/production more affordable not only to the domestic but also to external market.
Because the economy and the employment levels and growth rates in Portugal are affected by the CCI composition and dynamic we hypothesize that
4 The core CCI considered by Cruz & Teixeira (2015) is composed by: Advertising and marketing,
29
Hypothesis 4: The creative industries contribute positively to the growth of the
economy and the employment during the period 2004-2011.
2.4. Dynamic of Regional Specialization of Creative Industries
Many researchers found that the CCI are concentrated in some strategic locations and have a relevant role in regional and local development. Indeed, the spatial location of creative industries generates not only benefits from its localizations but also provides an increase of the regional economy (Berg & Hassink, 2013). Nevertheless, the location depend on the features of the CCI but also on the firm’s educational level of employees,
the technological intensity and more importantly the municipality characteristics because local authorities very often are providers of funding for CCI firms. The regional clusters strategies increase the relevance of CCI (Heinze & Hoose, 2012), notwithstanding the propensity to geographical agglomeration varies across sectors (European Commission, 2011).
30
Spain, Boix et al. (2014) seek to understand the differences among countries concluding that the public funds for the creative industries are applied differently, being extremely decentralized the public financing to local governments in Spain, while on the other three countries the central administrations controls more than half of those public funds “through industry-specific rather than territory-specific policies”. The authors also referred that it is more effective to have a policy that approaches a location-based (e.g. Spain) instead of an industry-based. Boix et al. (2014) pointed out that the specialization on CCI varies across countries: France is slightly more specialized in publishing, architecture and film while Great Britain is specialized in architecture, besides of both countries are the ones that are the most diversified. Italy and Spain are highly specialized in fashion although Italy is also specialized in architecture while Spain is also in printing.
A recent study for Portugal (Cruz & Teixeira, 2014), based on administrative data from Quadros de Pessoal for 2009 year, concludes that the behavior about location of the
Portuguese CCI is similar to the rest of Europe, being mostly located by creating clusters around few important urban zones.
Definitely European CCI are attracted to urban zones and thus, for Portugal we will try to empirically test it. We will define the activities that predominates in urban zones and study the heterogeneity of each sector based on their own different location and characteristics. Thus, we hypothesized that
Hypothesis 5: The clusters of industries are geographically distributed according
each sub-sector characteristics (e.g. creative skills human resources, potential market,
31
3. Empirical Study of Creative Industries Sector in Portugal
3.1. Data Source and Sample Selection
Data Base: Accounting Data Base –Sistema de Contas Integradas das Empresas
(SCIE)
This research studies the firm’s financial performance of CCI firms using an accounting firm-based data, the Sistema de Contas Integradas das Empresas (SCIE)
Statistics Portugal (2004-2011). The SCIE database includes two groups of non-financial firms according to the legal form: the Societies [in Portuguese: Sociedades] and the
Individual Companies [in Portuguese: Empresas em nome Individual]. The information
available for each of the two groups is very different: for the Individual Companies there are less than ten variables available. The variables are: turnover, employees, region distribution (based on Nível 2 da Nomenclatura das Unidades Territoriais para Fins Estatísticos, 2002/Level 2 of the Nomenclature of Territorial Units for Statistics 2002),
year of data reference, and the sector of activity at 5 digits NACE Rev. 25, and the born
and death6 year indicators. Moreover, the Individual Companies corresponds to the
majority of the sample of this study, being mostly micro firms, i.e. the number of employed persons is below ten workers7 (Table I, Appendix).
The variables available for the first group of firms, the Societies, are the same variables available to the Individual Companies and additionally many others mainly associated to profits and cost, number of employees and taxes and subsidies. For this reason some analysis are only possible to carry on for the group of Societies due to the
5 Corresponds to Código de CAE Rev.3 – codificada 6 Data missing of death indicator for 2010 and 2011.
32
lack of information for the Individual Companies. Therefore, in some of the analysis performed in this thesis, the results could be skewed and should be interpreted carefully considering that the major legal form of the firms in the CCI is the Individual Companies [in Portuguese: Empresas em nome Individual] which represent about 92.65% of the total
of the firms included in the database.
Operationalization of the concept
The methodological particularities regarding the selection of the CCI is based on the taxonomy on creative and cultural sectors adopted by the ESSnet-Culture, European Statistical System Network on Culture - Final Report, found in Bína et al. (2012). Applying the definition by ESSnet presented on section 1.2., this sector has 100,122 observations during the period of analyze. Restricting the sample only to the firms that are registered on the data base during the eight years period of analyze (2004-2011) the total number of firms drops to 19,464. Additionally and limiting the sample by considering only the firms that have a number of employees equal or above ten employees, the number of firms reduces significantly to 1,431. According to ESSnet classification the sample is subdivided into 6 categories: Creation; Production/Publishing; Dissemination/Trade; Preservation; Education; and Management/Regulation (Table II, Appendix). These 6 categories are not homogeneous not only because they present distinct specifications but also for the weight that each have on the CCI evaluated by the number of firms, by the number of employees or by the turnover.
CCI and the Classificação das Actividades Económicas (CAE)
33
3) the classification used by SCIE database. To map the CCI, they can also be organized in accordance with SIC code (Standard Industrial Classification code). DCMS (2009) states that the 5 digit code provides more accuracy rather than a 4 digit code and therefore in this study we will use the higher level of desegregation (5 digits CAE code).
The Culture and Leisure industries are stated on the R section of the CAE
presented as Actividades artísticas, de espectáculo, desportivas e recreativas (INE,
2007). We consider the delimitation of the culture and creative sector adopted by ESSnet, which evolves 29 fields/activities with a 4 digit code, applied to the Portuguese CAE code. (Table III, Appendix). However, besides of the preferential use of a 5 digit code we considered other activities related to the cultural and creative activities that belongs to other sections and excluded some others that we deliberated that they should not be considered in this study.
3.2. Phases and Methodology of Analysis
In terms of methodology, this dissertation is divided into two different stages. Initially, the original files by year from the SCIE are aggregated into one single file with eight observations for each variable considered because the period under study is 2004-2011. The second stage corresponds to the empirical test of the 5 hypothesis presented in section 4. Results and Discussions Analysis.
34
using the criteria of the Real GDP growth rate. For the Real GDP growth rate, it was consider a good (bad) year if this measure for a certain year was above (below) the average of GDP growth rates. Base on this distinction it is tested the entry and exit rates, and the average and relative size for born and death firms. Moreover, the entry and exit rate is also analyzed based on the good and bad years defined by the unemployment rate change. Using the unemployment rate change to define the macroeconomic context, we consider as a good, bad and very bad year when this indicator presents a negative variation, positive variation but lower than 7.5% and a positive variation higher than 7.5%, respectively.
For the verification of Hypothesis 2 and Hypothesis 3, it is examined if the subsidies have a positive impact on the firm’s survival through a survival analysis. It will
be estimated the survival rates of firms born during the period 2004-2011 accomplished to the Kaplan-Meier survival estimates. Additionally, it is conducted a descriptive analysis of the total number of firms as well as the born, death and continuing firms for each year. From these analyzes it is expected to determine the number of firms that survive year after year.
35
For the Hypothesis 5, it is considered the Portuguese territory division (NUTSII) as the base of the spatial analyze. Besides of the global analyze by 7 Portuguese regions, it is subdivided through the six functions. Moreover, it will tested the heterogeneity of CCI between regions through variance analysis (ANOVA-tests).
All the estimated results have been determined by the intensive programming task using both IBM-SPSS and STATA13.
4. Results and Discussion
4.1. Business Cycle and CCI Firms’ Performance
The results associated to Hypothesis 1 studied the impact of business cycle on the
firms’ performance. Concerning the average size of continuing, born and death firms, we observed that during the 8-year period the continuing firms are approximately 50% higher than the born and death firms (Table IV, Appendix). The born firms are on the second size rank position and the death firms are those that are smaller. There is statistical evidences of high disparities on continuing firms and, on the other hand, low disparities regarding to the born and death firms. These results corroborates those obtained Lee & Mukoyama (2015) nevertheless our data include a large share of micro-enterprises and as a result the average size is smaller. The relative size of the born (death) was obtained by dividing the born (death) size by the average size of continuers firms, for each year (Table
36
the Real GDP growth rate the results are not consistent with the study recently produced (Table VI, Appendix). The average size of born firms are similar across booms and recessions, while the average size of death firms changes over the business cycle, being higher in good years. In relative terms, the born firms are slightly larger in recessions than in booms and there is practically no magnitude between the relative size of death firms across the business cycle. The ‘good’ and ‘bad’ years are analyzed considering the Real GDP growth rate (Figure I, Appendix) and the Unemployment rate change (Figure II, Appendix). The entry rates of CCI firms are higher than the exit rates for both cyclical indicators on good years (Table VII, Appendix). Although, the fact of the entry rates are higher in good years concluded by Lee & Mukoyama (2015) just applies for Real GDP growth rate. These result could be justified once these authors considered equally two macroeconomic periods for the Unemployment Rate change while I turned this analyze more detailed by including another cycle (Very Bad Years).
It is clear that apart of the criteria used to analyzed the impact of the macroeconomic context on the performance of CCI firms, these firms tend to develop their activities on ‘good’ years (expansion), otherwise the tendency is to slow down or
even for some of them achieve most extreme situation, official declaration of their shut down (death).
37
autonomy ratio indicates that, the vulnerability of the firms were growing until 2008 and
before that there were slightly signs of a greater financial stability. It was also observed that until 2009 there were an increase of the investment rate followed by a significant
decrease until 2011. Besides of the improvements until 2008-2009, there were evidences that both sales and assets of the firms could not generate efficiently financial return on the future, by evaluating the return on sales and return on assets. On the contrary, in 2007
the return on equity ratio indicates that the money invested by shareholders generate profit
for the firm. The assets rotation reveals that the worse efficient period to generate sales
were between 2007 and 2010, reaching the highest efficiency in 2011. Nevertheless, some financial indicators, as debt-to-equity ratio and equity rotation, do not present a clear
tendency exhibiting a constant variation.
The economic and financial crisis started in United States of American at the end of 2007 (NBER8) which was quickly felt overall European countries and in Portugal
combined with a public debt crisis impacted on all sectors and this CCI sector was not an exception.
4.2. Government Funding and CCI Firms’ Performance and Survival
The Hypothesis 2 and the Hypothesis 3are studied by the duration of the firms
and by modeling the survival determinants testing the inclusion of subsidies as an explanatory variable. The CCI firms are divided into three firms’ status: (i) born; (ii) death; and (iii) continuing firms (Table IX, Appendix). For all period of analyze (2004-2009), continuing firms represent more than 70% of the total number of firms with an exception on 2009 year, revealing a clear decrease trend. The born firms increased until
38
2007, although on the remaining years it decreased (e.g. on 2007 the born firms represent circa 17% of the total firms, while in 2009 it was only 12%). On the contrary, the weight of death firms on the total number of firms increased over time, passing from approximately 11% in 2005 to 19% in 2009. The development of these three types of firms confirms that, despite of a macroeconomic effect, there are evidences of a decrease on the firms’ survival, being less the firms that remain active comparing with the increase
of the death firms. This fact could be studied through a survival analyze which seeks to determine the survival rates (duration) of the born firms. The empirical literature relating public policies of funding or support and firm survival were briefly presented in section 2.1. (Mateus, 2013; European Commission, 2013). The duration of the observed firms is analyzed considering that the observations are right-censored, meaning that the failure event of this analysis (firm’s death) could not occur during the observation period (for instance, some of 2004 born firms continued active after 2011). These analyses were made only for the firms born since 2004 until 2006, and consequently the number of observations is smaller.
39
that this qualitative change, (from 2009 further, the subsidized firms born in 2006 have higher survival rate) results from the crisis situation. Furthermore, we can also conclude that the improvement of the firms’ survival is related with the subsidies only in periods of downturn.
Apart of the impact of the subsidies on the firms’ survival we analyzed the
evolution of the transfers between the government and CCI firms. It was analyzed the development of the subsidies (subs) and taxes (tax) during the period of analyze in
average terms (Figure VI, Appendix). We observed a dramatically decrease of the subsidies on 2005 compared to the previous year, and from 2005 further the grant of subsidies increased until 2011 (e.g. the subsidies in 2011 were 53% higher than in 2005). The taxes applied followed the evolution of the subsidies until 2008, although after 2008 the taxes decreased being approximately 67% of the subsidies. Analyzing these two financial indicators by the 6 functions, we verified that Education is the function that received more subsidies and at the same time is the one that pays less taxes (Table X, Appendix). Creation is the function with less subsidies and Dissemination/Trade have a higher value of taxes. On a spatial comparison, Lisbon Metropolitan Area present higher value of both (subsidies and taxes), being Madeira followed by Algarve the regions were the subsidies applies less (Table XI, Appendix). The regions that pays less taxes are Alentejo and Azores.
4.3. CCI Firms Contribution to Employment and Growth
The empirical verification of the Hypothesis 4 is analyzed based on the evolution of
several indicators during the period under analysis. The development of CCI attracted
40
society (European Commission, 2013; Mateus, 2010). Their economic relevance of this sector for Portugal is tested here through the evolution of the size (employees), turnover
(turnover), GVA at factor costs (GVAfc) and at market prices (GVAmp). Comparing these
four indicators in 2004 and in 2011, we observed a general decrease across time, with an exception of the number of employees which increased approximately 5%, while the turnover decreased 14% and both GVA at factor costs and at market prices diminished circa 5% (Table XII, Appendix). From the annual analyze, it is clear that these four indicators increased until 2008 being this year the turning point. As mentioned previously, this behavior seems to be associated to the 2008 crisis and apart of this important factor there were not extreme falls during the period of analyze.
In average terms, CCI represent approximately 2.4% of employees, 1.9% of turnover, and circa 2% of both GVA at factor costs and at market prices in relation of the business economy. The weights of these four indicators remain stable across time (Figure VII, Appendix). However, there is a slight increase in the share in total employment from 2004 to 2008, while the turnover present a slight decrease from 2004 until 2010. Considering that the weight of GVA at factor costs and market prices remain stable, and the difference between these two indicators corresponds to the taxes net of subsidies, indirectly this suggest that the net taxes did not change across time differently from the total business. Finally the data for all the economy indicates that the mean size of firms is 3 employees per firm and a median equal to one. This also illustrates the relevance of micro-firms in the business structure in Portugal.
41
difference between the 6 creative functions (Table XIII, Appendix), the 4 firm’s size categories (Table XV, Appendix) and between the 7 regions (Table XIV, Appendix).
4.4. Spatial Location of CCI and Regional Development
TheHypothesis 5 verification is based on the information from SCIE using in this
case a sample, of 19,464 firms organized by regions according to the NUTSII9 which
divides the Portuguese territory into 7 regions: North, Algarve, Center, Lisbon Metropolitan Area, Alentejo, Azores and Madeira.
Previous studies show that (see Section 2.4.) the spatial location choices of CCI’s firms are heterogeneous across sectors, despite of the tendency to agglomerate in a few number of municipalities considering the year of 2009 in Portugal (Cruz & Teixeira, 2015) and to concentrated mostly on the large urban zones accordingly to the 4 EU Countries studied by Boix et al. (2011).
Indeed, the Portuguese CCI’ firms during recent years (2004-2011) tend to concentrate mainly on the two biggest urban zones (Lisbon Metropolitan Area and North), supporting the argument that the spatial patterns of the creative firms are the large urban areas (Boix et al., 2011; Florida 2005; Cruz & Teixeira, 2015). The distribution of the CCI in Portugal by 6 categories (6 subsectors) was analyzed through the average of the 8-year period (Table XVI, Appendix). On a ranking position, Lisbon Metropolitan Area clearly present a higher number of CCI clusters, followed by Porto and Center of Portugal. On the opposite, Azores is the region that concentrates less CCI firms. Cruz &
9 Nível 2 da Nomenclatura das Unidades Territoriais para Fins Estatísticos, 2002 (Level 2 of the
42
Teixeira (2015) explained the high agglomeration tendency through the human capital intensity, industry diversity and social equality observed on the largest urban zones.
Practically all firms that belong to Creation, Production/Publishing, Preservation and Management/Regulation exhibit a tendency to concentrate mainly on Lisbon Metropolitan Area and Porto, tending to favors locations nearby to manufacturing industries and where exist high creative diversity and high population density. The Education activities concentrates on these two top metropolitan areas although the main reason of this preference is the population with high education which leads to these activities seeks locals around universities (Cruz & Teixeira, 2015). The activities that have higher presence overall regions are the ones related to Preservation and Management/Regulation functions, due to the high number of firms that each one embraces when comparing to the remaining functions.
Summarizing, the regional distribution shows that the Portuguese CCI firms tend to behave similarly to other European creative activities (Boix et al. 2014) and there was no relevant change since 2009 year analyzed by Cruz & Teixeira (2015).
5. Conclusions and Future Research
43
to global output and employment. Fifth, illustrates the relevance of CCI to the local and regional development. This five aspects also correspond to five hypothesis around which the empirical work is organized. Additionally, the conceptual section about the (moving) frontiers of this sector and correspondent concepts and definitions illuminates for the Portuguese case, a worldwide ongoing debate.
The selection of the CCI from the total of Portuguese firms distributed according the CAE code, follows ESSnet (Bina et al. 2012). An yearly analysis, based on SCIE accounting microdata, were conducted considering two distinct samples: firms belonging to CC sectors which present a number of employees equal or above 10 (N=1,431); firms belonging to CC sectors considering al firm sizes, micro, small, medium and large (N=100,122). After a classification of CCI according to their delimitation into the 6 cultural functions and size dimension categories, we proceed to the empirics in order to
test the five hypothesis.
CCI Characteristics and Trends
44
firms in all years of the analyzed period). The small firms correspond circa to 1.20% of the full sample, while the medium firms has an approximate weigh of 0.14%, and the large ones has a roughly weigh lower than 0.03%. Despite of CCI increase, and considering the general firms’ size, the access to finance is mentioned as the main barrier to their development and the reason why that the government funds be an essential financial source.
The effects of the macroeconomic context on the characteristics and performance of CCI firms are:
(i) Independently the cyclical indicator (real GDP growth rate; unemployment change rate) used to measure the macroeconomic context, on good years we verified an increase of the ‘entering’ or born firms and, on the most non-favorable period we observed an increase of ‘exiting’ or death.
(ii) The average size of continuing firms are higher than the born and consequently the death firms. These result is also consistent with the analyze of the evolution of the number of firms, and despite of a general increase of these firms over the period of analyze it is clear that the continuing firms have more weigh over the total number of firms in relation to the born and death.
(iii) Mostly financial ratios of CCI firms exhibit a clear tendency until 2007-2008 and due to the change of the macroeconomic context (economic and financial crisis started in United States of American at the end of 2007), on the period immediately after the tendency assume an opposite direction.
45
subsidies. On a cross-section analyze, Education received more subsidies and paid less taxes. At a regional level, Lisbon Metropolitan Area present higher value of both (subsidies and taxes). On the opposite, Madeira received less subsidies and that Alentejo paid less taxes. The Kaplan-Meier survival curves for subsidized and non-subsidized firms present inconclusive outcomes. Only for the firms born in 2006, the granted subsidies had impact on the survival rates positively, being higher after 2008 and it is likely that this is a results from the macroeconomic context. This outcomes also suggest that the subsidies improve the survival of the firms only in periods of downturn.
The results concerning to the evolution of some measures during the period of analyze, obtained by descriptive analysis, lead us to conclude that all - size (employees), turnover (turnover), GVA at factor costs (GVAfc) and at market prices (GVAmp) – decrease from 2004 to 2011. The annual descriptive analyzes lead us to conclude that 2008 were the turning point year because, as well as the financial ratios, there are evidences of an increase trend until 2008 and further this year the opposite occurs. Apart of the stable evolution of the weights of these indicators, CCI represent approximately 2.4% of employees, 1.9% of turnover, and circa 2% of both GVA at factor costs and at market prices in relation of the business economy, in average terms. The constant evolution of GVA at factor costs and market prices, indirectly indicates that the net taxes did not change over time differently from the total business, considering that these two indicators differ by the taxes net of subsidies.
46
Teixeira, 2014). This tendency confirm the argue that these firms take advantage of the urbanized economies (Jacobs, 1976).
New directions for the CCI research
During this investigation we found some limitations and therefore these could be circumvented on further researches. The main limitation of this study is the lack of detailed data for the micro-enterprises since the CCI are mostly composed by these type of firms. Besides of general information concerning profits and costs, this restriction influenced mainly the results of the survival analysis, which could be more precise if it was conducted including as variables the subsidies receipt and the taxes paid to Portuguese government for these firms. Another issue detected on this dissertation is the lack of information regarding to the access to finance of CCI in Portugal. The existence of these was not totally explored.
48
References
Almus, M. (2001). Evaluating the Impact of Public Start-up Assistance-Results from an Econometric Approach. ZEW Working Paper, 1-23.
Audretsch, D. B., & Acs, Z. J. (1994). New-firms startups, technology, and macroeconomic fluctuations. Small Business Economics, 6(6), 439–449.
Audretsch, D. B., & Mahmood, T. (1995). New firm survival: new results using a hazard function. The Review of Economics and Statistics, 97-103.
Battistin, E., Gavosto, A., & Rettore, E. (2001). Why do subsidised firms survive longer? An evaluation of a program promoting youth entrepreneurship in Italy, in Lechner, M. & Pfeiffer, F. (ed.), Econometric Evaluation of Labor Market Policies (pp.
153-181). Physica-Verlag.
Beck, T., & Demirguc-Kunt, A. (2006). Small and medium-size enterprises: Access to finance as a growth constraint. Journal of Banking & Finance, 30(11),
2931-2943.
Berg, S.-H., & Hassink, R. (2013). Papers in Evolutionary Economic Geography Creative industries from an evolutionary perspective: A critical literature review. No. 1306. Working Paper Utrecht University, Section of Economic Geography.
49
Boix, R., Capone, F., De Propris, L., Lazzeretti, L., & Sanchez, D. (2014). Comparing creative industries in Europe. European Urban and Regional Studies.
doi:10.1177/0969776414541135
Boix, R., Lazzeretti, L., Hervàs, J. L., & De, B. (2011). Creative clusters in Europe : a microdata approach. New Challenges for European Regions and Urban Areas
in a Globalised World. Barcelona.
Cameron, A. C. Trivedi, P. K. (2010). Microeconometrics Using STATA (revised
edition). STATA Press.
Chaston, I., & Sadler-Smith, E. (2012). Entrepreneurial cognition, entrepreneurial orientation and firm capability in the creative industries. British Journal of Management,
23, 415–432. doi:10.1111/j.1467-8551.2011.00752.x
Cruz, S. S., & Teixeira, A. A. (2014). The determinants of spatial location of creative industries start-ups: Evidence from Portugal using a discrete choice model
approach .Working Paper Universidade do Porto, Faculdade de Economia do Porto No.
546.
Cruz, S. S., & Teixeira, A. A. (2015a). The magnitude of creative industries in Portugal: what do the distinct industry-based approaches tell us?. Creative Industries Journal, 8(1), 85-102.
50
DCMS (Department for culture, media and Sport). (2007). Staying ahead : the economic performance of the UK’s creative industries (pp. 1–30).
DCMS (Department for culture, media and Sport). (2009). Creative Industries Economic Estimates Statistical Bulletin (pp. 1–16).
Désiage, L. J., Duhautois, R., & Redor, D. (2010). Do Public Subsidies Have an Impact on New Firm Survival? An Empirical Study with French Data. (mimeo)
European Commission. (2011). The European Cluster Observatory Priority Sector Report: Creative and Cultural Industries, Luxembourg. Office of the European
Union (pp. 1–26). Retrieved from
http://www.clusterobservatory.eu/common/galleries/downloads/CreativeAndCulturalIn dustries.pdf
European Commission (2013). Survey on access to finance for cultural and creative sectors: Evaluate the financial gap of different cultural and creative sectors to
support the impact assessment of the creative Europe programme. Retrieved from
http://ec.europa.eu/culture/library/studies/access-finance_en.pdf
European Commission (2014) Creative Europe, Culture Sub-programme
https://eacea.ec.europa.eu/sites/eacea-site/files/documents/guidelines-call-for-proposals-cooperation-projects-2015_en_1.pdf
Flew, T., & Cunningham, S. (2010). Creative Industries After the First Decade of Debate. The Information Society, 26, 1–11. doi: 10.1080/01972240903562753
51
Frontier Economics. (2007). Creative industry performance: A statistical analysis for the DCMS.
Fuentes, R., & Dresdner, J. (2013). Survival of micro-enterprises: Does public seed financing work?. Applied Economics Letters, 20(8), 754-757.
Galloway, S., & Dunlop, S. (2007). A Critique of Definitions of the Cultural and Creative Industries in Public Policy. International Journal of Cultural Policy, 13(1), 17–
31. doi:10.1080/10286630701201657
Garnham, N. (2005). From cultural to creative industries. International Journal of Cultural Policy, 11(1), 15–29. doi:10.1080/10286630500067606
Gennari, E., & Lotti, F. (2013). Female entrepreneurship and government policy: evaluating the impact of subsidies on firms' survival. Bank of Italy Occasional Paper,
(192).
Gordon, J. C., & Beilby-Orrin, H. (2007). International measurement of the economic and social importance of culture. OECD Statistics Working Papers. Retrieved
from http://79.96.28.119/pliki/2/21/37257281.pdf
Hamilton, L. C. (2004). Statistics with STATA. Thomson Brooks/Cole.
Heinze, R. G., & Hoose, F. (2013). The creative economy: Vision or illusion in the structural change?. European Planning Studies, 21(4), 516-535.
Hennekam, S. (2015). Challenges of older self-employed workers in creative industries: the case of the Netherlands. Management Decision, 53(4).
INE (n.d.). Sistema de Contas Integradas das Empresas (SCIE). INE, Instituto