Hospital Efficiency
Directed Internship: Deloitte & NOVA SBE
Pedro Sucena e Castro, #486
A Project carried out on the Master in Economics course, under the supervision of:
Professor Pedro Pita Barros, NOVA SBE
Drª Margarida Bajanca, Deloitte Portugal
Dr João Messias Gomes, Deloitte Portugal
June 2012
1
1.
Abstract
In a context of economic recession, where resource scarcity follows every
manager, efficiency is the only way out. Health Care is no exception. Continuous
budgetary cuts from central authorities led to increasing pressures in hospital managers
to achieve efficient results. In light of being able to quantify efficiency, this work
project has the aim of identifying the best of two frontier based analysis (Stochastic
Frontier Analysis and Data Envelopment Analysis) by performing efficiency
estimations for a single year using variables from the Portuguese reality, allowing the
identification of inefficiency sources.
Efficiency scores will be obtained to compare hospitals for efficiency ranks and
several efficiency-seeking suggestions will be stated in the end.
The scores obtained from the estimations show that some hospitals still have a
rough path to endure if they are to achieve economic efficiency. From the analysis we
can see that efficient hospitals vary for each model. (8 in SFA [hospitals with a score
higher than 0.95] and 17 in DEA). Estimation outputs suggest that changes in hospital
size or services provided should occur in order to achieve higher efficiency, which is in
light with the presently taken health policies.
Keywords: Hospitals ; Stochastic Frontier Analysis ; Data Envelopment Analysis ;
2
2.
Introduction
In harsh times where budget cuts are the main topic in the Portuguese economy,
producing more with less has been the golden goal for a country that has been
struggling with low productivity. Efficiency is the only alternative to austerity.
The Portuguese economy is being largely affected by the public debt crisis.
Years of careless spending with low interest rates and cheap money from the European
Union, together with market speculation have led Portugal to an aggravating financial
situation ending with the country calling for help to the world’s financial institutions.
The coming of the so called Troika (European Union, European Central Bank
and IMF), has been imposing strict restrictions to the Portuguese government budget.
This austerity has already reached the Serviço Nacional de Saúde (SNS) who has
seen its annual budget cut in more than €1bn (cuts of 30% in 2012 and 20% in 2013)
and several other efficiency seeking measures, like price revision and staff cuts,
imposed by the memorandum.1
Although in Portugal hospitals are considered to be a public service with no
profit goal, they still try to minimize costs by changing input allocation so to maximize
production and comply with the given budget. (Conrad and Strauss, 1983; Scuffham et
al., 1996; Carreira, 1999 and Azevedo, 2011).
The purpose of this work project is so, to study methods that will allow a more
accurate and actual analysis of Hospitals in Portugal, understand the causes of
inefficiency for Portuguese hospitals and recommend some solutions.
The tools used to study efficiency are based in microeconomic theory, recurring
to frontier analysis, using both Data Envelopment (DEA) and Stochastic Frontier (SFA)
analysis. I will be analyzing hospital efficiency using a quadratic cost function. This
3
way I am able to compute efficiency based not only in a multi-input environment but
also take into account economies of scale and so use a more reality-oriented view.
The work project is divided in five parts. The first, Introduction, gives a starting
insight on the theme, as well as the core objectives and personal choice. The second part
reports to the Literature Overview explaining core principals of efficiency and
measurement. The third and fourth sections present the econometric analysis, explaining
the methodology used and the results. The fifth part will present the main conclusions
and recommendations, where a more managerial view of the health care service will
explain the main problems and post solutions.
Health care efficiency is for these reasons an utmost important topic, considering
it tries to preserve human dignity and health standards in an economical context where
austerity is the main driver. The efficiency goal is nowadays essential.
3.
Literature Review
3.1 Efficiency: a definition
Efficiency is the art of attaining the highest achievement with the available
resources or, on the other hand, the art of minimizing the resources used to achieve a
given goal.
Farrell (1957) defines firm efficiency to be constructed after to components:
technical efficiency and allocative efficiency. The first reports to the ability of the firm
to produce an optimal output given the resources’ (inputs) quantities available
(managerial skills), the second reflects to the use of inputs in optimal quantities given
4
Farrell’s original idea is based in input-oriented measures, where a fully efficient
firm exists, its production structure is defined and so we know the isoquant associated
with the firm’s production. Firm’s use a set of inputs to produce a unit of output.
Efficiency measures are computed using
distance measures from the firm set to the frontier,
comparing the distance from the firm actual set (P
in the graph on the left) with the distance from the
optimal point to the same axis. A particular
example of distance measurement is the line OP.
Regarding a particular case, let us imagine a firm that uses the combination of
inputs P, to produce an output quantity defined by the isoquant S. Technical inefficiency
is represented by the distance QP, which is the possible reduction in inputs for the firm
maintaining the same output, and thus be more efficient (producing the same with less
cost). Technical Efficiency is usually represented by the ratio , representing the
percentage by which all inputs should be reduced (Coelli, 1996). If we invert the
measure Technical efficiency can be measured by , which corresponds to , this
is done to define an easier efficiency measure, taking values between 0 and 1, indicating
full efficiency if one (Coelli, 1996).
From basic microeconomic consumer theory it is known that price ratios
represent the slope of the budget line. In the producer side, the same applies, and so the
input price ratio gives the producer its budget line, see line AA’ in Figure 1.
The other component of Total Efficiency, Allocative (Price) Efficiency, is
computed through the ratio , where is the reduction in costs if production was to Figure 1: Efficiency Analysis
5 take place at the optimal point Q’ (Coelli, 1996). Generally, it shows the efficiency
attained by producing an output at observed factor prices relative to the minimum costs
of producing in technical efficiency. The objective is to allocate input quantities, given
factor prices, so that cost minimization is achieved (Q’ in the graph).2
The idea is the same applied to every firm. A firm transforms input(s) into
output(s) through the production process. Hospitals use its available resources (medical
and non-medical staff, equipment, clinical instruments, and others) to treat patients.
“These inputs can be combined in various ways to obtain a certain level of activity, or
what is known in economic theory by output”.3 Firms have a cost associated with this
output called Production Cost, which results from transforming inputs into outputs
given input prices. Firms can reach efficiency by targeting the lowest cost possible for
each output level, by choosing inputs and use them in the optimal quantities reaching
cost efficiency.
3.2 Theoretical Model
In order to study efficiency the formalization of a production function is needed.
The generalized production function can be written as:
(1)
Where Y represents the maximum levels of production attainable with X input
factors. Considering duality theory, where, if the information available allows and (1)
has the necessary characteristics.4 We can obtain the Dual Cost Function, the firms’
costs given production levels assuming that firms minimize costs.
2
Forsund et al; (2007) 3
Harfouche; (2008) 4
6
C = C(Y,W)5 (2)
Where W is the vector of input prices and C the production costs.
Hospital efficiency is quite a bit different though. Inputs such as medical
instruments are not as controlled or as linearly used as in firms in other economic
sectors. Dealing with human life is different, in patient treatment doctors need to expect
the unexpected, in some cases the expenditure is larger than what it was thought and
vice-versa. “Feasible Technological combinations are not determined by the economic
analyst […] however its characterization is fundamental for an efficiency analysis”6.
For so, instead of looking at maximizing production, we take hospital outputs as
exogenous and inputs as endogenous causing the analysis to fall on the “cost side of the
equation” and perform a cost minimization analysis:
(3)
More specifically, in a multi input-output production typical of hospitals nature,
and following the studies of Carreira (1999) and Gonçalves (2008) the use of a Translog
Cost Function, with the former defined requisites, assuming hypothesis of scale and
scope economies, as well as homogeneity and substitution elasticity is preferred.7
However, a problem arises in the function, for it does not admit value zero (0)
for missing outputs, since the natural logarithm of 0 is undefined. Caves et al. (1980)
overcome this problem using the Box and Cox (1964) Metrics. Other authors, Cowing
5
Needs to present several characteristics: i) non-negative ii) linearly homogeneous in input prices iii) non-decreasing in input prices iv) concave in w v) non-non-decreasing in output levels and vi) differentiable in w (Diewert; 1982)
6
Barros; (1999) 7
7
and Holtman (1983), Akridge and Hertel (1986), Rebelo (1992) and Given (1996),
choose to use a constant proxy value close to zero (approach used in this study)8.
Other formulas such as generalized quadratic formulas, allow the use of output
with 0 value, although they are not as coherent as Translog functions since its formulae
does not represent accurately technology in hospital production The sample is
sometimes not large enough, which will lead to the use of this type of model reducing
efficiency of the estimators.
Methodology
The methods chosen to approach the cost minimization problem are based in
optimization. SFA and DEA have the same objective despite technical differences: An
efficient scale where the efforts of cost minimization (in this case) are comparable
among firms. Using both models will allow us to correct technical deficiencies.
4.1 Stochastic Frontier Analysis9
Stochastic Frontier Analysis or SFA is a technique that is based in the stochastic
error term in the econometric model. Basically, it divides the error term into two
components: inefficiency and residuals. SFA computes the inefficiency component in
the model’s error term. The Stochastic Frontier Cost Function is written as:10
(7)
is the Total Operating Cost of the i-th firm for the j-th area
is a vector of outputs ; vector input prices for the k-th input
8
The value of 0.1 is used by a wide range of authors, among them, Cowing and Holtman (1983), Rebelo (1992) and Carreira (1999). Given (1996) used 0.00001
9
Theoretical computation of Translog Function in Complementary Appendix 1. 10
8 random variables assumed to be iid N(0,σ2v), independent of
random variables assumed to account for inefficiency and are |N(0,σ2U)|
Thinking about the cost function, is the distance from the firm to the
efficiency frontier. gives us both allocative and technical inefficiencies (if allocative
efficiency is assumed from the beginning it gives us only technical inefficiency).
Individual efficiencies estimated from the Stochastic Cost Frontier, represent the
so called distance from the inefficiency point to the perfect efficiency.11
(8)
ranges between 0 and 1, being 1 total efficiency and 0 none efficiency.
Due to data nature, the cost function takes hospital outputs and input prices as
exogenous but input quantities as endogenous, since the population attending hospitals
is not controlled by the hospital itself, but the resources used are.
The same rationale follows with the use of the Translog function.12 However,
due to data restrictions a simpler version of the Translog function had to be used. This version
forfeits the cross variables in the Translog function, leading to the fall of these variables from
the original model.
(6)
11
Coelli; (1996) 12
9
Figure 2: Envelopment Frontier
Source: Kittersen 2007
4.2 Data Envelopment Analysis13
Data Envelopment Analysis or DEA was originally developed as a performance
measurement technique, for use in public and non-profit sectors, where information
about input prices is either missing or not accurate enough for a reliable analysis.
DEA methodology defines a non-parametric envelopment frontier, where firms
lie on or below (above) the production (cost) frontier (Coelli, 1996), evaluating
efficiency through output over input ratio (Figure 2 and 3).
The maximum ratio possible represents complete
efficiency since we maximize production with the
pre-defined input weights, or vice-versa, the combination of
inputs that will produce a determined output quantity.
4.2.1 CRS Assumption:
The generalized model in Appendix, (Charnes et
al. 1978) is only appropriate when all firms operate at an
optimal scale. However, imperfect competition,
financial constraints and market characteristics, can take
the firm of this optimal scale (Coelli, 1996).
Follow-up studies led to the development of a DEA model that also regarded the
influence of Variable Returns to Scale (VRS) in efficiency measures.
13
Theoretical Computation of DEA estimation in Complementary Appendix 2.
Figure 3: CRS Assumption
10
4.2.2 VRS Assumption: 14
Charnes, Cooper and Banker developed in 1984, a model that allowed the
phase-out of scale efficiencies from the efficiency scores. The VRS situation is easily achieved
from adding one more constraint to the generalized model of 1978: N1’λ =1.15
The approach transforms the former conic hull into a set of convex intersecting
planes, resulting in efficiency scores equal or higher to those in the CRS model.
The difference between the two assumptions indicates scale efficiency.
With price information, we can consider cost
minimization. This way, it is of the interest to
measure allocative and technical efficiency.Used to
compute Hospital Efficiency.
VRS assumption will emphasize the role of hospital size in the analysis. For so, it
is necessary to run first a VRS input oriented DEA model to obtain technical
efficiencies, and run the Cost Minimization simulation (13).16
Total Cost efficiency (CE) is computed by the statistical program as the ratio of
the minimum cost to observed cost: . (Coelli, 1996)
From here one can compute the Allocative Efficiency: . (Coelli 1996)
The values obtained for the efficiencies range from 0 to 1. Being 1, total
efficiency, with the firm at the frontier, and a value bellow 1inefficiency in the firm.
14
Complementary Appendix 2 15
Coelli, (1996) ; Banker et al, (1984) 16
Complementary Appendix 2
Figure 4: VRS Assumption
11
4.3 SFA vs DEA
Differences arise from the theoretical outlook of both estimations. Jacobs et al
(2006) and Gonçalves (2008) summarize these in their empirical project.17
Gonçalves (2008), Jacobs (2001) and Jacobs et al. (2006) present two main
reasons for the different results from the methods. i) differences in building the efficient
frontier ii) differences in computing the distances to the efficient frontier.18
For all these reasons, it is no surprise that efficiency scores obtained from each
estimation methods are different.
4.
Data
The data for the present work project was retrieved from the NHS Accounting
Authority; Administração Central dos Sistemas de Saúde (ACSS) database Base Dados
dos Elementos Analíticos (BDEA), from the National Health Reports from Direcção
Geral da Saúde and a compiled Deloitte database.
The number of observations should be in accordance with the general rule:
#Hospitals = (#input variables + #output variables) x 3. Unfortunately, the
unavailability of data, requested to the proper authorities at the beginning of the project,
led to a restriction in timeframe and sample size, limiting the project to a cross-section
analysis (2008) and 46 hospitals;19 a sample smaller than the optimal, according to the
rule of thumb, which will caused biased results in the estimations (specially in the
Stochastic Frontier Analysis).
17
Table 1 in Appendix 18
See Complementary Appendix 3 19
12
The independent variable used in the working project is Total Operating Cost
(TOC), since output variables are taken as independent as hospitals do not control the
demand for its products and considering that hospitals will treat every individual in
need.
5.1 Output variables:
The complexity of hospital care results in a series of outputs. Inpatient Days,
Clinical Surgery and Day Hospital, are weighted by the case mix index, retrieved from
the different “contratos-programa” for each activity, to adjust for complexity.
Emergency episodes and External Medical Appointments are taken for its
absolute value, since they are not weighted by case -mix.
5.2 Input variables:
Input variables in the estimation models reflect both quantities and prices of
inputs used in hospital production. The wide range of hospital services leads to an input
mix of far greater complexity.
Human Resources are many times one of the main assets of companies. Public
hospitals are no different. Doctors and nurses supported by technicians and other staff,
encompass the largest share in Hospital’s Total Costs (40%)20 and provide a delicate
service with great responsibility and ethical issues. Due to the data available it was
decided to de-aggregate as much as possible the numbers of different staff categories,
and so, kept four different kinds of staff: doctors, nurses, technical staff and other staff.
Wages are interpreted as labor price. Unfortunately it is very difficult to know
in reality the prices paid for each doctor, nurse or technician and so some assumptions
20
13
needed to be made. An average wage was computed for each staff category in each
hospital dividing the total cost with doctors, nurses, technicians and other staff by the
corresponding numbers, following the approach of Carreira (1999).
Drugs and clinical materials are an important current expenditure for hospitals.
However, knowing the exact quantities used is impossible. For so a compose good,
gathering both clinical material and drugs, was computed.21
In order to further show disparity between hospitals, a size variable was included
in the regression. The number of beds will be used as a proxy size.22
For data variables and variables description see Tables 2 and 3 in Appendix
5.
Results
6.1 Stochastic Frontier Analysis
Considering that hospital costs are a function of outputs and input prices as
stated before, the generalized function would be similar to equation (6).
However, estimation problems due to high correlation23 between different
variables led to model manipulation, where some first and second order variables were
taken out.24 Four hospitals were taken out of the sample for outlier reasons25.
Using STATA 11 as a support tool, the estimated coefficients are the following:
(for full estimation, see Table 7 in Appendix)
21
Variable was not used due to heavy correlation between variables and to avoid multicollinearity. If used, a relative price based on average price where every good had a certain weight, needed to be computed 22
Schuffman et al. (1996), Vita (1990) and Carreira (1999) 23
Correlation of (0,75) was used as criteria to define high correlation 24
Table 5 and 6 in Complementary Appendix for Correlation Matrix and SFA Model Possibilities 25
14
Source: Own Source Table 8: SFA Estimation
SFA Estimation Translog Estimation
lnTOC Coefficient SE lnTOC Coefficient SE lnTOC Coefficient SE
lnWT * 1684 2.05 lninpD 0.075 3605.47 lnER2 0.006 1.6e^4
lnInpD2 * 0.005 4.03 lnClS - - lnEA2 0.043 -1.5e^4
lnClS2 -0.002 -0.87 lnER -0.53 -1.8e^4 lnDH2 0.08 3.3e^4
lnER2 0.0003 0.55 lnEA -0.366 -5966.24 lnWD2 0.061 1.5e^4
lnEA2 * 0.029 11.49 lnDH -0.033 -2e^4 lnWN2 -0.29 -4.3e^4
lnDH2 * 0.007 3.82 lnWD -1.2 -1.3e^4 lnWT2 0.276 3.2e^4
lnWD2 0.005 -1.79 lnWN 6.268 4.6e^4 lnWCMDT 2 - -
lnWN2 0.011 4.83 lnWT -5.672 -3.2e^4 lnK2 0.031 4.2e^4
lnWT2 * -0.083 -2.03 lnWCMDT - - Constant 15.192 2.7e^4
lnWCMDT 2 -0.003 -0.19 lnK
- -
lnK2 * 0.0163 2 lnInpD2
0.002 1465.07
Constant 2022 0.51 lnClS2 -0.006
-5.1e^4
*significant at 5%
An Analysis of the estimators shows that some variables have unexpected signal.
Looking at the influence of Clinical Surgery and the price of Complementary Means of
Diagnose and Treatment it is expected that with an increase in activity, TOC should
increase. However by looking at the estimator values we can see that in fact it is not that
linear. In fact, the signal may result from high correlation between variables and when
taking the model as a whole, some variables might present a negative influence in TOC.
One example is shown when one largely discussed input variable, Doctor Wage,
increases by 1 percentage point will cause an increase in TOC of 0.005 percentage
points. Observing now one output variable, External Appointments, we can see how it
influences Total Operational Cost, causing an increase of 0.029 percentage points when
EA varies only 1 percentage point, showing the weight of this area in the final cost.
STATA allows the user to obtain inefficiency scores26 for the different hospitals
by computing the residuals in the error term. Scores were mathematically manipulated
inverting the results obtained from STATA, normalizing the scores to represent an
26
15
Source: Own Source
Source: Own Source Source: Own Source
efficiency measure from 0 to 1, with 1 being perfect efficiency. Results can now be
compared to the DEA scores. (Table 9 in the Appendix shows full rank).
6.2 Data Envelopment Analysis
The non-parametric DEA model takes in account the same variables used in SFA
in order to maintain coherence and achieve the cost minimizing input quantities.
The statistical tool used is the software developed by T. Coelli, DEAP. In first
phase input oriented VRS analysis, we obtain optimal input quantities. Secondly, we
take these optimal quantities and input prices to perform the cost option and obtain the
economic efficiency scores. The program’s output presents efficiency scores from 0 to
1, with 1 being total efficiency. It os easy to see that there are a lot of hospitals
considered to reach total efficiency (Table 9 in Appendix for full rank).
6.3 Comparing results
Results show similar statistics despite ranks
being different.27 Gonçalves (2008) performs two tests to
check result similarity and statistical significance.28
27
Figure 7 in Complementary Appendix , and figure 8 in page 16
Comparing Results
SFA DEA
46 Observations 46
0.86 Mean 0.87
0.11 Standard Deviation 0.14
Table 10: SFA vs DEA
16
A Correlation test suggests that the estimations are not that similar (0.24), in
fact, by looking at the values we can see that the ranks are really different, contrary to
the results of Gonçalves (2008). This happens not only because of the different models
but also of the variables chosen.29
Clinical Surgery was used not only to differentiate the working paper but also
since it has been the area to which specialists have been turning to (around forty percent
of hospital programmed surgery was Clinic Surgery in 200830). Recent developments
have led former procedures to become simpler, allowing hospitals to transit patients to
clinical surgery. Small and fast surgical procedures which do not require inpatient
treatment and decrease costs massively, are preferred to extensive and more expensive
procedures if allowed by complexity and patients pathology.
Difference in ranks is justified by the differences in models’ specification.
Analyzing the peer effects from DEA, it is curious that the peers for both the top and
bottom 25% efficient hospitals are themselves, which suggest perfect technical
efficiency. However, combinations of input prices and quantities stated highly
inefficient resource allocation decreasing the total score. Hospitals may have an over or
under-usage of doctors, nurses, and other inputs, which is one way to say that the costs
with several inputs are too high (low) given what is produced, affecting scores and
considering efficient hospitals in SFA inefficient in DEA.31
The Wilcoxon Test for statistical significance analyses consistency between
scores of both estimations.32 Following the results from Table 11, there is consistency
between scores of both estimations, however there are still some differences in ranks for
28
Correlation test and a Wilcoxon Rank test 29
Gonçalves considered a maximization problems and different input variables 30
Relatório e Contas Do Serviço Nacional de Saúde 2008; ACSS 31
Difference in ranks of CH Trás-dos-Montes e Alto Douro, Table 9 32
17
Source: Own Source
several hospitals, as seen in the graph below. This happens due to model differences.
DEA considers firms that do not have a valid peer (similar carachteristics but different
outputs) to be tottaly efficient, and suffers from outlier influence33, which explains so
many highly efficient hospitals and differences between ranks.
6.
Discussion
The analysis of efficiency scores for both estimations led to several
efficiency-oriented conclusions. Increasing Returns to scale give possibility to increase hospital
sizing; DEAP output shows the transfer of hospital services between units could
increase efficiency; Managerial skills were also draw to analysis.
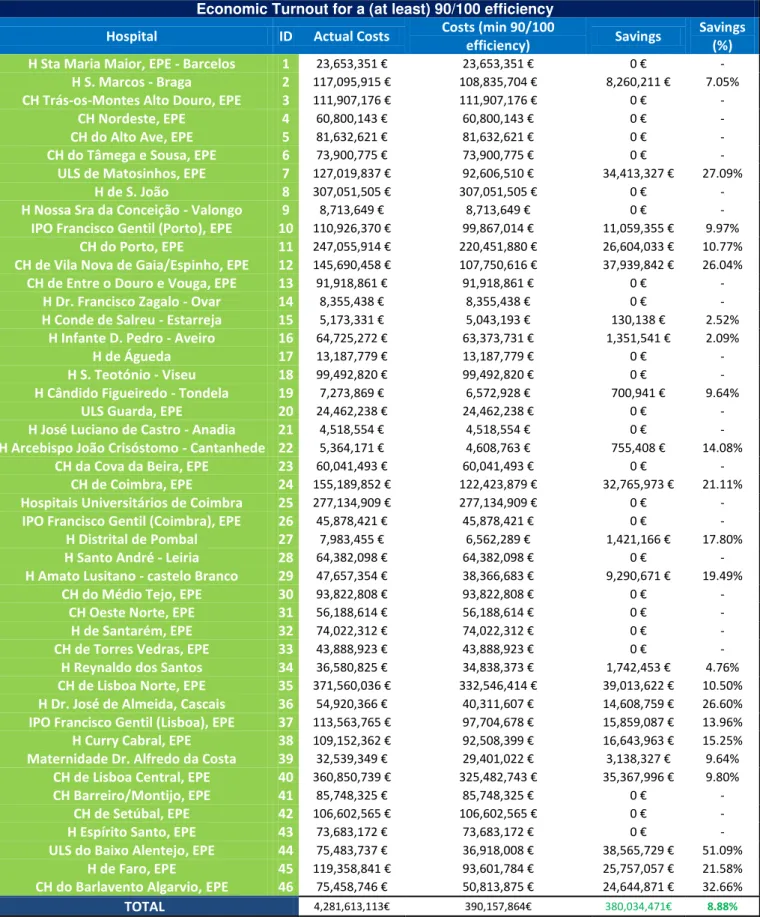
Following the results obtained in the Stochastic Frontier Analysis, and to show
the importance of hospital efficiency in a frugal economic context, savings estimations
were made to see how much Serviço Nacional de Saúde was to save if every hospital
performed at a score of (at least) 90 in the SFA estimation. Table 12 in Complementary
Appendix shows the results of such estimation. Despite hospitals below the score limit
(90) being no more than a few (22), final results show savings of around 400 Million
33
A follow up DEA estimation was done, dropping the 2 highest and lowest efficient hospitals. Correlation between scores of the new estimation vs original estimation is of about 0.64, clearly stating outlier influence in the DEA Estimation Model.
18
Euros each year (4.57% of SNS’s Annual budget)34 a reduction in Total Operation
Costs of about ten percent! It is patent the emergency of a general efficiency increase.
The analysis of technical efficiency scores from the DEAP output led to the
conclusion that hospitals are in increasing returns to scale (IRS) performance. Hospitals
can take advantage of economies of scale, growing up to the optimal point reaching the
Minimum Efficient Scale (Minimum Average Cost). This outcome is in line with several
recent efforts, with mergers in several public hospitals (e.g. Merger of Hospital Santa
Maria, EPE and Hospital Pulido Valente into CH Lisboa Norte, EPE).
One curious fact is however the reduction in the number of beds for some
hospitals (Table 13 in Complementary Appendix). This does not mean that the hospitals
should be smaller, it means that decision makers should emphasize policies towards
patient treatment capacity instead of infrastructural increase.
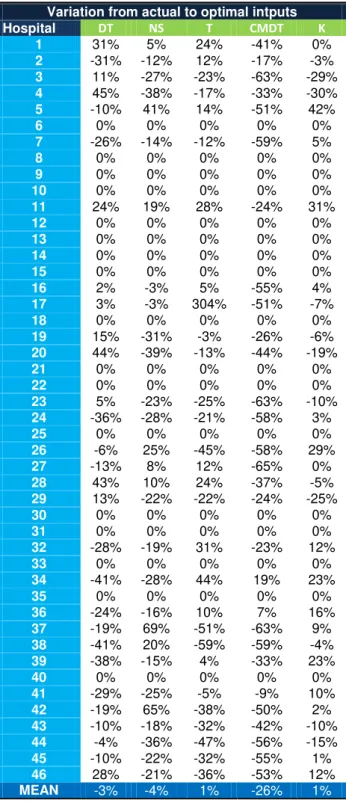
One other efficiency-oriented measure would be the transfer of several services
from some hospitals to other more efficient and with “room to grow” hospitals. A
production area in IRS with growth potential in one hospital can be more efficient that
the same production area in a nearby hospital. Results show that to achieve efficiency
some of the hospitals should increase an output and decrease another (e.g. CH Coimbra
should increase Clinical Surgery and decrease Day Hospital); of course, they cannot be
replaced one by the other and also, depending also on the specificity of said hospital.35
However, we must bear in mind that aggregating two or more hospitals is not a
linear process. Impact studies on the population served should be done to ensure that the
social outcome of aggregating hospital is positive.
34
Serviço Nacional de Saúde annual budget: 8.3075€ billion; source: Relatório e Contas SNS, 2008
35
19
Clinical surgery is a cost efficient activity. Health Care development has (as
previously mentioned) created the conditions for complicated procedures to become
simpler; the patient “becomescheaper” and goes home earlier. A win-win situation.
Despite model limitations with regard to input usage, it is clear to observe that
resource spending is, in some cases, excessive.36
A managerial approach to the results led to the realization of an informal enquiry
in Delloite’s Health Staff. The enquiry was asked to seven Deloitte Professionals and
had for data the 25% best and worst performing hospitals, asking for an efficiency score
based on the knowledge from working with a certain hospital. In order to disclose the
reasons for such differences, causes for inefficiency (efficiency) were also asked. 37
Different reasons were exposed as causes for inefficiency,38 but great emphasis
was brought upon Human Capital. Managerial skills of both decision makers and
clinical staff were pointed out as the main cause for an inefficient score. Other reasons
of insufficient supply diversification or poor effort in efficiency seeking led to lower
scores than expected.39 These reasons cannot be directly input in the models for obvious
mathematical reasons (it is impossible to know exactly the skill of a doctor or health
management), which can explain different results from the staff’s expectations.
However, if a certain hospital is considered efficient (Hospital São João), the
scores are high and reasons stated are satisfactory; Cost control, both in human
resources and drug use, as well as a high specialization pattern help to achieve
efficiency, according to Deloitte Professionals.
36
Table 12 in Complementary Appendix 37
Table 15 in Complementary Appendix 38
Table 16 in Complementary Appendix 39
20
7.
Conclusions
In choosing one of the methods to perform the efficiency analysis, I would have to
say that the choice should rest upon not only on data availability and quality but also on
the final objectives of the analysis. DEA methods allow an easier estimation since it
does not require a parametric background, with a multiple output analysis. SFA requires
a parametric analysis with hypothesis testing, not perform well with small samples.
From the Discussion above, it is fair to conclude that recent policies have been in
light with efficicency seeking goals. A more emphasys to clinical care and the
understanding of taking advantage of economies of scale have been patent in the recent
hospital mergers and service transfers between hospitals. Human resources are now
carefully planned, hring new staff is now satrting to have in mind future health
careneeds instead of onely present.40
Nevertheless, limitations have risen during the project sharing the same problems
with others. Lack of Data availability led to some assumptions that may not be in line
with reality (average prices and composite goods). Shortage in the number of
observations influenced results in the SFA estimation, while outlier presence has had a
similar effect in DEA. Other limitations intrinsic to the nature of the model do not take
into account some crucial aspects that clearly influence public hospital reality;
managerial capacity, the negotiation power of different players, and the supply of
different services unajusted to reality, since it only takes in account global indicators.41
Given the present outlook of the Portuguese economy and Serviço Nacional de
Saúde’s budgetary perspectives, an efficiency ranking is more than welcome so that cost
efficiency goals are achieved and full efficiency is reached at a national level.
40
ACSS (2011), “Actuais e Futuras Necessidades Previsionais de Médicos (SNS) ”
21
8.
References
ACSS; Rede Hospitalar do SNS 2012; www.acss.min-saude.pt
ACSS; Relatório e Contas do SNS 2008; www.acss.min-saude.pt
Azevedo, Helda (2011) “Economias de Escala em Centros Hospitalares”. Escola
Nacional de Saúde Pública – Universidade Nova de Lisboa
Barros, Pedro Pita (2009) “Economia da Saúde - Conceitos e Comportamentos”,
Almedina
Coelli et al (2005) “An Introduction to Efficiency and Productivity Analysis”;
2nd Edition; Springer
Coelli, Timothy (1996) “A Guide to DEAP Version 2.1: A Data Envelopment
Analysis (computer) Program”; University of New England, Australia; Paper 96/08
Coelli, Timothy (1996) “A Guide to FRONTIER Version 4.1: A Computer
Program for Stochastic Frontier Production and Cost Function Estimation”; University
of New England Australia; Paper 7/96
Cross, Robin and Fare, Rolf (2008) “Farrell Efficiency Under Value and
Quantity Data” Journal of Productivity Analysis (2008) 29:193–199
European Union (2012) “Memorando de Entendimento Sobre as
Condicionalidades De Política Económica”; Saúde: 17-20
Folland, Sherman and Hofler, Richard (2001) “How Reliable Are Hospital
Efficiency Estimates?: Exploiting the Dual to Homothetic Production”; Oakland
University and Florida University
Førsund, Finn; Kittelsen, Sverre and Krivonozhko, Vladimir (2007) “Farrell
22
Fortuna, André (2009), “The Optimum Size of the Portuguese Public Hospital”.
Universidade Nova de Lisboa
Gannon, Brenda (2004) “Technical Efficiency of Hospitals in Ireland”. Working
Paper 18; University of Ulster
Gonçalves, Luís (2008), “Análise da Eficiência dos Hospitais SA e SPA Segundo
uma Abordagem de Fronteira de Eficiência”. ISCTE Business School. 123-211
Gonçalves, Ricardo and Barros, P.P. (2013) “Economies of Scale and Scope in
the Provision of Diagnostic Techniques and Therapeutic Services in Portuguese
Hospitals” Applied Economics, 45:4, 415-433
Jacobs, Rowena (2000) “Alternative Methods to Examine Hospital Efficiency:
Data Envelopment Analysis and Stochastic Frontier Analysis”; The University of York;
Discussion Paper 177
Jacobs, Rowena; Smith, Peter and Street, Andrew (2006) “A comparison of SFA
and DEA” in “Measuring Efficiency in Health Care: Analytic Techniques and Health
Policy”. Cambridge University, pages to 151 to 166
Lovell, C. Knox ( ) “Frontier Analysis in Health Care”. University of Georgia
Mortimer, Duncan and Peacock, Stuart (2002) “Hospital Efficiency
Measurement: Simple Ratios vs Frontier Methods”; Centre for Health Program
Evaluation, Australia
World Economic Outlook Database 2012, IMF; April 2012;
http://www.imf.org/external/pubs/ft/weo/2012/01/weodata/index.aspx
Yong, Karen and Harris, Anthony (1999) “Efficiency of Hospitals in Victoria
under Casemix Funding: A Stochastic Frontier Approach”; Centre for Health Program
23 Table 1: Comparing Methodologies
9.
Appendix
Table 3: Data Description
Variable Name Defintition
TOC Total Operational Cost Annual costs excluding capital expenses
InpD Inpatient Days Total inpatient days weighted by case mix
ClS Clinical Surgery Clinical Surgery episodes weighted by case mix
DH** Day Hospital Day Hospital Sessions weighted by case mix
ER Emergency episodes Number Emergency episodes
EA External Appointments Number of external appointments
DT Doctors Number of Doctors
NS Nurses Number of Nurses
T Technicians Number of Health technical staff
OS* Other Staff Number of other staff including supervisors
DClM Drugs & Medical Material Quantities of Drugs and Medical Materials used
CMDT Complementary Means of Diagnose and Treatment Number of weighted Means od Diagnose and Treatment
K Beds Number of Beds
WD Doctor's Wage Average Doctor's Anual salary
WN Nurse's Wage Average Nurses' Anual salary
WT Tecnician's Wage Average Technical Staff's Anual salary
WOS* Other Sff's Wage Average Other staff's Anual salary
WDCIM* Drugs & Medical Material price GDP Deflator
WCMDT CMDT Price Average CMDT Anual Price
WK Price of Beds Representative price of beds (=1)
*For purposes of correlation and collinearity these variables have been taken out for the SFA estimation,
they were also taken out of the DEA estimation for both estimations so that they could be compared
** Correlated with other variables but significant for analysis, considered in the models
Comparing Methods SFA DEA
Assumption about Functional Form Strong* None
Distinguish Random Error from
Efficiency Variation Yes None
Test for Inclusion of variables Imperfectly No
Allow for Exogenous Factors Yes Yes
Allow for Multiple Outputs Not readily Yes
Provides Information on "Peer"
Organizations Not automatically Yes
Vulnerable to Outliers Moderately* Yes
Problems of Multicollinearity Yes* No
Problems of Endogeneity Yes* Yes
Problems of Heteroscedasticity Yes* No
Vulnerable to Small Sample Size Yes* Moderately
*Assumption is testable
Source: Own Source
24
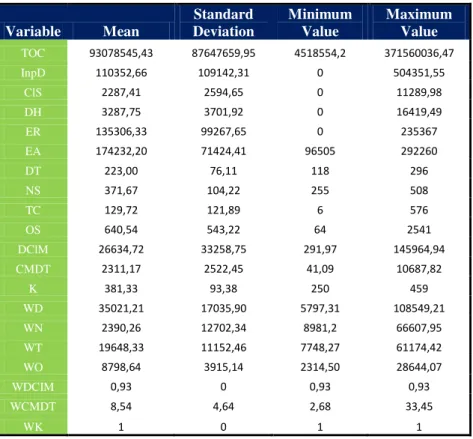
Table 4: Statistical Data
Variable Mean
Standard Deviation
Minimum Value
Maximum Value TOC 93078545,43 87647659,95 4518554,2 371560036,47
InpD 110352,66 109142,31 0 504351,55
ClS 2287,41 2594,65 0 11289,98
DH 3287,75 3701,92 0 16419,49
ER 135306,33 99267,65 0 235367
EA 174232,20 71424,41 96505 292260
DT 223,00 76,11 118 296
NS 371,67 104,22 255 508
TC 129,72 121,89 6 576
OS 640,54 543,22 64 2541
DClM 26634,72 33258,75 291,97 145964,94
CMDT 2311,17 2522,45 41,09 10687,82
K 381,33 93,38 250 459
WD 35021,21 17035,90 5797,31 108549,21
WN 2390,26 12702,34 8981,2 66607,95
WT 19648,33 11152,46 7748,27 61174,42
WO 8798,64 3915,14 2314,50 28644,07
WDCIM 0,93 0 0,93 0,93
WCMDT 8,54 4,64 2,68 33,45
WK 1 0 1 1
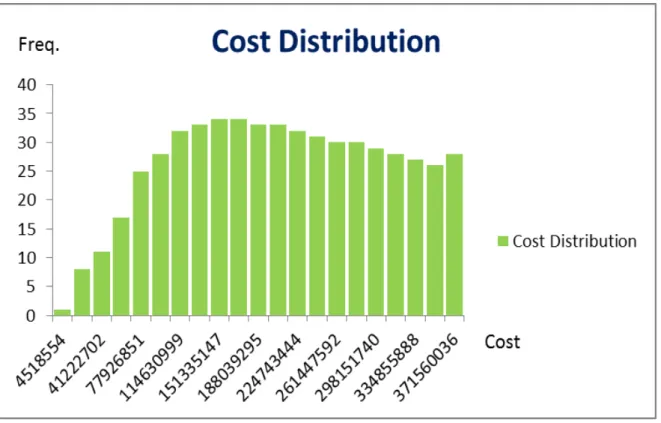
Table 7: STATA Coefficients table*
*Exponential distribution of Hospital Cost (Complementary Appendix Figure 5), required the
Exponential Distribution option on STATA estimation Source: Own Source
25
Table 9: Efficiency Scores
SFA Efficiency Scores RANK DEA Efficiency Scores
ID Hospitals SFA
Score ID Hospitals
DEA Score
6 CH do Tâmega e Sousa, EPE 0.98 1 6 CH do Tâmega e Sousa, EPE 1
30 CH do Médio Tejo, EPE 0.97 2 8 H de S. João 1
28 H Santo André – Leiria 0.96 3 9 H Nossa Sra da Conceição - Valongo 1
21 H José Luciano de Castro - Anadia 0.96 4 10 IPO Francisco Gentil (Porto), EPE 1
18 H S. Teotónio – Viseu 0.96 5 12 CH de Vila Nova de Gaia/Espinho, EPE 1
1 H Sta Maria Maior, EPE - Barcelos 0.96 6 13 CH de Entre o Douro e Vouga, EPE 1
26 IPO Francisco Gentil (Coimbra), EPE 0.95 7 14 H Dr. Francisco Zagalo - Ovar 1
14 H Dr. Francisco Zagalo - Ovar 0.95 8 15 H Conde de Salreu - Estarreja 1
20 ULS Guarda, EPE 0.95 9 18 H S. Teotónio - Viseu 1
17 H de Águeda 0.95 10 21 H José Luciano de Castro - Anadia 1
5 CH do Alto Ave, EPE 0.95 11 22 H Arcebispo João Crisóstomo - Cantanhede 1
33 CH de Torres Vedras, EPE 0.95 12 25 Hospitais Universitários de Coimbra 1
8 H de S. João 0.94 13 30 CH do Médio Tejo, EPE 1
3 CH Trás-os-Montes Alto Douro, EPE 0.94 14 31 CH Oeste Norte, EPE 1
9 H Nossa Sra da Conceição - Valongo 0.94 15 33 CH de Torres Vedras, EPE 1
25 Hospitais Universitários de Coimbra 0.94 16 35 CH de Lisboa Norte, EPE 1
13 CH de Entre o Douro e Vouga, EPE 0.93 17 40 CH de Lisboa Central, EPE 1
32 H de Santarém, EPE 0.93 18 28 H Santo André - Leiria 0.97
23 CH da Cova da Beira, EPE 0.93 19 44 ULS do Baixo Alentejo, EPE 0.96
4 CH Nordeste, EPE 0.93 20 36 H Dr. José de Almeida, Cascais 0.95
41 CH Barreiro/Montijo, EPE 0.92 21 1 H Sta Maria Maior, EPE - Barcelos 0.94
42 CH de Setúbal, EPE 0.90 22 11 CH do Porto, EPE 0.93
31 CH Oeste Norte, EPE 0.90 23 23 CH da Cova da Beira, EPE 0.93
43 H Espírito Santo, EPE 0.90 24 29 H Amato Lusitano - castelo Branco 0.92
16 H Infante D. Pedro – Aveiro 0.90 25 41 CH Barreiro/Montijo, EPE 0.92
15 H Conde de Salreu – Estarreja 0.89 26 43 H Espírito Santo, EPE 0.92
35 CH de Lisboa Norte, EPE 0.65 27 34 H Reynaldo dos Santos 0.91
34 H Reynaldo dos Santos 0.88 28 42 CH de Setúbal, EPE 0.91
2 H S. Marcos – Braga 0.85 29 2 H S. Marcos - Braga 0.82
19 H Cândido Figueiredo - Tondela 0.83 30 17 H de Águeda 0.82
39 Maternidade Dr. Alfredo da Costa 0.83 31 19 H Cândido Figueiredo - Tondela 0.82
40 CH de Lisboa Central, EPE 0.83 32 5 CH do Alto Ave, EPE 0.81
10 IPO Francisco Gentil (Porto), EPE 0.83 33 45 H de Faro, EPE 0.81
11 CH do Porto, EPE 0.82 34 4 CH Nordeste, EPE 0.8
37 IPO Francisco Gentil (Lisboa), EPE 0.79 35 32 H de Santarém, EPE 0.8
22 H Arcebispo João Crisóstomo - Cantanhede 0.79 36 16 H Infante D. Pedro - Aveiro 0.74
38 H Curry Cabral, EPE 0.78 37 20 ULS Guarda, EPE 0.73
27 H Distrital de Pombal 0.76 38 46 CH do Barlavento Algarvio,EPE 0.73
29 H Amato Lusitano - castelo Branco 0.74 39 39 Maternidade Dr. Alfredo da Costa 0.72
24 CH de Coimbra, EPE 0.73 40 26 IPO Francisco Gentil (Coimbra), EPE 0.68
45 H de Faro, EPE 0.72 41 7 ULS de Matosinhos, EPE 0.63
12 CH de Vila Nova de Gaia/Espinho, EPE 0.68 42 24 CH de Coimbra, EPE 0.63
36 H Dr. José de Almeida, Cascais 0.68 43 38 H Curry Cabral, EPE 0.63
7 ULS de Matosinhos, EPE 0.67 44 27 H Distrital de Pombal 0.62
46 CH do Barlavento Algarvio,EPE 0.62 45 37 IPO Francisco Gentil (Lisboa), EPE 0.59
44 ULS do Baixo Alentejo, EPE 0.45 46 3 CH Trás-os-Montes Alto Douro, EPE 0.56
26
Hospital Efficiency
Directed Internship: Deloitte & NOVA SBE
Pedro Sucena e Castro, #486
27
1-Translog Function
The Translog function is given by an arithmetical computation applied to the
short run cost function of the second order Taylor’s Series,
, being the short-run cost function (4)
Where k is the amount of the fixed input (In the specificity of the case, k is the
dimension proxy)
12 =12=12 ln ln +12 11 2
+=13=12 ln ln ++=13 1ln ln + =12 1ln ln +
(5)
Where TOC is the Total Operational Cost, yi the outputs, wk the input prices, k
the fixed input and the error factor. It is easy to see the limit of the Translog functions
when firms have output 0, , where , and so, is unidentified.
Given the number of observations with null values it is easier to use, and does
not influence negatively the coherence of the study, a proxy closer to zero (0.1)42 to
correct the limitation given by the Translog function.
As said before, to consider the Translog function as a valid cost function we
need to impose the properties of a cost function: i) symmetry restrictions in the second
order terms ii) linear homogeneity in input prices.
42
28
The Translog function computes a large series of estimates for a small number of
inputs and outputs. For that fact it is normal to present strong correlation between
variables originating problems of multicollinearity. To minimize this possibility, a set of
share equations for a multivariate regression system is adjusted to the model, increasing
the efficiency of the estimators. Using the Shephard’s Lemma and differentiating
equation (5) to each input price we have the required Share Equations.
2- DEA Method
Choice of optimal input weights uses Linear Programming: (Coelli, 1996)
,
(9)
Statistical programs allows us to compute the values for u and v that maximize
efficiency measures for the different firms, subject to the constraint that this measures
need to be less or equal to one.
The duality property allows us to achieve the desired DEA model:
, ; (11)
Where θ is a scalar and is a vector of Nx1 constants. θ is the efficiency score
for the firm. It is smaller than one, with one being total efficiency (on the frontier), and
zero, total inefficiency. (Farrell, 1957), (Coelli,1996).
29
, ; (12)
Cost minimization simulation: (Coelli 1996)
, ; (13)
Given that wi is a vector input prices for the ith firm and xi* (computed in the
first regression) is the vector of the optimal input quantities, given input prices, and
output quantities yi
3- SFA vs DEA
Following Gonçalves (2008),
When building the efficiency frontier, DEA assumes a correct specification by
drawing the frontier in sections with real information (peers) and data is observed
without errors (Gonçalves, 2008). SFA estimation considers errors and so, even if the
frontiers are the same, the scores will be different from DEA. In situations where the
error component is important, the best method to use is SFA since it inputs the error in
the analysis whilst DEA may consider units to be wrongly efficient.
In computing distances and defining efficiency scores, DEA builds efficiency
scores for each firm by comparison with other firms (peers) of comparable outputs
(Gonçalves 2008). This brings along two major problems, one is that if there is no
comparable firm within the sample, the analyzed firm is considered to be technically
30 is so because it is being compared with the firm’s peer and not any other inefficient
firms. SFA considers all the information in the sample. (Gonçalves, 2008)
The SFA estimation requires, opposite to DEA, a functional form of a production
function. Basically, it requires the analyst to theoretically define the problem and not
just compute the solution through the statistical software. This allows the user to test the
validity of the data in hand. (Banker, 1996; Grosskopf, 1996; Gonçalves, 2008)
However, DEA presents one important advantage: it allows the analysis of a
multi-output problem, whereas SFA requires a two-step estimation. (Jacobs et al, 2006)
Regarding outlier influence, DEA estimations are easily influenced, taking
outliers as super-efficient firms. SFA scores are highly dependent of information present
in the sample; the problem is simply overcome by sample manipulation.
Sample dimension also has its influence in the different methods. SFA requires a large
sample, with size highly dependent of the number of parameters. The non-parametric
31
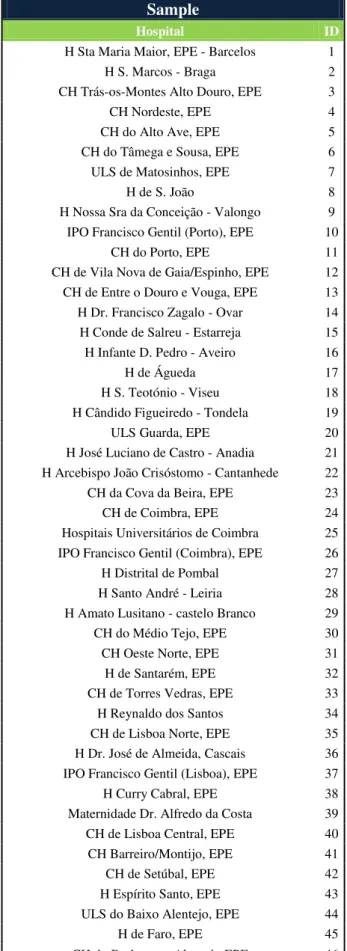
Table 2: Sample list
Sample
Hospital ID
H Sta Maria Maior, EPE - Barcelos 1
H S. Marcos - Braga 2
CH Trás-os-Montes Alto Douro, EPE 3
CH Nordeste, EPE 4
CH do Alto Ave, EPE 5
CH do Tâmega e Sousa, EPE 6 ULS de Matosinhos, EPE 7
H de S. João 8
H Nossa Sra da Conceição - Valongo 9 IPO Francisco Gentil (Porto), EPE 10
CH do Porto, EPE 11
CH de Vila Nova de Gaia/Espinho, EPE 12 CH de Entre o Douro e Vouga, EPE 13 H Dr. Francisco Zagalo - Ovar 14 H Conde de Salreu - Estarreja 15 H Infante D. Pedro - Aveiro 16
H de Águeda 17
H S. Teotónio - Viseu 18 H Cândido Figueiredo - Tondela 19
ULS Guarda, EPE 20
H José Luciano de Castro - Anadia 21 H Arcebispo João Crisóstomo - Cantanhede 22 CH da Cova da Beira, EPE 23
CH de Coimbra, EPE 24
Hospitais Universitários de Coimbra 25 IPO Francisco Gentil (Coimbra), EPE 26 H Distrital de Pombal 27 H Santo André - Leiria 28 H Amato Lusitano - castelo Branco 29 CH do Médio Tejo, EPE 30
CH Oeste Norte, EPE 31
H de Santarém, EPE 32
CH de Torres Vedras, EPE 33 H Reynaldo dos Santos 34 CH de Lisboa Norte, EPE 35 H Dr. José de Almeida, Cascais 36 IPO Francisco Gentil (Lisboa), EPE 37
H Curry Cabral, EPE 38
Maternidade Dr. Alfredo da Costa 39 CH de Lisboa Central, EPE 40 CH Barreiro/Montijo, EPE 41
CH de Setúbal, EPE 42
H Espírito Santo, EPE 43 ULS do Baixo Alentejo, EPE 44
H de Faro, EPE 45
CH do Barlavento Algarvio,EPE 46
32
So
u
rc
e
: O
wn S
o
u
rc
e
Ta
b
le
5
:
C
o
rr
ela
ti
o
n
M
a
33
Source: Own Source
34
Total Model Cobb-Douglas Chosen Model Chosen Model (significant vars)
0.075 0.124 (3605.47) (3.93) 0.684 (7.80) -0.053 -0.0001 (-1.8e+04) (-0.01) -0.366 0.684 (-5966.24) (7.80) -0.033 0.023 (-2.0e+04) (1.37) -1.200828 0.154 (-1.3e+04) ( 1.70)
6.268 0.120
(4.6e+04) (1.40)
-5.672 -0.010 1.684 1.628
(-3.2e+04) (-0.10) (2.05) (1.76)
0.140 (1.41) 0.227 (1.96)
0.002 0.005 0.006
(1465.07) (4.03) (4.55)
-0.006 -0.0021
(-5.1e+04) (-0.87)
0.006 0.003
(1.6e+04) (0.55)
0.043 0.029 0.028
-1.50E+04 (11.49) (10.77)
0.008 0.007 0.008
(3.3e+04) (3.82) (5.22)
0.061 0.0054 0.005
(1.5e+04) -1.79 (1.65)
-0.290 0.011 0.011
(-4.3e+04) (4.83) (4.69)
0.276 -0.083 -0.081
(3.2e+04) (-2.03) (-1.76)
-0.003 (-0.19)
0.031 0.016 0.014
(4.2e+04) (2) (2.22)
15.192 4.015 2.022 2.400
(2.7e+04) (3.85) (0.51) (0.54)
-38.220 -3.577 -5.801 -5.286
(-0.13) (-6.69) (-9.31) (-9.79)
-3.675 -5.655 -3.580 -3.775
(-12.46) (-1.39) (-9.99) (-8.83)
2.128 3.036 0.354 31700000.000 0.071 0.055 0.167 0.151 0.167 0.000
SFA Models' specification
0.028 0.031 0.031 0.025 -0.059 0.159 sqlnWD sqlnDH lambda sigma2 sigma_u sigma_v /lnsig2u -sqlnExtAp sqlnER sqlnClinC sqlnInpDays /lnsig2v _cons sqlnk sqlnWCMDT sqlnWT sqlnWN lnWN lnWD -lnTOC lnInpDays lnDH lnExtAp lnER lnClinC -- -lnk lnWCMDT lnWT Coef. (z)
-Table 6: SFA model comparison
35
Source: Own Source
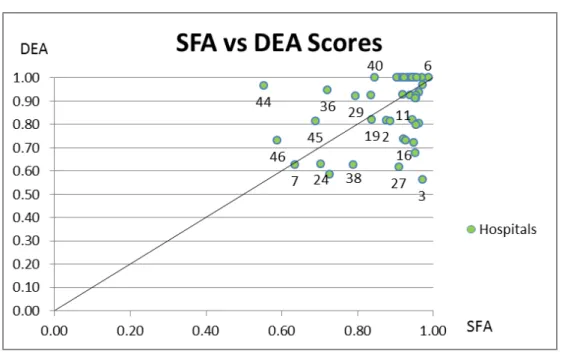
Results show that in 19 observation the values of the SFA estimation are
superior to the scores of the DEA, and vice-versa for other 27 observations. A joint
significance test (null hypothesis: Ho: te = DEA, meaning the median of scores is
equally centered for both models), being te the SFA efficiency scores presented with the
Wilcoxon Test, shows results that the null hipothesis is not rejected for the pvalues,
evidencing consistency between scores of both estimations
Figure 7 : SFA vs DEA Scores
Source: Own Source
36 Table 12: Economic result of achieving a (at least) 90/100 efficiency (drawn from SFA)
Economic Turnout for a (at least) 90/100 efficiency
Hospital ID Actual Costs Costs (min 90/100
efficiency) Savings
Savings (%)
H Sta Maria Maior, EPE - Barcelos 1 23,653,351 € 23,653,351 € 0 € -
H S. Marcos - Braga 2 117,095,915 € 108,835,704 € 8,260,211 € 7.05%
CH Trás-os-Montes Alto Douro, EPE 3 111,907,176 € 111,907,176 € 0 € -
CH Nordeste, EPE 4 60,800,143 € 60,800,143 € 0 € -
CH do Alto Ave, EPE 5 81,632,621 € 81,632,621 € 0 € -
CH do Tâmega e Sousa, EPE 6 73,900,775 € 73,900,775 € 0 € -
ULS de Matosinhos, EPE 7 127,019,837 € 92,606,510 € 34,413,327 € 27.09%
H de S. João 8 307,051,505 € 307,051,505 € 0 € -
H Nossa Sra da Conceição - Valongo 9 8,713,649 € 8,713,649 € 0 € -
IPO Francisco Gentil (Porto), EPE 10 110,926,370 € 99,867,014 € 11,059,355 € 9.97%
CH do Porto, EPE 11 247,055,914 € 220,451,880 € 26,604,033 € 10.77%
CH de Vila Nova de Gaia/Espinho, EPE 12 145,690,458 € 107,750,616 € 37,939,842 € 26.04%
CH de Entre o Douro e Vouga, EPE 13 91,918,861 € 91,918,861 € 0 € -
H Dr. Francisco Zagalo - Ovar 14 8,355,438 € 8,355,438 € 0 € -
H Conde de Salreu - Estarreja 15 5,173,331 € 5,043,193 € 130,138 € 2.52%
H Infante D. Pedro - Aveiro 16 64,725,272 € 63,373,731 € 1,351,541 € 2.09%
H de Águeda 17 13,187,779 € 13,187,779 € 0 € -
H S. Teotónio - Viseu 18 99,492,820 € 99,492,820 € 0 € -
H Cândido Figueiredo - Tondela 19 7,273,869 € 6,572,928 € 700,941 € 9.64%
ULS Guarda, EPE 20 24,462,238 € 24,462,238 € 0 € -
H José Luciano de Castro - Anadia 21 4,518,554 € 4,518,554 € 0 € -
H Arcebispo João Crisóstomo - Cantanhede 22 5,364,171 € 4,608,763 € 755,408 € 14.08%
CH da Cova da Beira, EPE 23 60,041,493 € 60,041,493 € 0 € -
CH de Coimbra, EPE 24 155,189,852 € 122,423,879 € 32,765,973 € 21.11%
Hospitais Universitários de Coimbra 25 277,134,909 € 277,134,909 € 0 € -
IPO Francisco Gentil (Coimbra), EPE 26 45,878,421 € 45,878,421 € 0 € -
H Distrital de Pombal 27 7,983,455 € 6,562,289 € 1,421,166 € 17.80%
H Santo André - Leiria 28 64,382,098 € 64,382,098 € 0 € -
H Amato Lusitano - castelo Branco 29 47,657,354 € 38,366,683 € 9,290,671 € 19.49%
CH do Médio Tejo, EPE 30 93,822,808 € 93,822,808 € 0 € -
CH Oeste Norte, EPE 31 56,188,614 € 56,188,614 € 0 € -
H de Santarém, EPE 32 74,022,312 € 74,022,312 € 0 € -
CH de Torres Vedras, EPE 33 43,888,923 € 43,888,923 € 0 € -
H Reynaldo dos Santos 34 36,580,825 € 34,838,373 € 1,742,453 € 4.76%
CH de Lisboa Norte, EPE 35 371,560,036 € 332,546,414 € 39,013,622 € 10.50%
H Dr. José de Almeida, Cascais 36 54,920,366 € 40,311,607 € 14,608,759 € 26.60%
IPO Francisco Gentil (Lisboa), EPE 37 113,563,765 € 97,704,678 € 15,859,087 € 13.96%
H Curry Cabral, EPE 38 109,152,362 € 92,508,399 € 16,643,963 € 15.25%
Maternidade Dr. Alfredo da Costa 39 32,539,349 € 29,401,022 € 3,138,327 € 9.64%
CH de Lisboa Central, EPE 40 360,850,739 € 325,482,743 € 35,367,996 € 9.80%
CH Barreiro/Montijo, EPE 41 85,748,325 € 85,748,325 € 0 € -
CH de Setúbal, EPE 42 106,602,565 € 106,602,565 € 0 € -
H Espírito Santo, EPE 43 73,683,172 € 73,683,172 € 0 € -
ULS do Baixo Alentejo, EPE 44 75,483,737 € 36,918,008 € 38,565,729 € 51.09%
H de Faro, EPE 45 119,358,841 € 93,601,784 € 25,757,057 € 21.58%
CH do Barlavento Algarvio, EPE 46 75,458,746 € 50,813,875 € 24,644,871 € 32.66%
37 Table 13: Variation in actual to optimal input
Variation from actual to optimal intputs
Hospital DT NS T CMDT K
1 31% 5% 24% -41% 0%
2 -31% -12% 12% -17% -3%
3 11% -27% -23% -63% -29%
4 45% -38% -17% -33% -30%
5 -10% 41% 14% -51% 42%
6 0% 0% 0% 0% 0%
7 -26% -14% -12% -59% 5%
8 0% 0% 0% 0% 0%
9 0% 0% 0% 0% 0%
10 0% 0% 0% 0% 0%
11 24% 19% 28% -24% 31%
12 0% 0% 0% 0% 0%
13 0% 0% 0% 0% 0%
14 0% 0% 0% 0% 0%
15 0% 0% 0% 0% 0%
16 2% -3% 5% -55% 4%
17 3% -3% 304% -51% -7%
18 0% 0% 0% 0% 0%
19 15% -31% -3% -26% -6%
20 44% -39% -13% -44% -19%
21 0% 0% 0% 0% 0%
22 0% 0% 0% 0% 0%
23 5% -23% -25% -63% -10%
24 -36% -28% -21% -58% 3%
25 0% 0% 0% 0% 0%
26 -6% 25% -45% -58% 29%
27 -13% 8% 12% -65% 0%
28 43% 10% 24% -37% -5%
29 13% -22% -22% -24% -25%
30 0% 0% 0% 0% 0%
31 0% 0% 0% 0% 0%
32 -28% -19% 31% -23% 12%
33 0% 0% 0% 0% 0%
34 -41% -28% 44% 19% 23%
35 0% 0% 0% 0% 0%
36 -24% -16% 10% 7% 16%
37 -19% 69% -51% -63% 9%
38 -41% 20% -59% -59% -4%
39 -38% -15% 4% -33% 23%
40 0% 0% 0% 0% 0%
41 -29% -25% -5% -9% 10%
42 -19% 65% -38% -50% 2%
43 -10% -18% -32% -42% -10%
44 -4% -36% -47% -56% -15%
45 -10% -22% -32% -55% 1%
46 28% -21% -36% -53% 12%
MEAN -3% -4% 1% -26% 1%
38 Table 14: Variation in actual to optimal output
Variation from actual to optimal Outputs
Hospital InpD ClS EA ER DH
1 0% 0% 0% 0% -85%
2 0% 0% 0% 0% -83%
3 0% 0% 0% 0% -83%
4 0% 0% 0% 0% -72%
5 0% 0% 0% 0% -84%
6 0% 0% 0% 0% -84%
7 0% 0% 0% 0% -85%
8 0% 0% 0% 0% -83%
9 0% 0% 0% 0% 0%
10 0% 0% 0% 0% -87%
11 0% 0% 0% 0% -84%
12 0% 0% 0% 0% -80%
13 0% 0% 0% 0% -85%
14 0% 0% 0% 0% -75%
15 0% 0% 0% 0% 0%
16 0% 0% 0% 0% -84%
17 0% 0% 0% 0% -53%
18 0% 0% 0% 0% -84%
19 0% 0% 0% 0% 100%
-20 0% 0% 0% 0% -83%
21 0% 0% 0% 0% -83%
22 0% 0% 0% 0% 0%
23 0% 304% 0% 51% -85%
24 0% 28% 1% 11% -82%
25 0% 0% 0% 0% -88%
26 0% 0% 0% 0% -88%
27 0% 0% 0% 0% -84%
28 0% 0% 0% 0% -85%
29 0% 202% 34% 24% -83%
30 0% 0% 0% 0% -85%
31 0% 0% 0% 0% -85%
32 0% 0% 0% 0% -85%
33 0% 0% 0% 0% -85%
34 0% 0% 0% 0% -68%
35 0% 0% 0% 0% -79%
36 0% 0% 0% 0% -76%
37 0% 0% 0% 0% -88%
38 0% 0% 0% 0% -77%
39 0% 0% 0% 0% -72%
40 0% 0% 0% 0% -81%
41 0% 62% 0% 246% -36%
42 0% 0% 0% 0% -81%
43 0% 388% 0% 58% -83%
44 3% 0% 0% 20% -76%
45 0% 64% 2% 26% -86%
46 0% 0% 0% 0% -84%
MEAN 0% 23% 1% 9% -76%
39 Table 15: Comparing results with Market Knowledge
Estimated Results vs Market Knowledge
Hospitals SFA
Rank DEA Rank
Enquiry Rank
CH de Setúbal, EPE 3 7 7
CH do Barlavento Algarvio,EPE 8 6 9
H Curry Cabral, EPE 6 8 3
H de Faro, EPE 7 4 6
H de S. João 2 1 1
H Infante D. Pedro - Aveiro 4 5 4
H Santo André - Leiria 1 2 2
IPO Francisco Gentil (Lisboa), EPE 5 9 5
ULS do Baixo Alentejo, EPE 8 3 7
Correlation to Expected Results 72% 38% -
Table 16: Efficiency Inefficiency Reasons
Enquiry
Efficiency Drivers Inefficiency Causes
- Cost control in human resources and drug use - Unadjusted supply to the diversity of medical needs
- Focus on financial results and cost control - Unskilled decision makers and clinical leaders with weak management capacity
- Specialization in certain service areas may contribute to efficiency seeking
- Disconnected goals between administration and clinical decision makers
- Potential for service differentiation - Policy followed at a national level may cause a comfortable stagnation in the services provided
- Cases of high case mix index, benefits Hospital funding
- Unadjusted number of medical staff (more than needed)
- Power of Negotiation - Lack of Physical Resources
Source: Own Source