THIS REPORT WAS PREPARED BY BJOERN SCHULMEISTER, A MASTERS IN FINANCE STUDENT OF THE NOVA SCHOOL OF BUSINESS
AND ECONOMICS, EXCLUSIVELY FOR ACADEMIC PURPOSES.THIS REPORT WAS SUPERVISED BY ROSÁRIO ANDRÉ WHO REVIEWED THE
M
ASTERS IN
F
INANCE
E
QUITY
R
ESEARCH
§ We initiate our coverage of SAP SE with a BUY rating
and a EUR 67.55 price target. We believe the market might underestimate the value of SAP HANA, in particular in connection with accelerated cloud sales.
§ Recent developments: SAP announced the acquisition of
Concur, a cloud software vendor, in mid-September 2014. One month later, the company announced a hiring freeze for 2014 to cut costs. Both weight negatively on the stock price.
§ Valuation: Our valuation is based on a discounted cash
flow analysis, forecasting revenue and profitability on the group’s reported segments and geographies. Total shareholder return is expected to be 21.9% based on a share price of EUR 56.25.
§ Limited downside: Using historical EV/Recurring sales
multiple of 6.9x, seems to provide a floor to the stock price at EUR 49.40. This suggests a downside of 12% from today’s share price.
§ Key risks: 1) Weak macroeconomic data hits IT spend, 2)
slower than expected cloud or SAP HANA related growth drags on top-line growth, 3) higher cannibalization rates distort profitability metrics
Company description
SAP is a leading enterprise software vendor, delivering products and services to organizations of all sizes. Although traditionally deployed on-premise, the company increasingly focuses to deliver cloud and mobile solutions to the customer. The company was founded in 1972and is headquartered in Walldorf, Germany.
SAP
SE
C
OMPANY
R
EPORT
T
ECHNOLOGY
-
S
OFTWARE
07
J
ANUARY2015
S
TUDENT
:
B
JOERN
S
CHULMEISTER
[email protected]
Managing a transition
SAP on its path towards cloud growth
Recommendation: BUY
Price Target FY15: 67.55 €
Price (as of 5-Jan-15) 56.25 €
Reuters: SAPG.DE, Bloomberg: SAP:GR
52-week range (EUR) 50.08-63.01
30-day average volume (m) 3,34
Market Capitalization (EUR m) 69,103.36
Outstanding shares (m) 1,228.5
Expected share price return (%) 20.1
Expected dividend yield (%) 1.8
Expe ted total shareholder return (%) 21.9
Source: Bloomberg, Analyst’s estimates
Source: Capital IQ
(Values in EUR millions) 2013A 2014E 2015E
Revenues 16,815 17,354 18,662
EBITDA 5,500 5,362 5,959
Net Profit 3,325 3,568 3,974
EPS (EUR) 2.79 2.90 3.23
P/E (x) 22.3 20.1 18.1
DPS (EUR) 1.00 1.00 1.04
Dividend yiel (%) 1.60 1.58 1.54
EV/EBITDA (x) 12.4 13.6 12.2
EBIT margin (%) 27.1 25.2 26.3
ROIC (%) 20.0 17.4 18.3
Source: Bloomberg, Company data, Analyst’s estimates
80 85 90 95 100 105 110
6. Jan. 2014 6. Apr. 2014 6. Jul. 2014 6. Okt. 2014
SAPSE COMPANY REPORT
Table of Contents
EXECUTIVE SUMMARY ... 3
COMPANY OVERVIEW ... 4
SHAREHOLDER STRUCTURE ... 4
BUSINESS EVOLUTION ... 4
OPERATIONS ... 5
KEY REVENUE AND COST DRIVERS ... 7
INDUSTRY SECTOR ... 8
DEMAND ... 8
MARKETS ... 10
INNOVATION ... 11
GROWTH OPPORTUNITIES ... 12
COMPETITIVE POSITIONING ... 14
STRATEGIC OUTLOOK FOR SAP ... 17
KEY VALUE DRIVERS ... 18
THE CLOUD(Y) TRANSITION ... 18
SAPHANA–ENABLER OR DRIVER? ... 19
FORECASTS ... 20
RECENT RESULTS AND CURRENT OUTLOOK ... 20
OVERHEAD COSTS ... 21
ON-PREMISE SOFTWARE AND SUPPORT ... 21
CLOUD SUBSCRIPTIONS AND SUPPORT ... 23
SERVICES (PSOS) ... 24
VALUATION ... 25
WEIGHTED AVERAGE COST OF CAPITAL (WACC) ... 25
TERMINAL VALUE ... 25
MULTIPLES ... 26
SENSITIVITY ANALYSIS ... 27
APPENDIX ... 29
APPENDIX 1:SAP TRANSACTION HISTORY ... 29
APPENDIX 2:GARTNER’S MAGIC QUADRANT ... 29
APPENDIX 3:CLOUD CANNIBALIZATION AND SCENARIO ANALYSIS ... 30
APPENDIX 4:WEIGHTED GDP GROWTH BY GEOGRAPHICAL SEGMENT ... 32
APPENDIX 5:WACC COMPUTATION ... 33
APPENDIX 6:ENTERPRISE SOFTWARE UNIVERSE ... 34
APPENDIX 7:CASH FLOW BASED VALUATION MODELS ... 35
FINANCIAL STATEMENTS ... 36
SAPSE COMPANY REPORT
Executive summary
SAP SE is a leading enterprise software vendor, headquartered in Walldorf, Germany. Its main product line with ~36% of total revenue is ‘SAP ERP’ - an integrated application package to support critical business processes like HR or Finance. Like in the past, EMEA (47%) and Americas (38%) generated the lion’s share of the company’s total revenue in 2013.
SAP increasingly focuses to enrich its product portfolio in the cloud as opposed to traditionally on-premise solutions. In the past, significant acquisitions have contributed to the share of SAP’s cloud related revenue (2013: 5% of total revenue, thereof >50% through M&A). With the development of the in-memory database ‘SAP HANA’, the company takes a step into an upstream market segment that is currently dominated by its competitors.
Going forward, we expect three factors to determine the fundamental value of SAP: (i) macroeconomic sentiment and its influence on IT spend (ii) organic cloud related growth and its influence on the group’s profitability metrics and (iii) the evolution of the software platform SAP HANA.
We forecast total revenue to grow annually by 6.7% (non-IFRS) until 2017. By then, the revenue stream of SAP is expected to include ~13% cloud business and ~16% from SAP HANA. Non-IFRS operating margin is expected to reach 32.5% after experiencing downward pressure in 2015.
Determining the impact of cloud related growth (ii) we find that, depending on the rate of cannibalization of on-premise license revenue, operating margin and subsequently EPS growth differ considerably (maximum range: +/- 150bps) under the assumptions of our scenario analysis.
We initiate coverage on SAP with a Buy recommendation and a price target of EUR 67.55. This represents an upside potential of 20.1% on the current share price of EUR 56.25.
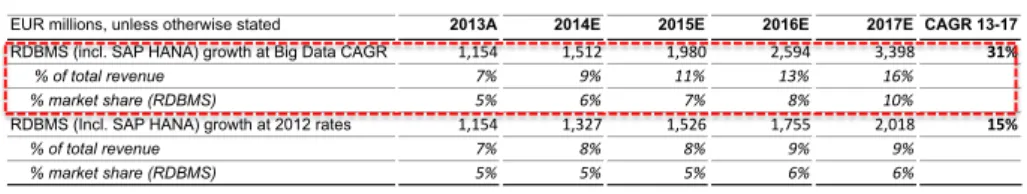
In our view, the market has not fully digested the value potential of SAP HANA. We expect a 31% CAGR 13-17 and justify it as follows. First, we expect easing concerns for migration as the number of use cases increases. Second, we expect that increasing sales for cloud applications (which are built on SAP HANA) to facilitate the growth of the platform further.
SAP is a leading enterprise software vendor with strong footprint in EMEA.
The strategy of SAP is orientated towards growth opportunities in Cloud computing and Big Data.
Macroeconomic sentiment, cloud solutions and SAP HANA are key value drivers.
We forecast a 7.3%
CAGR 13-17 for total revenue.
SAP’s valuation .
We initiate coverage of SAP with a price target
of EUR 67.55.
SAPSE COMPANY REPORT
Company o
verview
SAP SE is publicly listed entity since 1988. Currently the company’ s stock are trading at Frankfurt Stock Exchange (XETRA) and also represented on the New York Stock Exchange through American depository receipts (ADRs). SAP is a member of the German stock index (DAX) and the Dow Jones EURO STOXX 50 Index, constituting 6.7% and 2.7% of market capitalization1, respectively.
Shareholder structure
The shareholder structure of SAP captivates a balanced group of institutional (56%) and individual investors (44%). The largest shareholders are the three founders total 21.6% through their holdings and personal ownership2. The free float stands at 75.7%, increasing slightly over the past years. Except for the co-founder and chairman of the Supervisory Board, Hasso Plattner, neither a member of the executive board nor the supervisory board holds more than 1% of SAP’s share capital. Other than the right of the executive board to issue or repurchase a limited value of shares, mechanisms against hostile takeovers are neither public nor known. Further, there is no notice of a shareholder, directly or indirectly controlling more than 10% of voting rights.
Business evolution
Five former IBM employees, having the desire to establish standardized software that allows real-time data processing for business operations, founded the company of SAP in 1972. Three years after the foundation, the company had established an integrated application landscape.Funding from the initial public offering (1988) and technological evolutions in hard- and software eventually brought SAP to develop its flagship software: R/3 – also known as SAP Enterprise Resource Planning (ERP). It was first launched in 1992, and offered applications for Lines of Businesses (LoB) like human resources, material management or accounting. Through the compatibility with multiple operating systems (e.g. Windows NT) and hardware (e.g. IBM servers), the software became available to midsized as well as global players. While in-house developed innovations fuelled the growth of SAP’s in the early 2000’s (e.g. SAP NetWeaver), M&A activity in form of tuck-in acquisitions became part of the strategy in the second half of the century and continues to be until today. Facilitated through debt financing, SAP enriched its product portfolio with acquisitions within areas of promising growth such as Business Intelligence (BI),
1
Source: Interim report Q314, SAP, 20.10.2014
2 Dietmar Hopp: 5.31%, Hasso Plattner: 8.82%, Klaus Tschria: 7.50% (Source: NASDAQ OMX, September 2014)
“When people ask how we planned all this, we answer: We didn’t. It just happened.” – Co-founder Hasso Plattner
Figure 1: Shareholder structure
Source: Nasdaq OMX (September 2014)
Britain/ Ireland 15.7% Rest of Europe 14.1% Rest of
World 2.2% Retail 19.3% Founders 21.6% Treasury 2.7%
North America 16.7%
Germany 7.7% 1.229mn
SAPSE COMPANY REPORT
mobile and cloud (see Appendix 1). We believe that, in the past, (a) favourable macroeconomic developments, (b) innovative power to execute on technological changes and (c) partnerships within the sector but also with its clients facilitated the growth of SAP.
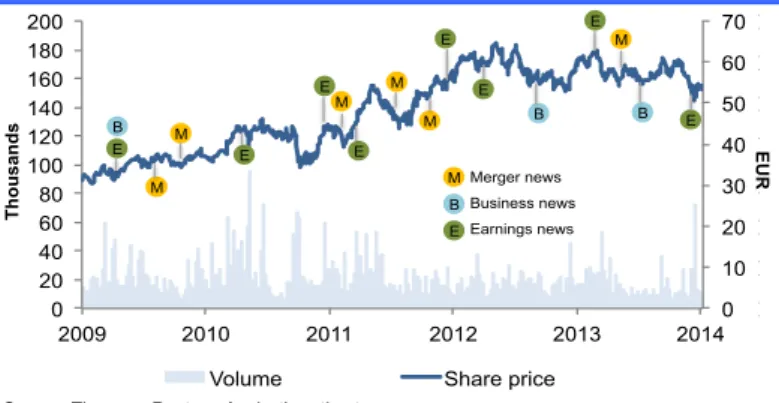
Looking at historical 5-year share price performance we find support for (a) in late 2014 and mid-2011 where economic sentiment worsened and SAP’s stock price fell. For evidence on (b), we like to stress the positive share performance when positive earnings announcement followed an acquisition (early 2011 and early 2012). Overall, SAP experienced a positive stock performance within the past 5 years: 2% return premium over the DAX with 12.1% average annual return.
Operations
SAP’s software products can be divided into applications and analytics.
Applications refer to software that is dedicated to support operating activities along the value chain of a business client. The ERP application, which supports several critical business processes like finance or human resources, is at the heart of this segment (see ‘Key revenue and cost drivers’). Among others, SAP also offers software for Supply Chain Management (SCM) or Customer Relationship Management (CRM). A comprehensive portfolio of applications is also sold as a package, which is then called ‘SAP Business Suite’. Analytics
software comprises rather strategic tools. Generally, these tools consolidate and process data generated by various applications, in order to facilitate reporting, decision-making (Business Intelligence, short: BI) among other similar purposes (see Figure 4). With the acquisition of the French company Business Objects S.A. in 2008, SAP enhanced its portfolio within this category (see Appendix 1). Applications and Analytics are SAP’s traditional market segments. As technology advanced, the delivery of these products moved away from on-premise deployment, where software is installed on the client’s hardware (servers), towards cloud based models. The cloud delivery allows clients to access applications through an Internet connection. Therefore the application is installed Macroeconomic conditions,
favorable technological changes as well as partnerships supported growth in the past.
Figure 2: Stock price evolution (2009-2014)
Source: Thomson Reuters, Analyst's estimates
0.00 10.00 20.00 30.00 40.00 50.00 60.00 70.00 0 20 40 60 80 100 120 140 160 180 200
2009 2010 2011 2012 2013 2014
Volume (in '000) Share price (in EUR) E
M B M
E E M E M M E E E E B M B E M B Merger news Business news Earnings news EU R Thousands
Figure 3: Adressable market
Source: Company data (2010) Mobile Core ERP + Suite Middleware BI/Analytics Applications Analytics Database & Technology Cloud
2010 2020
USD 110bn
USD 350bn
Figure 4: Scope of analytics
Source: TDWI Business Value C o m p le x ity HIGH
LOW HIGH
SAPSE COMPANY REPORT
on external servers that run the software and save the data. By now, SAP offers a comprehensive portfolio of applications in the cloud, also referred to as ‘Software-as-a-Service’ (SaaS). It also executes this form of delivery in relation to its database software ‘SAP HANA’, in this context referred to as ‘Platform-as-a-Service’ (PaaS). Like with cloud, core functionalities of analytics and applications can also be accessed through a mobile application. Alongside with mobility management software (e.g. to manage the data access from employees’ mobile devices) and mobile platforms (e.g. to develop software for mobile devices) the latter three categories serve the mobile market segment of SAP. The database &
technology segment (formerly Middleware) has most recently been enriched by
the launch of in-memory database technology called ‘SAP HANA’ in 2010. While it serves as a development platform for all of the aforementioned market categories and third-party applications (see Figure 6), it is also offered as a stand-alone appliance3.
In 2013 revenues, the biggest single geographicalmarket for SAP was the U.S. (~28%), followed by the home market Germany (~15%). On aggregate, Europe, Middle East and Africa (EMEA) are the biggest contributor with ~47%. SAPs Americas region is the fastest growing region for SAP with strong growth potential in Latin America.4 The growth potential of the Asia/Pacific (APJ) region (CAGR 09-13: 16.1% for APJ vs. 15.2% for Americas) is at least as interesting. However, 2013 has shown that currency effects, especially in APJ5, are of concern for euro-nominated growth. Generally, Euro depreciation relative to another currency is viewed positively by SAP, while euro appreciation is seen as having adverse effects.6
Overall, SAP serves more than 250 thousand customers worldwide. Within the customer’s industry sectors, we find a balanced contribution across all four segments. Besides a strong position in ‘Energy and Natural Resources’ and ‘Consumer’7, the company also has significant operations in the sectors of ‘Discrete Manufacturing’8 and ‘Services’9. SAP’s fastest growing industry segments are ‘Financial Services’ for the second year in a row (2013: +13%). The company differentiates itself by offering customized software solutions that serve particular industry needs. Across industries the company’s client base
3
Appliance stands for preconfigured hardware, through software, in order to efficiently and effectively utilizes the interaction between applications and underlying hardware.
4
For instance, Venezuela and Columbia showing triple-digit growth and Argentina with high double-digit growth in non-IFRS software revenue at constant currencies in Q1 2014 (Source: SAP Q1 2014 earnings announcement, April 2014)
5 In 2013, Japanese revenue growth dropped 21% due to currency effects. In 2012, revenue from Japanese customers increased 8% solely due to currency effects. The Americas region’s revenue is also influenced, however, on much more stable percentages. 6
Source: Annual report 2013, SAP 7
The Consumer customer segment includes industries like Retail, Wholesale and Life Sciences. 8
The Discrete manufacturing customer segment includes industries like Automotive, High-Tech and Industrial Machinery & Equipment. 9 The Services customer segment includes industries like Media, Telecommunication, Transport & Logistics and Sports & Entertainment.
Figure 5: Cloud market segments
Source: Company data (2010)
Software-as-a-Service (SaaS)
Focus Cloud
Areas Platform-as-a-Service (PaaS)
Infrastructure-as-a-Service (IaaS)
Virtualization
Hosted on-premise Enabling
on-premise for the cloud
Active Participation Partner
Figure 6: SAP HANA product portfolio
Source: Company data (2014) Applications
SAP HANA platform Analytics Mobile first - UX
Pa
rt
n
e
r
Figure 7: Revenue by region (2013A) in EUR bn, based on customer location
Source: Company data
USA 4.7
Rest of Americas 1.7 Germany
2.5 Rest of
EMEA 5.4 Japan
0.6 Rest of
APJ 1.9
TOTAL REVENUE
16.8
Figure 8: Revenue growth by region non-IFRS, in constant currencies
Source: Company data
0% 5% 10% 15% 20%
2010A 2011A 2012A 2013A
All EMEA
SAPSE COMPANY REPORT
consist to ~80% of so called SMEs.10 For this particular client group, SAP offers specific software packages that are limited to the core functionalities of a product, making them more affordable and easier to deploy and use. Nevertheless, also 86% of Global Fortune 500 companies belong to the customer base of SAP.11 The distribution is either executed directly through national subsidiaries and the SAP online store or indirectly through partners. In 2011, major initiatives were started to improve the partner network, which resulted in more than 1.200 partners contributing 33% to the revenue of SAP in 2012.12 In 2015, management expects the revenue contribution to reach 40%.13 In order to leverage future growth opportunities, especially in emerging markets and within the SME segment we believe the partner network is an essential tool.14
Key revenue and cost drivers
Total revenue can be split into two segments: Software and software-related services (SSRS) and professional services (PSOS) such as consulting. Within SSRS, on-premise software products generate 27% of total revenue in form of perpetual licenses (software) while follow-up maintenance contracts (support) account for 52%. Significantly less revenue is generated through the sale of cloud-based products via subscription-based payments on a monthly or yearly basis.
The product mix of SAP is dominated by ERP (2013A: ~44% of SSRS revenue).
Together with CRM and Analytics (BI, hereafter used synonymously), these products make the lion’s share of SSRS revenue. Service revenue (PSOS) gradually decreased over time from 30% in 2006 to 17% of total revenue by 2013. SAP has four main cost drivers (see Figure 11), out of which Sales & Marketing (S&M) contribute most to total operating expenses. Note that, despite the small revenue contribution, cost of service revenue contributes 20% to the cost side. In a ranking of gross margin profitability, support revenue is estimated to be most profitable for SAP. While the company itself does not disclose gross margin on this level, Oracle’s figures are regarded as comparable with ~92%.15 If the latter holds true, software revenue (2013A: 70.1%) comes next, followed by cloud subscriptions and support. As of today, SAP’s cloud gross margin is distorted. Our industry analysis16 indicates an average gross margin of ~77%. Going forward, we
10
Source: SAP company website, last accessed: 01.01.2015 (Link: http://www.sap.com/solution/sme/strategy.html) 11 Source: Press release, SAP, April 2014
12 Source: “Driving Channel Partner Loyalty – and Performance”, Bloomberg Businessweek, February 2013 13
Source: Press release, SAP, June 2012 14
Over half of surveyed SMEs purchase software through indirect channels. (Source: „SMB routes to market study“, SMB Group, 2012) 15
Source: Annual report 2013, Oracle
16 Includes reported gross margins from the following companies: Salesforce, Workday, NetSuite, ServiceNow, Concur (pre-acquisition).
By 2015, SAP expects to increase the percentage of sales through its partner network to 40%.
Figure 11: Cost structure (2013A) non-IFRS, as % of total operating expenses
Source: Company data, Analyst's estimates Costs of
SSRS 20%
Costs of PSOS 20%
R&D 19% S&M
34% Other
7%
Figure 10: Product mix (2013A) non-IFRS, as % of SSRS revenue
Source: Gartner, Company data, Analyst's estimates ERP 44%
BI 22% CRM
19% SCM
15%
Figure 9: Revenue categories (2013A)
Source: Company data %
4Cloud subscriptions and support
27Software
52Support
79Software & support
83SSRS revenue 13Consulting
4Other services
17Professional serv. and other serv. rev.
100 Total Revenue
one-time revenue recurring revenue
%
4Cloud subscriptions and support
27Software
52Support
79Software & support
83SSRS revenue
13Consulting
4Other services
17PSOS
SAPSE COMPANY REPORT
expect SAP to go beyond industry levels, towards that of best-practice players like NetSuite or Salesforce (>80%).17
I
ndustry
s
ector
The enterprise software industry operates at Ø22.3% EBITDA margin (see Appendix 7) and is growing at high single-digit rates (Ø7.8% past 3yr revenue CAGR).18 It is an industry in which corporations determine the demand (B2B), incumbents face strong competition and innovation is crucial for success because technological developments provide both, opportunities to grow for incumbents and lowers entry barriers for new entrants. The following sub-sections will highlight each of these characteristics in detail before concluding the findings in a strategic outlook for SAP.
Demand
Corporation’s need for investments in information technology (IT) is the main driver for the sector. We find that global IT spend is at least partially dependent on the state of the economy. Hence, we assume that global IT spend is to some extend dependent on GDP development. We like to think this relation is at least partially explained by the fact that corporations tend to cut IT budgets, therefore postponing major IT investments and focusing on maintaining the existing infrastructure in times of a bearish market outlook and vice versa. Thus, to determine the demand for SAP and its peers we need to look at macroeconomic factors first. The highest growth rates in gross domestic product (GDP) are expected for emerging markets19. While U.S. also shows a significant growth profile, European markets seem to recover comparatively slowly.Among the Top 10 ICT countries20, on average 2.5% of GDP is spent on information technology in 2013. Emerging markets like China and India have a relatively small percentage devoted to IT spend, resulting in strong growth rates of the latter: China grew its IT spend in 2013 by 7% while the Indian IT market grew 10%.21 According to research firm Gartner, global IT spend is estimated to amount up to USD 3.7 trillion in 2014, up 2.1% Year over year (y/y). Although the share of enterprise software in companies IT budget is rather small (8.56%) it is also the
17
For a detailed discussion on the development of gross margins please refer to the section ‚Forecasts’ and especially the sub-section on ‚Cloud subscriptions and support’.
18
Source: Capital IQ, last accessed: 21.12.2014
19 For a detailed list of the group ‘emerging and developing markets’ please see:
http://www.imf.org/external/pubs/ft/weo/2014/02/weodata/groups.htm#cee (last accessed 29.12.14) 20
Information and communication technology countries are defined through the ICT Development Index (IDI), published by the United Nations International Telecommunication Union (ITU). Its purpose is to rank countries by their respective ICT infrastructure and uptake. (Source: ITU company website, last accessed: 12.08.2014)
21 Source: “Gartner Says India Software Market Grew 10 Percent in 2013“, Gartner, April 2014
IT spend is a key value driver for the enterprise software industry.
Figure 13: Annual GDP growth
Source: IMF (October 2014) 0.2%
1.4%
6.5%
1.6% 2.2%
6.7%
1.8% 2.3%
6.8%
EU Major advanced economies (G7) Emerging and developing Asia
2015E 2014F 2013A
Figure 14: IT spending as % of GDP selected ICT countries
Source: Statista (2010), Analyst's estimates 1.10%
1.21% 1.96%
2.39% 2.49% 2.50%
4%
China India Japan Germany USA Top 10 Average UK
Figure 12: GDP and IT spend annual growth rates
Source: IMF, Gartner -5%
0% 5% 10% 15%
2007A2008A2009A2010A201 1A
2012A2013A2014F
SAPSE COMPANY REPORT
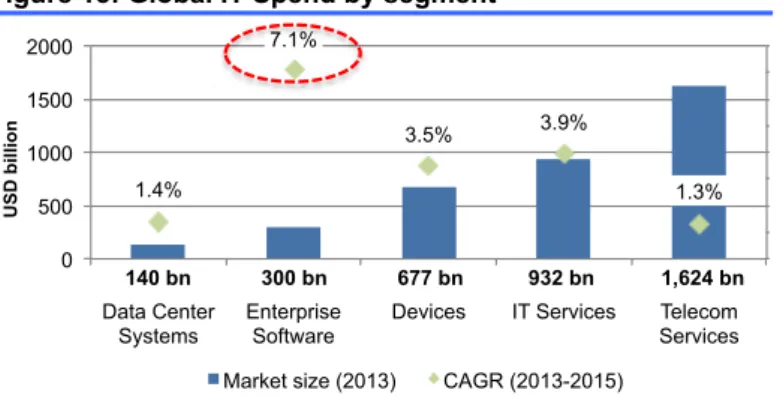
fastest growing segment. Going forward, the enterprise software market is estimated a 7.1% CAGR 13-15.22
Research analysts at the International Data Corporation (IDC) estimate that, based on their market definitions, 89% of the growth in 2014 comes from: mobile, cloud, big data, social solutions as well as emerging markets. They expected these categories to represent 29% of total IT spend in 2014 (~50% by 2020).23 Generally, the key contact persons for enterprise software vendors are top-level executives and in particular Chief Information Officers (CIO). The latter typically play an important role in the sizing and allocation of a company’s IT budget.24 Thus, a reasonable outlook for IT spend can also be derived from CIO polls like the one conducted by the CIO magazine in May 2014. It indicates that overall IT spending is expected to grow by an average of 4.9% with almost half of the surveyed executives to plan an IT budget increase within the next year. Further, they find that budget increases are most likely in the area of applications (54%).25 Besides the change in market size there are also deviations in growth among
industries. Gartner estimates that Transportation, Insurance and Banking & Securities as well as Communications, Media & Services (CMS) offer the highest CAGR through 2016.26 With the increasing bargaining power of buyers
through lower switching costs and more frequent buying decisions associated with cloud offerings.27
22
Source: „Gartner Says Worldwide IT Spending on Pace to Grow 2.1 Percent in 2014“, press release, Gartner, June 2014 23
Source: IDC Predictions 2014: CIO Agenda, IDC, 04.12.13 24
CIO magazine surveyed that 65% of the dollars invested in technology is directly controlled by IT (now and in the next 3 years). (Source: „State of the CIO Survey“, CIO magazine, January 2014)
25 Source: „Tech Poll/IT Economic Outlook Survey“, CIO magazine, May 2014 26
Source: „Forecast: Enterprise IT Spending by Vertical Industry Market, Worldwide, 2010-2016, 3Q12 Update“, Gartner, October 2012 27
On-premise software has high up-front costs (purchase of perpetual license and deployment services), which leads to high switching costs. Cloud offers are purchased on yearly or monthly on a subscription basis and thus interaction between buyer und seller happen more often. For detailed information please refer to the sub-section ‘Growth opportunities’.
Enterprise Software offers the highest growth among all IT segments: 7.1% CAGR 13-15.
Figure 16: Areas for budget increase % of respondents
Source: IDC (May 2014)
39% 37%
44% 56% 48%
36% 37% 40%
47% 54%
Network Infrastructure Hardware Outsourcing (including Cloud) Mobile/Wireless Applications
2014 2013
Figure 15: Global IT Spend by segment
Source: Gartner (June 2014)
1.4%
7.1%
3.5% 3.9%
1.3%
0 500 1000 1500 2000
Data Center Enterprise Devices IT Services Telecom 0
Data Center Systems
Enterprise Software
Devices IT Services Telecom Services
Market size (2013) CAGR (2013-2015)
140 bn 300 bn 677 bn 932 bn 1,624 bn
U
SD
b
il
li
o
SAPSE COMPANY REPORT
Markets
The application software landscape can be divided into four core segments: ERP, CRM, SCM and Analytics.28 Gartner expects all of the abovementioned segments to grow in future. Though - as we will outline below - growth rates, market sizes, clients and the degree of adopting emerging technologies (e.g. cloud computing) differ considerably among the four segments.
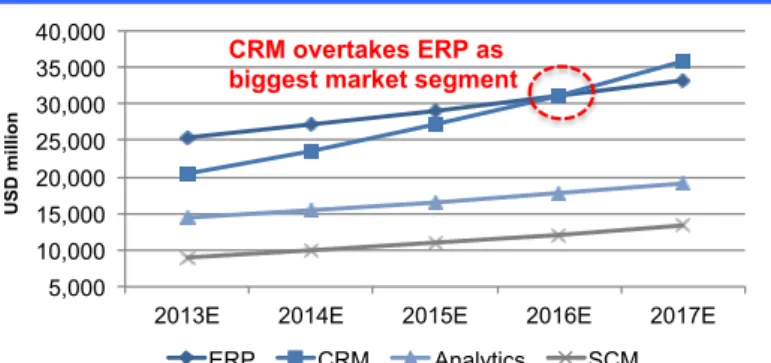
The ERP market grew 3.8% to USD 25.4 bn in 201329 and is expected to grow at 6.6% CAGR 13-17.30 One particularly interesting client base in an otherwise mature ERP market are small- and medium size enterprises31 (SMEs) as they see the need for IT investments32 and benefit from cloud deployment options (see ’Growth opportunities’). The CRM market offers superlatives in multiple ways. It has the strongest year-over-year (y/y) growth with 13.7% from 2012 to 2013 and also the highest penetration of cloud-based systems (41%).33 The market is expected to grow at 15.1% CAGR 12-17, thereby overtaking ERP as the biggest single enterprise software market in 2016.34 Analysts at Forrester, attribute this potential to the relatively weak coverage of CRM systems even within large enterprises: among the surveyed 455 large enterprises in North America and Western Europe, only 55% have implemented a CRM solution in 2012. We believe that high failure rates contributed to this relatively low percentage.35 As of 2013, North America and Western Europe account for 80% of worldwide revenue in this segment. However, markets like China and Latin
28
We took a simplifying step here and excluded the 5th pile of Gartner’s market definition: web conferencing, collaboration and social software suites as is the smallest segment (approx.5% of total market size) and has little value for SAP (0.1% of SSRS).
29 Source: “Market Share Analysis: ERP Software, Worldwide,2013”, press release, Gartner, June 2014 30 Source: “Forecast Analysis: ERP Software Worldwide 3Q13 Update“, Gartner, October 2013 31
Although we found various definitions for a SME, we outline the threshold criteria of the European Commission (published in 2003) below to serve as guidance. However, we are aware of the fact that market estimations for this segment might vary among sources used in this report. (Headcount: <250 and annual turnover ≤ EUR 50 million or annual balance sheet value ≤ EUR 43 million).
32
Oxford Economics found that 50% see business management software (ERP) as their top investment priority (Source: “SMEs: Equipped to Compete”, April 2013).
33 Source: „Gartner Says Customer Relationship Management Software Market Grew 13.7 Percent in 2013“, press release, Gartner, May 2014
34
Source: „Forecast: Enterprise Software Markets, Worldwide, 2012-2017, 2Q13 Update“, Gartner, June 2013 35
ZDnet, a renowned business technology news website, cites high failure rates (around 50%) for CRM implementation projects in the last decade (Source: “CRM failure rates: 2001-2009“, ZDnet, August 2009)
SMEs are important clients in a mature ERP software market.
CRM is the fastest growing product segment with 15.1% CAGR 12-17.
Figure 17: Global revenue by subsegement (2013 - 2017)
Source: Gartner (June 2012), Analyst's estimates 5,000
10,000 15,000 20,000 25,000 30,000 35,000 40,000
2013E 2014E 2015E 2016E 2017E
ERP CRM Analytics SCM
U
SD
m
il
li
o
n
SAPSE COMPANY REPORT
America experienced double-digit growth rates in the last two years and thus provide promising market opportunities within this market segment. Communication, media & IT services, manufacturers and financial services are mentioned as the biggest spenders, according to Gartner.36 In the Analytics
market, Big Data drives sub-segments’ growth in products like Predictive Analysis to 7.9% in 201337 and 7.3% CAGR 12-1738. As of today, North America is the dominant market capturing almost half the Analytics market.39 While interest in Analytics can be found across all industries, it is particularly interesting for companies that produce and use large amounts of data like Financial Services or Healthcare (see ‘Growth opportunities’). Last, the SCM market is characterized by 10.4% CAGR 12-17.40 In 2013, the market grew by 7.3% to USD 8.9 bn.41 Buyers of SCM software most likely have high time-to-market pressure (e.g. high-tech companies), strong cost competition through standardized processes (e.g. manufacturers) or complex processes to handle (e.g. process industries).
Innovation
Innovation can be defined as the ability to develop valuable products for which customers are willing to pay. Hence, it is not necessarily about a great product or service itself; it’s also about the ability to deliver the value to the customer. Regardless of the source, innovation is said to drive value. BCG for instance, found that stock performance of innovative companies exhibit a three-year total shareholder return (TSR) premium of 7.6% and a five-year premium of 4% across industries and geographies.42 When comparing R&D expenses of major industry players, we find that IBM has the smallest percentage of sales dedicated to R&D while SAP leads the field with 14%. Although the comparison of percentage figures, absolute numbers or even patents has limited explanatory power with regard to innovation43, we believe investors value internal innovative power. For instance, SAP’s share price dropped 4% when SAP HANA lead developer and CTO Visal Shikka announced its leave.44 With regard to M&A activity, the Software Equity Group found that targets are likely to be in the field of mobile, big
36
Source: „Gartner Says Customer Relationship Management Software Market Grew 13.7 Percent in 2013“, press release, Gartner, May 2014
37 Source: „Gartner Says Worldwide Business Intelligence and Analytics Software Market Grew 8 Percent in 2013“, press release, Gartner, April 2014
38
Source: „Forecast: Enterprise Software Markets, Worldwide, 2012-2017, 2Q13 Update“, Gartner, June 2013 39
Source: „Sector Report: Business Intelligence“, Redwood Capital, April 2014 40
Source: „Forecast: Enterprise Software Markets, Worldwide, 2012-2017, 2Q13 Update“, Gartner, June 2013 41
Source: „Gartner Says Worldwide Supply Chain Management and Procurement Software Market Grew 7.3 Percent in 2013“, press release, Gartner, May 2014
42 Source: „Incubators, Accelerators, Venturing, and More“, BCG, June 2014 43
A study of Booz & Company proved for the ninth consecutive year that most innovative companies do not correlate with the biggest R&D spenders. (Source: “The 2013 Global Innovation 1000 Study”, June 2013).
44
As for all event-driven returns mentioned in this report, we compare the share price two trading days prior to the announcement date, with the 5-day average share price starting at the day of the announcement or the next trading day.
“Growth through innovation is the surest, straightest route to superior performance” – BCG
Figure 18: R&D expenses as % of sales (most recent FY)
Source: Company data, Analyst's estimates
6%
13% 13% 14%
SAPSE COMPANY REPORT
data and cloud.45 Survey results show a steep increase in number of SaaS acquisitions in the past (+25% from 2012). Recent acquisitions (Oracle bought Micros and Datalogix, SAP bought Concur) indicate that the past trend will continue in the future. In the past, SAP’s M&A deals within the last 5 years were largely cloud related (see Appendix 1) and, on average, slightly negative (-0.54%) by the markets.46 Thus we don’t expect acquisitions to create or destroy considerable value for SAP, at least in short-term. In order to gauge SAP’s innovative power relative to its peers, we may look at the magic quadrant of Gartner, which clusters industry players on the basis of incumbents’ completeness of vision and ability to execute into four categories. SAP is a ‘leader’ in many categories, though pure-play cloud vendors are beating SAP’s position in Analytics, CRM and PaaS (see Appendix 2).
Growth opportunities
The two emerging technologies Big Data and Cloud computing are estimated to provide growth rates that are well above the overall the enterprise software market (Cloud by ~3 times, Big Data by ~4 times) and are therefore evaluate on their growth opportunities.
Cloud computing, for example, is reaching the majority market according to both, Gartner47 and the IDC.48 Relating to Bohlen et. al (1981) and his theory on technology adoption lifecycle, this would translates into 84% of the market still being untapped and thus strong growth rates going forward. Going forward, the SaaS market is expected to grow at 19.5% CAGR 11-16.49 Among the driving forces for strong growth are SMEs.50 In our view, this has two reasons. First, cloud based solutions may replace the need for in-house IT departments51, thanks to an easier deployment52 and use. Secondly, the cost model becomes more attractive through lower up-front payments.53 For large enterprises, agility (e.g. infrastructure capacities is adjusted on demand), speed (e.g. deployments are faster through standardization) and improved access to new technology (e.g. because innovative solutions are built as cloud applications) are compelling
45
Source: „The Software Industry Financial Report“, Software Equity Group, January 2014 46
We analysed all deals that were announced during the past 5 years. This includes the following targets: Sybase, SuccessFactors, Ariba, Fieldglass, hybris and Concur.
47 Source: „Gartner's 2013 Hype Cycle for Emerging Technologies Maps
Out Evolving Relationship Between Humans and Machines“, press release, Gartner, August 2013 48
Source: “IDC 2014 Predictions”, IDC, October 2013 49
Source: „Forecast Overview: Public Cloud Services, Worldwide, 2011-2016, 4Q12 Update“, Gartner, February 2013 50
Analysys Mason estimates that just over 40% of SaaS revenue will come from SMEs.(Source: “Enterprise Cloud Services: Worldwide Forecast 2012 – 2017; Analysys Mason, February 2013)
51 According to Microsoft, 42% of US SME’s do not have an IT department. (Source: Microsoft Survey, 2014) 52
SAP, for instance, has launched a learning platform called ‚openSAP’ and increasingly focuses to deliver best-practises under the brand name ‚SAP Rapid Deployment’ to simplify deployments for new software products (Source: SAP press release, 02.12.14) 53
By charging regular subscriptions instead of expensive perpetual licenses, the costs declare as operating expenditures instead of capital expenditures.
SAPSE COMPANY REPORT
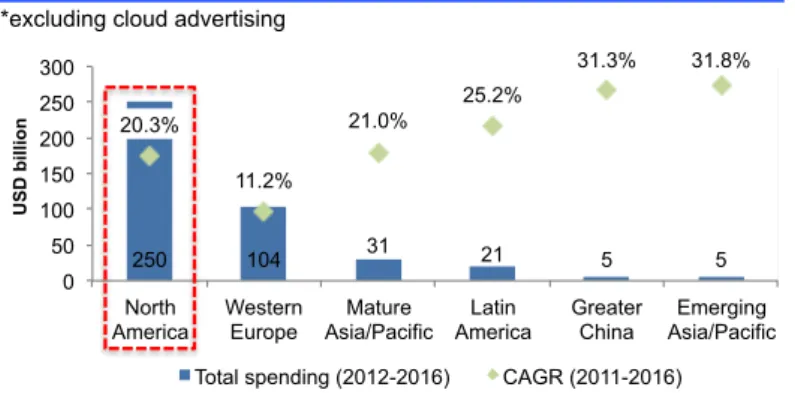
reasons.54 Vendors like SAP on the other side, see benefits in the increasing portion of recurring revenue (see ‘Forecasts’). Adoption rates across lines of business have and will evolve differently but particularly strong in CRM and SCM, according to Gartner.55 In the global environment, North America is by far the biggest and, considering its growth, also the most attractive cloud market as of today. However, emerging markets offer great growth opportunities. For instance in Latin Americas biggest economy – Brazil – 80% of respondents cited to increase their SaaS spending vs. 73% in the United States, according to Gartner.56
Emerging markets are of particular interest for incumbents as the rate of net new deployments outperform those of developed markets.57 Hence, when forecasting SAP’s cloud performance, we shall pay special attention to the company’s positioning in the SME market and within emerging markets in general (see ‘Competitive positioning’).
The Big Data hype is deriving from the trend of increasing production of data (Internet-of-Things, social media, etc.) and, in the context of enterprise software, can be viewed as the rising need to analyse high volumes of unstructured and structured data in real-time. In 2012 the IT market share of this trend was estimated to be worth USD 11.4 bn. More specifically, software and services-related share of that pie amounts to 53% or USD 6 bn (31% CAGR 12-17).58 The driving forces of this growth are not merely analytical applications but also appliances. Despite high growth expectations, we believe the state of maturity poses a threat to current market growth estimates. According to Gartner, Big Data is at the ‚peak of inflated expectations’, meaning that first successes are achieved however often followed by failures: „Some companies take action;
54
A study by HCL surveyed 100 large global enterprises on their reasons for migrating to the cloud. The two most cited answers were: 59% of the respondents cited speed and agility as a reason, 46% of respondents mentioned improved access to new technology. (Source: „The Future of the SAP Cloud“, June 2014)
55 Bain & Company confirms Gartner’s expectations. (Source: “Bain Brief - The cloud reshapes the business of software”, Bain & Company, 2013)
56
“Gartner: Brazil Leads SaaS Adoption“, news article, Cloud times, December 2012 57
Half of Asia/Pacific respondents, indicated SaaS as net new deployment. (Source: Press Release, Gartner, March 2012) 58 Source: “Big Data Vendor Revenue and Market Forecast 2012-2017”, Wikibon, February 2013
“The benefits of Big Data are not always clear today” – IDC
“Companies will want to see demonstrable value” – IIA
Figure 19: SaaS market share by 2016 in % of global market segment, respectively
Source: Gartner (2012)
11% 17%
28% 28%
48%
Analytics ERP Market average SCM CRM
Figure 20: Cloud spending* and CAGR by region *excluding cloud advertising
Source: Gartner (February 2013)
250 104 31 21 5 5
20.3%
11.2%
21.0%
25.2%
31.3% 31.8%
0 50 100 150 200 250 300
North America
Western Europe
Mature Asia/Pacific
Latin America
Greater China
Emerging Asia/Pacific
Total spending (2012-2016) CAGR (2011-2016)
U
SD
b
il
li
o
n
SAPSE COMPANY REPORT
many do not.“59 We believe this refers to an early stage in the technology adoption life cycle and thus products relating to this hype still need ‘proof of concept’, in order to convince majority buyers.
Competitive positioning
Within the software industry, SAP is the fourth largest player, behind Microsoft, Oracle and IBM. Among those, we regard Oracle as the most comparable competitor.60 This is especially true when narrowing the market definition down to the enterprise software market, where SAP is the dominant player in 3 out of the 4 biggest segments, competing with Oracle in all of them (see Table 1). We also see an increasingly possibility that fast growing cloud vendors like Salesforce (see ‘CRM’) and NetSuite (see ‘ERP’) take share from traditional vendors. 61 To support our reasoning we evaluate SAP’s standing in this market in detail after analysing the traditional market segments.
When comparing ERP solutions, SAP is the undisputed market leader with a relative market share62 of 2.0. Thus, we expect competitive pressure rather from smaller vendors, especially when operating in the SME market. Within this market segment, ERP vendor Totvs passed SAP in its Brazilian home market and climbed two places (now 6th) in Gartner’s global market share ranking over the last two years. US-based cloud vendor NetSuite grew at 11x the market rate in 2013 (39.6%) and is leading the cloud ERP market in the U.S.
59 Source: (1) „Hype Cycle for Emerging Technologies 2013“, Gartner, July 2013 (2) Gartner website (last accessed: 05.08.2014) 60 Microsoft’s software revenue mainly derives from system and B2C software while IBM’s breakdown shows strong engagement in infrastructure software.
61
According to their respective annual reports, cloud revenue grew by 33% for Salesforce and 32% for Netsuite in 2013. 62
Relative market share is measured by dividing SAP’s share with that of the next biggest competitor. Thus, a relative market share >1 indicates market leadership and vice versa.
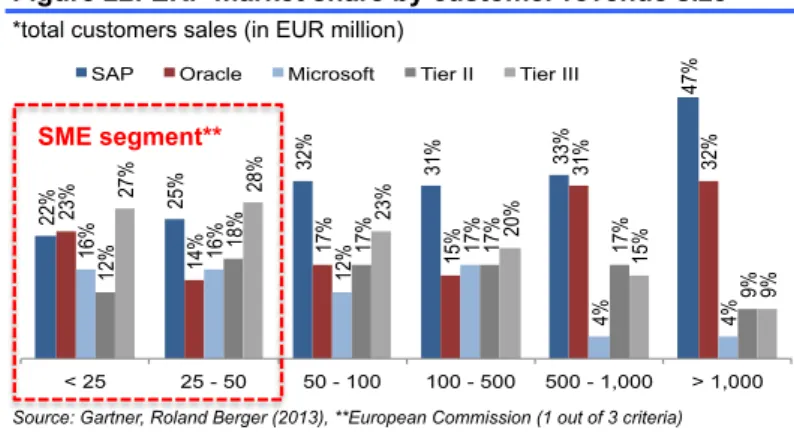
Figure 22: ERP market share by customer revenue size*
*total customers sales (in EUR million)
Source: Gartner, Roland Berger (2013), **European Commission (1 out of 3 criteria)
22% 25%
32% 31% 33%
47%
23%
14% 17% 15%
31% 32%
16% 16%
12%
17%
4% 4%
12%
18% 17% 17% 17%
9%
27% 28%
23%
20%
15%
9%
< 25 25 - 50 50 - 100 100 - 500 500 - 1,000 > 1,000 SAP Oracle Microsoft Tier II Tier III
SME segment**
Table 1: SAP market share analysis (2013)
Source: Gartner (June 2014), Analyst's estimates
SAP market share
Relative market share
(Next) biggest competitor
Top 2 market concentration*
Top 5 market concentration*
ERP 24% 2.0 Oracle 36% 53%
CRM 13% 0.8 Salesforce 29% 50%
BI 21% 1.5 Oracle 35% 69%
SCM 24% 1.5 Oracle 40% 49%
*aggregation of market shares from respective number of players
SAP is increasingly exposed to competition in ERP SME market.
Figure 21: Top 5 vendors by revenue
2013 software revenue in USD billion
Source: Gartner (April 2014)
6.4 18.5
29.1 29.6
65.7
SAPSE COMPANY REPORT
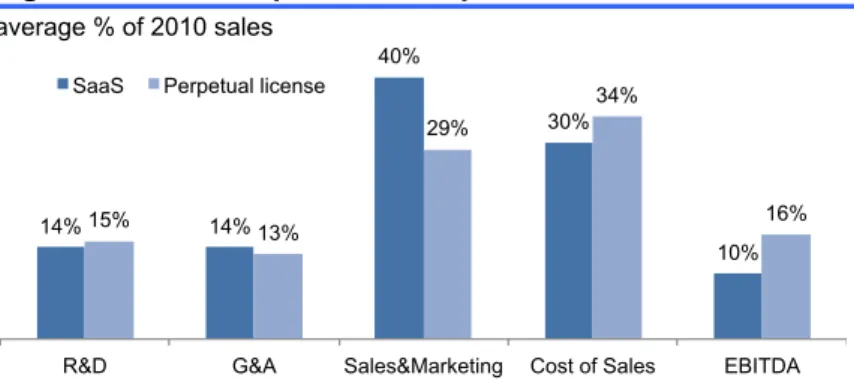
In the CRM market, SAP lost 170 bps in market share in two years while that pure-play cloud vendor Salesforce increased by 300bps over the same time period. Even if SAP’s recent decline in market share might be attributed in full to the success of Microsoft or IBM (gaining 1% each from 2011 to 2013), we would not exclude the possibility of Salesforce taking share from SAP going forward. Note that the development is of particular interest in this case, since CRM is the fastest growing segment with the highest SaaS penetration rate (see ‘Markets’), thus might serve as model case for possible evolutions in other segments. In a concentrated market like Analytics (BI, hereafter used interchangeably), SAP holds the leadership position with 21% in 2013. Notably, IBM was the only top 5 player that was able to increase market share in the last three year (+110bps). Overall, we view this market segment as crucial differentiator for software vendors. Firstly, other applications become more attractive when enriched with analytical capabilities, which is currently demanded feature by key executives.63 Secondly, in collaboration with the rise of Big Data technology, analytics may allow for new business models with undiscovered productivity gains for which customers would be willing to pay a premium. Less worrisome for SAP, is the development in the SCM market. After the acquisition of US-based Ariba, Inc. in 2012, the market is led by SAP with 23.9% share in a very fragmented market and thus a relative market share of ~1.5x compared to the 2nd biggest player Oracle. The disruptive technology of cloud computing comes along with an equally disruptive business model (see ‘Key value drivers’), which in turn affects the competitive forces. First, incumbents may benefit from the efficient use of existing infrastructures (i.a. datacentres, sales employees) and client bases, which allows (sooner) for more profitable operations. This is due to the fact that lower EBITDA margins and return on invested capital (ROIC)64 are expected before reaching adequate scale.65 Figure 26 supports our reasoning with current market data. To illustrate the role of economies of scale we estimated the break-even for one major fix cost to provide cloud services: the datacentre. IDC, estimates yearly TCO for a datacentre at ~USD 42 thousand per year and 100 users66, Salesforce would need 12 out of 100 users67 to break-even on the costs of the datacentre, provided that the sample datacentre fulfils the technical requirements.
63
In response to the C-Suite survey of IBM: CMOs, CHROs and CIOs named Analytic capabilities among their top 3 priorities for technology. (Source: „The customer-activated enterprise“, 2013)
64
Source: “Bain Brief - The cloud reshapes the business of software”, Bain & Company, 2013 65
Our intuitive reasoning: Firstly, selling on-premise licenses involves determining a peak volume (capacity). At this pre-defined volume, licenses are negotiated. Thus, generally the client pays for possible over-capacities.
Cloud subscriptions on the contrary, will transfer that hidden value to customer as they are now running on a demand basis. Secondly, Adobe’s deteriorating margins when transforming to the cloud serves as a model case for economies of scale. 66
Source: „Converging the Datacentre Infrastructure: Why, How, So, What?“, IDC, May 2012 67
The ‘Performance Edition’, which is a fully integrated Sales & Service cloud offering, is priced at USD 300 per user and month. (Source: Salesforce company website, accessed on 27.12.14)
Going forward, we view the Analytics market as a key differentiator.
Figure 23: CRM market share
Source: Gartner
12%
14%
16%
14%
13% 13%
12% 11%
10%
6% 6%
7%
3% 4%
4%
2011 2012 2013
Salesforce SAP Oracle Microsoft IBM
Figure 24: BI market share (2013A)
Source: Gartner
SAP 21%
Oracle 14%
IBM 13% SAS
Institute 12% Microsoft
9% Others
33%
Figure 25:
Top 6 by SaaS revenue (2013)
in USD million
Source: Gartner (June 2014) 972
1,117 1,194 1,213 1,473
2,766
SAPSE COMPANY REPORT
A second advantage for incumbents might use of cloud products as complementary deployment option alongside a company’s legacy system, so called hybrid deployments.68 A survey of HCL with SAP’s 100 largest customers revealed that 88% are considering a hybrid model, also because the integration of applications into existing landscape is seen as major risk by 45% of respondents.69 Due to this reluctance we believe customer attrition is less of a problem provided that existing customers are given the choice of migration. However, due to the increased bargaining power of customers (see ‘Demand’) we believe incumbents like SAP will need to increase customer loyalty in order to maintain a strong market position. A recent survey by Bain&Company, found that market leaders are more likely to be among vendors with a strong customer loyalty, supports our view.70 SAP has a solid standing in that regard with a Net Promoter Score71 (NPS) of 12%72, compared to the enterprise IT average of 8% that Bain surveyed. Last, we believe in the differentiating power of SAP’s customized ERP solutions to ensure price stability and avoid aggressive migration to more standardized products of current cloud competitors like Salesforce or NetSuite. Nonetheless, we see possible obstacles in the battle over market share in emerging markets and SMEs where standardized and low-cost solutions are demanded (see ‘Growth opportunities’).
The most relevant market for Big Data is the relational database management systems (RDBMS) market.73 The high market share concentration (Top 5 hold 94.3%) also indicates that incumbent players like IBM, Microsoft or Oracle as they have the assets and the reach to set industry standards (platforms) for building a valuable ecosystem. IDC predicts industry specific platforms to be the
68
Source: “Why big systems are here to stay”, Accenture, January 2012 69
Source: „The Future of SAP Cloud“, HCL, June 2014
70 The result was that vendors with high Net Promoter score - a measure for customer loyalty - were twice as likely as laggards to be market leader. (Source: „New Enterprise IT NPS Survey“, Bain&Company, August 2013)
71
The Net Promoter Score is the percentage of customers that are likely to promote the company’s product, net of those that are to depress it.
72
Source: Annual Report 2013, SAP
73 Source: „Gartner says Worldwide IT Spending on Pace to Grow 2.1 Percent in 2014“, press release, Gartner, June 2014 Figure 26: KPI Comparison - On-premise vs. SaaS vendor
average % of 2010 sales
Source: Bain&Company
14% 14%
40%
30%
10% 15%
13%
29%
34%
16%
R&D G&A Sales&Marketing Cost of Sales EBITDA SaaS Perpetual license
Figure 27:
RDBMS market share (2011A)
Source: Gartner
Oracle 48.8%
IBM 20.2% Microsoft
17.0% SAP 4.6%
Teradata 3.7%
Others 5.7%
Economies of scale are necessary for profitable growth in the cloud segment.
The demand for hybrid models is seen as an
SAPSE COMPANY REPORT
future of Big Data developments74, in our view, leaving smaller players like SAP and new entrants with the choice of (a) betting on the right platform through partnerships or (b) developing their own platform. SAP seems to prefer the combination of option (a) and (b) with an in-house developed platform called SAP HANA and strong partnerships with IBM and Amazon75. The value of option (b) is discussed in detail in sub-section: ‘SAP HANA – Enabler or Driver?’
Strategic outlook for SAP
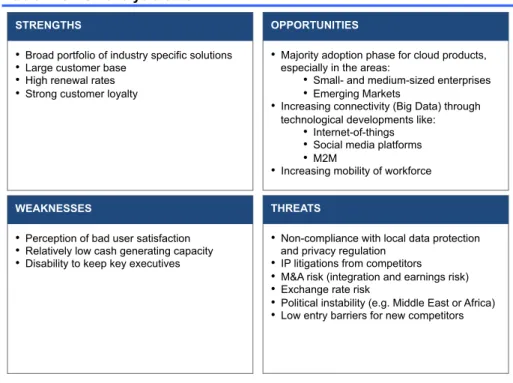
Summarizing our key findings, we present SAP’s core strengths and weaknesses as well as the industry’s threats and opportunities within (see Table 2). Interpreting the SWOT analysis, we are confident to say that we believe in the
competitive advantage of SAP. First and foremost because the diversified and
loyal customer base with over 250 thousand customers worldwide might: (a) allow for cross selling at low cost (economies of scope), (b) capital efficient operations in innovative areas (economies of scale) and (c) lock-in effects76, thus low retention rates, in legacy systems. Secondly, SAP’s ability to customize their products and enrich them through analytical capacities through an integrated application landscape (SAP HANA) may allow the company to sustain a price premium. Thirdly, and as a consequence of the arguments above, further valuable partnerships may be formed that enriches SAP’s geographical reach.
74 Source: „IDC Predictions 2014“, IDC, December 2013 75
Both players have been certified for deployments of SAP cloud applications in 2014. The reason being that IBM (Softlayer) and Amazon (AWS) are building industry standard platform to become the vendor of choice for cloud IT infrastructure (IaaS). 76
They occur because of high switching costs that derive from high up-front deployment costs: on average they amount to USD 2.5 million or 4% of customers’ revenue. (Source: “Clash of the Titans 2014”, Panorama Consulting Solutions, January 2014)
The existing client base is expected to be a competitive advantage for SAP.
Table 2: SWOT analysis on SAP
Source: Company data, Analyst's estimates
STRENGTHS
• Broad portfolio of industry specific solutions
• Large customer base
• High renewal rates
• Strong customer loyalty
OPPORTUNITIES
• Majority adoption phase for cloud products, especially in the areas:
• Small- and medium-sized enterprises
• Emerging Markets
• Increasing connectivity (Big Data) through technological developments like:
• Internet-of-things
• Social media platforms
• M2M
• Increasing mobility of workforce
WEAKNESSES
• Perception of bad user satisfaction
• Relatively low cash generating capacity
• Disability to keep key executives
THREATS
• Non-compliance with local data protection and privacy regulation
• IP litigations from competitors
• M&A risk (integration and earnings risk)
• Exchange rate risk
• Political instability (e.g. Middle East or Africa)
• Low entry barriers for new competitors
Past success factor
SAPSE COMPANY REPORT
Key value drivers
Speaking in terms of the BCG matrix77, ERP could be referred to as SAP’s “cash cow”. Thus our strongest value driver remains the demand for this product, which is – as part of IT spend – to some extend driven by macroeconomic developments (see ‘Forecast’). The growth of the CRM market, fuelled by high adoption rates of cloud solutions (see ‘Markets’), representatively highlights the importance of assessing the impact of cloud growth on SAP (see ‘The cloud(y) transition’). Last, we discuss how the foundation across all product and delivery lines - SAP HANA - contributes to the big picture (see ‘SAP HANA – Enabler or Driver?’).
The cloud(y) transition
The business model transition outlined by SAP (see Figure 29) indicates that each incremental dollar in cloud revenue results in a loss of 3.5x on-premise revenue in the first year and 1.1x by the end of a three-year contract. On top of that, operating margins are negatively affected due to high ramp up costs (e.g. datacentres, sales & marketing, etc.) and missing economies of scale (see ‘Competitive positioning’).
77
We are aware of the fact that the BCG matrix suffers explanatory power for strategic planning. In particular since product life cycles have been strongly accelerated since the conception of this tool and differentiations on two axes is arguably at least.
Figure 28: SAP software revenue mix by product/delivery (2013A)
Source: Company data, Gartner (May 2014)
0% 5% 10% 15% 20% 25%
0% 20% 40% 60% 80% 100%
0% 5% 10% 15% 20% 25%
0% 10% 20% 30% 40% 50%
OP# C#
CRM#
BI# ERP#
SCM#
13.1bn 0.8bn
6.1bn
3.1bn 2.6bn
2.1bn
Ma
rk
e
t
g
ro
w
th
(C
A
G
R
‘
1
3
–‘
1
7
)
as percentage of SSRS revenue
Figure 29: SAP business model comparison
Source: Company data (2014), Analyst's estimates
Year 1 Year 2 Year 3 Year 4 Year 5 Year 1 Year 2 Year 3 Year 4 Year 5 Deal margin SSRS revenue
On-premise model
Software contract with 22% maintenance fee (Enterprise Support)
Cloud subscription model
Three years contract with renewal possibility of 90%
1+0.22
0.22 0.22 0.22 0.22 0.35
0.50 0.50 0.45 0.45
ERP software is the ‘cash cow’ of SAP, while CRM offers the highest CAGR 13-17.
SAPSE COMPANY REPORT
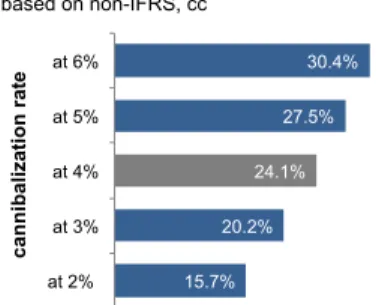
For SAP, the question evolves much around the speed of adoption. Particularly worrisome is the growth in cloud subscriptions on the back of license business (cannibalization) as it accelerates the shift from high- to low-margin revenue. Our analysis over the past 2 years, suggests a cannibalization effect of -4% on license revenue growth (see Appendix 3). Taking -4% as a base case scenario, we modelled several scenarios around that variable and based on the business model presented above. Comparing ‘mild’ (2%) (Table 7 in Appendix 3) and ‘strong’ (6%) (Table 8 in Appendix 3) case, we see virtually no effect on top-line growth (Ø - 40bps) but strong decline in operating margin and EPS growth (Ø 150bps, respectively) as cannibalization increases. To further verify our modelled results, we also challenged one profound assumption of the cloud business model: the cloud subscription model implies a higher NPV after ~4.4 years (see Figure 30). This implies, that renewal rates remain at around 90%78. Our scenario analysis shows how that the break-even cloud vary between ~4.2 years for 99% renewal rate and ~5.1 years for renewal rate of 82% - a much stronger downside then upside. Thus, a change in renewal rates in the future could significantly impact our model.
SAP HANA – Enabler or Driver?
The reason SAP HANA database catches investors attention is that it provides the opportunity to take a bigger stand in an upstream market worth USD 24bn79 which, according to Research and Markets, is expected to grow at 10.1% CAGR 12-1680 (vs. SAP’s ~15% in 201181). On top of that, market potential is given through cross-selling opportunities. As of today, a majority of SAP customers using Oracle’s database management systems (DBMS) to run SAP applications. Simply put, with the introduction of SAP HANA, the company wants to: (a) avoid Oracle benefiting from SAP application deals and (b) increase the share-of-wallet with its clients.
While the technical details of the SAP HANA are not discussed in-depth in this report, we summarize for now that the migrating customers benefit from: speed, agility and lower total cost of ownership (according to Forrester study82: 37% across hardware, software and labour costs (TCO)). Yet, customers signal concerns for migration due to high up-front costs (~ USD 3.5m for SAP ERP
78
An expected year 3 revenue stream of 0.5 and an expected year 4 revenue stream of 0.45 implies a probability of renewal of 90% (see Figure 29). Furthermore, Co-CEO Mr. Mc Dermott was cited by Wall Street Journal saying: „renewal rates (are) in the 90s“.
(Source: „SAP’s Co-Head Is Into the Cloud“, 21.10.13) 79
Source: Gartner, March 2012 80
Source: „Global RDBMS Market 2012-2016“, press release, Research and Markets, September 2013 81
Source: Press release, SAP, June 2012
82Source: „Projected Cost Analysis for the SAP HANA platform“, Forrester, April 2014
“We believe a large number of SAP customers going to migrate to HANA over the next few years” – Tom Joyce, SVP and GM for Converged Systems at HP
Figure 30: NPV comparison comparing EUR 1 in license vs cloud sales
Source: Company data, Analyst's estimates 0
0.5 1 1.5 2 2.5 3
Year 1
Year 2
Year 3
Year 4
Year 5
Year 6
Year 7 On-premise deal
Cloud deal 2.24
2.07 NPV @ 8% WACC