Printed in Brazil - ©2007 Sociedade Brasileira de Química 0103 - 5053 $6.00+0.00
A
r
ti
c
le
*e-mail: [email protected]
Nucleation and Growth Mechanism of Polycarbazole Deposited by Electrochemistry
S. Yapi Abé,a,b Lastenia Ugalde,c M. Angélica del Valle,c Yann Trégouëtd and J. Christian Bernède*,a
a
Université de Nantes, Nantes Atlantique Universités, LAMP, EA 3829, Faculté des Sciences et des Techniques, 2 rue de la Houssinière, BP 92208, Nantes, F-44000 France
b
Laboratoire de Physique de la Matière Condensée et de Technologie (LPMCT), Université de Cocody, BP 582 Abijan 22, Côte D’ivoire
c
Facultad de Química, Pontificia Universidad Católica de Chile (PUC), Vicuña Mackenna 4860, Santiago, Chile
d
Laboratoire de Physique des Solides pour l’Electronique (LPSE), Université de Nantes, BP 922008 Nantes cedex 3, France
Neste trabalho foram estudados os mecanismos de nucleação e de crescimento (MNC) de camadas finas de policarbazol (PCz) depositadas por eletro-oxidação de carbazol em LiClO4 + acetonitrila anidra sobre um substrato de vidro coberto com SnO2, usando método potenciostático.
Os transientes corrente-tempo (j-t) obtidos foram ajustados usando uma equação matemática que levou em conta três contribuições: a nucleação instantânea com crescimento bidimensional (IN2D) e tridimensional (IN3D) e, também, a nucleação progressiva com crescimento tridimensional (PN3D). No começo, a contribuição IN2D predomina mas, rapidamente, o processo IN3D passa a ser o mais importante. Para tempos de deposição t ≥ 17 s, IN3D corresponde a 80% da corrente total. A visualização da morfologia da superfície das películas de PCz via microscopia eletrônica de varredura (SEM) concorda com o MNC proposto pelo método matemático. A película cobre muito rapidamente a camada de SnO2 que está relacionada ao processo bidimensional, 2D, mesmo que se observe alguma heterogeneidade distribuída aleatoriamente na película, proveniente do processo tridimensional, 3D. Após dois minutos de deposição, a rugosidade de toda a superfície dos depósitos corrobora a predominância dos processos 3D. Conseqüentemente, a informação obtida diretamente a partir dos transientes (j-t) é uma ferramenta muito conveniente e útil para predizer as condições de trabalho com o intuito de controlar o tipo de morfologia da película preparada por eletro-polimerização.
Polycarbazole (PCz) thin films have been deposited by electro-oxidation of carbazole in LiClO4
+ anhydrous acetonitrile onto SnO2 coated glass substrates, by potentiostatic method and the nucleation and growth mechanism (NGM) were studied. The obtained current time transients (j-t) were fitted using a mathematical equation with three contributions: instantaneous nucleation with two-dimensional (IN2D) or three-dimensional (IN3D) growth, and also a progressive nucleation with three dimensional (PN3D) growth. At the beginning, the IN2D contribution is predominant but, quickly the IN3D processes become more important. At a deposition time t ≥ 17 s the IN3D corresponds to 80 % of the total current. The visualization by scanning electron microscopy of the surface morphology of the PCz films is in agreement with the NGM proposed by the mathematical method. The film covers very rapidly the SnO2 under layer related to the 2D
process, even if some heterogeneities randomly distributed in the films, issued from the 3D processes, are also visible. After two minutes of deposition, the roughness of the whole surface of the films corroborates the 3D processes domination. Therefore, the information directly obtained from the (j-t) transients is a suitable and very useful tool to predict the working conditions in order to control the type of morphology of the film prepared by electropolymerization.
Introduction
Presently electroactive and photoactive properties of polymers have aroused much importance because of the numerous applications, e.g., organic light emitting diodes (OLED) are now available in the market. If less studied than other families of polymers, such as, polyaniline, polypyrrole, polythiophene, polyparaphenylene and even polyvinylcarbazole, polycarbazoles are interesting with regards to their photoconductivity,1,2
electro-luminescence,3-5 electrochromic properties,6,7 application
as plastic blue lasers8 and Schottky diodes.9
Different techniques have been used to achieve this polymer. Polycarbazole has been synthesized by chemical route e.g., oxidative polymerization with FeCl3.10 Thin films of conducting polycarbazole have also
been grown by Langmuir-Blodgett process.11 Another
route consists in the electrochemical oxidation of carbazole in solution.12,13
Detailed studies concerning physical, chemical and optoelectronic properties of polycarbazole electrochemically synthesized have been done. Also the influence of the supplying source of monomer on the properties of the polymer has been studied.13 However, while they have strong
influence on the different film properties, no study about the nucleation and the growth mechanisms (NGM) during the electropolymerization has been done.
Theoretically, the NGM process can be described using different equations, which have been obtained by analogy with those used in the case of metallic deposits; even though, the electropolymerization process is not analogous. First of all, the NGM of a conducting polymer requires the oxidation of monomers either adsorbed on the electrode surface or coming from the solution. Then, the oxidized monomers diffuse towards the interface where oligomerization takes place. Oligomeric high density region (OHDR) is built. Then, when supersaturation is reached, clusters are deposited onto the electrode, which induces nuclei growth.14-18
Different processes can be involved in the NGM and, often, they can occur simultaneously (or successively). The dominant process depends on the experimental conditions and on the variation of the electro-polymerization time. The NGM depends on different parameters, such as, monomer and electrolyte concentrations and solvent and substrate chemical nature.
In the present work, we use the current response to elucidate the kinetics of deposition,14-18 through the NGM
mechanism, with the aim of finding a correlation between the morphology of the film and the NGM.
Experimental
The electrochemical experiments were performed on a Radiometer PGP 201 potentiostat/galvanostat. A classical three compartments, three electrode cells was used. The reference electrode was Ag/AgCl, tetramethyl-ammnium chloride ≈ 0.1 mol L-1.19 The working electrode
was a 1 cm2 SnO
2 coated glass substrate and the counter
electrode was a platinum sheet. The scan rate used in the voltammetric study (CV) was 500 mV min-1.
Potentials, from cyclic voltammograms, in the nucleation range were selected to register j-t transients.
All solutions were flushed with dry argon, which was maintained over the solution during the experiments, carried out at room temperature (20 °C).
The carbazole (Cz) monomer (99%) was purchased from Fluka. Anhydrous acetonitrile (99.98 %) was purchased from Aldrich. The supporting electrolyte was lithium perchlorate (> 98.0%) from Fluka. The optimum solution composition determined from a preceding work, was: 5×10⁻³ mol L-1 Cz, 0.1 mol L-1 LiClO
4 in acetonitrile. 5
This concentration was chosen because it allows, as will be seen further, in the presence of the three contributions to the global NGM to be clearly appreciated, which is interesting to demonstrate the effect of the working conditions upon the morphology of the deposit.
The morphology of the surface of the films was determined in a field emission scanning electron microscope (SEM), JEOL F-6400.
Nucleation and growth mechanisms theory
It has been shown that the equation established in the case of metal films electrodeposition20 can be used
to study the NGM of polymers.21,22 Different
nucle-ation and growth mechanisms should be introduced because instantaneous nucleation mechanisms under charge transfer control with a two-dimensional (IN2D) or a three-dimensional (IN3DCT) growth, as well as, progressive nucleation mechanism under diffusion control with two-dimensional (PN2D) or three-dimensional (PN3DDIF) growth can occur. These equations have been amply described and utilized both in the above mentioned references and in previous research work.23,24 In the present case, we describe only
j = P t1 exp (−P t + P2 3 − −P t4 P t5 − −P t6
2 2 0,5 2
[1 exp ( )] + − [1 exp ( )](1)
with ρ π 2 2 2 1
2 nMhFN k
P= D
2 2 2 2 2 2 ρ
πN M k
P= D = ′
3 3 NFk
P 2 3 2 3 2 4 ρ
πM k ND
P= 2 1 2 1 5 ρ π ∞
= FD C
P 2 6 D k A
P= ′ π
where n, M, F and ρ have their usual meaning, in that order, the number of electrons involved by molecules, the molar mass of the carbazole, Faraday constant and density of the film; h and k2 correspond respectively to the height and the growth rate constantof the 2D nuclei; N2D and N3D represent the number of instantaneous 2D and 3D nuclei formed at t = 0; k3 and k´
3 are the 3D rate constants
for the growth parallel and perpendicular to the substrate, respectively; D and C
∞ are the diffusion coefficient and the bulk concentration of the monomer; respectively; A´
= ANDiff (A is the nucleous formation rate constant, NDiff is the number of nuclei formed at t = 0 under diffusion control); 2 1 8 3 4 ⎟⎟ ⎠ ⎞ ⎜⎜ ⎝ ⎛ = ∞ ρ
πC M
k
Each contribution in equation 1 corresponds to instantaneous nucleation with two-dimensional growth (IN2D), instantaneous nucleation with three-dimensional growth (IN3DCT), and progressive nucleation with three dimensional growth (PN3DDIF) mechanism, respectively.
Results and Discussion
Figure 1 shows the potentiodynamic j/E profiles of the first five successive scans. It can be seen that anodic peaks appear at Ea1 = 920 mV and Ea2 = 1230 mV, while cathodic peaks are obtained at Ec1 = 830 mV and Ec2 = 960 mV. Ea1, Ea2 are oxidation peaks and Ec1 and Ec2 are reduction peaks. Since Ea2 = 1230 mV allows obtaining the deposition of polycarbazole (PCz) onto SnO2, the characteristic loop of surface modification was observed. From these results, potentiostatic step experiments were carried out between 1.15 V and 1.22 V (“nucleation range”).
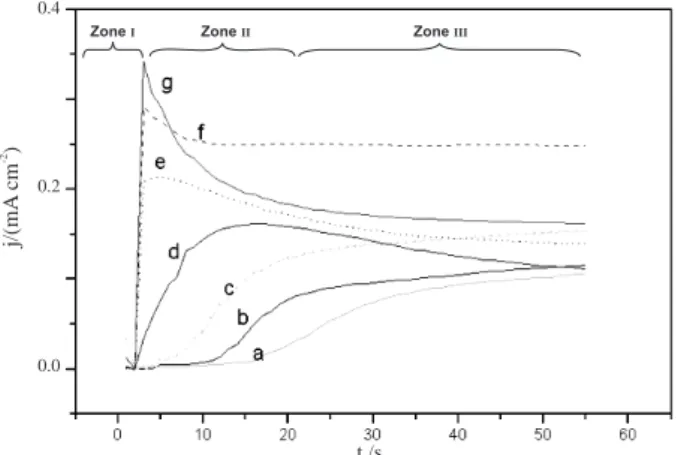
The variation of current density with time (j-t transients) at these polarisation potentials is depicted in Figure 2. It can be seen that the initial current falls to a minimum after some time τ (induction time) (zone I) and
then increases steeply until it reaches a maximum (zone II) followed by a slow decrease or current plateau (zone III). Consequently, to determine the NGM, the point where the current start raising, due to nucleation, is considered as τ = 0. The induction time τ corresponds just to the exponential drop owing to monomer oxidation (Cotrell) while the OHDR is built. Thus, once the degree of oversaturation of the OHDR is reached, the oligomers precipitate upon the electrodic surface, bringing about generation of the deposit.14,15,25
The time interval of zone II increases when the polarisation potential decreases. Zone III corresponds to slow current decrease or tends towards a plateau when the polarisation potential decreases. Nevertheless, this feature is only observed within a short range of suitable potential: 1.15-1.18 V. Higher potentials produce erratic response, due to over-oxidation and for potentials lesser than 1.15 V, larger τ is required to observe the nucleation and growth process.
Figure 1. Successive voltammetric scans during Cz electro-polymeriza-tion: SnO2/5×10-3 mol -1 Cz + 10-1 mol L-1 LiClO
4, in anhydrous CH3CN. v = 500 mV min-1.
0.0 0.2 0.4 0.6 0.8 1.0 1.2 1.4
j/(mA
cm
)
-2
E/(V) vs SCE 2.0
1.0
0.0
Figure 2. Potentiostatic transients during Cz electro-polymerization: SnO2/ 5·10-3 mol L-1 Cz + 10-1 mol L-1 LiClO
4, in anhydrous CH3CN. E= a) 1.15; b) 1.16; c) 1.17; d) 1.18; e) 1.20; f) 1.21; g) 1.22 V. (The three zones (I, II, III) are shown in the case of curve d).
j/(mA
cm
)
-2
t /s
ZoneI ZoneII ZoneIII
0.4
0.2
To establish the NGM during the electrodeposition of PCz the best equation to fit the current transients with high precision was equation 1.
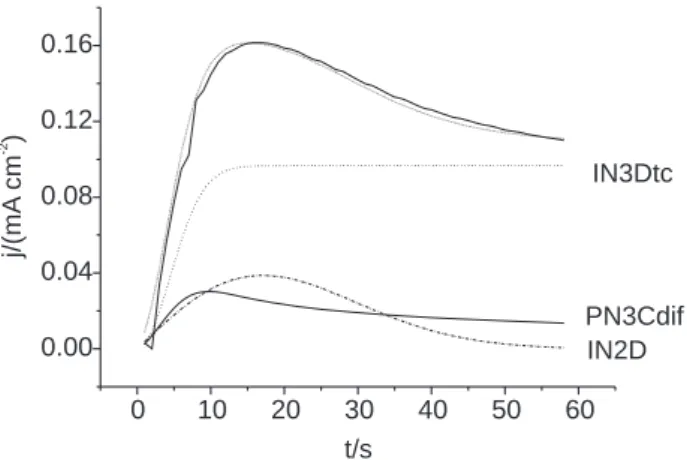
Figure 3 shows the experimental and theoretical current transient which has been fitted according to equation (1) when the polarization potential is 1.18 V. IN2D, IN3DCT and PN3DDIF contributions are also reported in this Figure (their addition allows the obtention of the theoretical curve, that fits within 2% the experimental one) while Table I gives the obtained values for P1, P2,…P6.
It can be seen that the relative weight of each contribution varies with time. For example, when the polarization potential is 1.18 V it can be observed that: (i) for t < 4 s, the three contributions are active, (ii) from t > 4 s, processes IN3DCT and IN2D predominate, even if the PN3DDIF is still increasing up to 10 s, (iii) from t > 17 s the IN2D contribution begins to decrease steeply and nearly disappears (because 2D nuclei coalesce), (iv) PN3DDIF contribution to the global charge hardly varies as a function of electrolysis time, (v) for t e” 55 s, IN3DCT corresponds to 80 % of the total current.
It can be inferred from the above analysis that during the first seconds of the growing process, two instantaneous nucleations take place and then the 3D process sets out. Later, the polymer growth is progressively controlled by charge transfer. The fact that the contribution of the PN3DDIF mechanism (where the rate of nuclei growth is diffusion controlled) being almost independent of time may be ascribed to that, in this case, the diffusional control
depends not only upon diffusion of the monomer from the bulk of the electrolytic solution to the electrode/ solution interface, but also, it must cross the OHDR, which influences the kinetics of the electrodeposition process.14,15,25 Therefore, to obtain a compact deposit,
short-pulse program must be applied, e.g., working under the conditions used herein: 1 s at 1.15 V. On the other hand, if a porous film is wanted, potential step, as used in this work, has to be utilized.
Although at the start the IN2D contribution is important, the time it takes for the nuclei to coalesce is rather high (ca. 20 s), which can be explained by considering that the electrode employed possesses a relatively large area (it takes time to plate the total surface). The kinetics of the reaction also influences this process since, compared with other polymers deposition,14-17
coalescence of the nuclei takes much more time here. Nevertheless, the IN3DCT charge transfer controlled has a constant contribution through the electrolysis time, which would be responsible for the continuous growth of the initially formed nuclei. Consequently, it should exist “particles of regular size”, although, at the same time, other diffusion controlled PN3DDIF nuclei are being progressively formed, which means that particles of different sizes exist too. This may be explained considering that, although, in both cases a tridimensional growth may exist, the type of nucleus is different because it stems from oligomers of different chain length and, in addition, they must reach the electrodic surface after crossing the OHDR, which proves the validity of the proposed model for this kind of NGM.25
Scanning electron microscopy (SEM) studies were carried out to determine the correlation of the proposed NGM with the morphological properties of the deposited polymer.
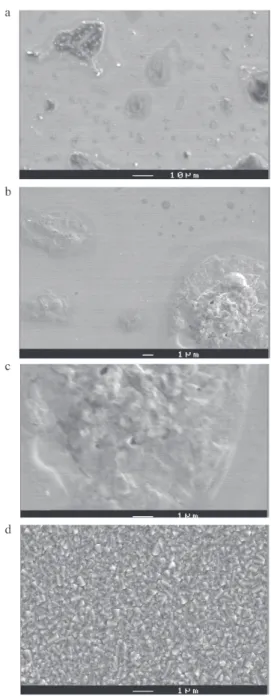
Figure 4 shows images at different magnifications of PCz films obtained at a step potential of Ep = 1.18 V for 5 s. Also, a SnO2 coated glass before polymer deposition is depicted. By comparison with Figure 4d (bare SnO2), it can be clearly seen that the polymer film covers the whole surface of the substrate, which agrees with the preceding NGM modelling. Effectively we have proposed that, when Ep = 1.18V, up to 4s of deposition time, although IN2D is an important contribution, it is not the only one, IN3DCT and PN3DDIF are also present and become predominant after 5 s. As a matter of fact, the presence of heapsis also observed. Sometimes the surface of these structures exhibit volcano shape (Figure 4c), which can be associated to a conic growth related to IN3DCT (or PN3DDIF) process. Therefore, in Figure 4 may be seen that the three NGM processes are active during the first seconds of deposition. In the experimental conditions
Table 1. Values obtained for variables in equation 1.
EP / V P1 P2 P3 P4 P5 P6
1.18 4.7×10⁻⁶ 1.7×10⁻³ 6×10⁻⁵ 2.5×10⁻² 1.1×10⁻⁴ 2.5×10⁻²
Figure 3. Experimental ( — ), and theoretical (• • • • •) current-time transient
at EP = 1.18 V. The theoretical curve is the sum of the three different contributions noted in the figure.
0 10 20 30 40 50 60
0.00 0.04 0.08 0.12 0.16
t/s
j/(mA
cm
)
-2
IN2D PN3Cdif
used above, the whole surface of the substrate is covered after only 5 s of deposition.
Figure 5 shows the evolution of the surface morphology of a PCZ film after 5 s, 10 s, 15 s and 20 min of deposition. It can be observed that as the deposition time increases, some coalescent effect of the structures is present in the films. After 10 - 15 s, long and rought path forms all over the film surface. By comparison with the homogeneity of the layer covering the whole substrate, the roughness of the path corroborates the fact that the IN3DCT process becomes predominant.
For a 2 min deposition time (Figure 5d) the whole surface of the sample is covered with a rough polymer film, which confirms the almost disappearance of the IN2D contribution and the predominance of the IN3DCT process. The decrease of two-dimensional contribution as the deposition time increases, can be explained considering that the IN2D contribution prevails due to the strong interactions existing between the monomers or short chain oligomers with the transparent conductive oxide surface, which favour the formation of a 2D ad layer.26 This fact
does not exclude the possibility that the 3D nucleus may
Figure 5. Micrographs of PCz thin film obtained at Ep = 1.18 V for (a) 5 s, (b) 10 s, (c) 15 s and (d) 2 min.
be formed on preferential sites randomly distributed on the rough surface of the SnO2 under layer (Figure 4d). For t > 17 s, the IN2D contribution decreases because the 2D nuclei coalesce (Figure 4a).
Afterwards, the predominant process is the IN3DCT, which becomes responsible for 80% of the total current.
Conclusions
PCz films have been deposited by potentiostatic techniques in order to study its nucleation and growth mechanism. The results of this work show that after coalescence of IN2D nuclei, the IN3DCT process becomes predominant, as shown by the current-time transient curve fitting. The second part of the study provides evidence that the morphologic structures observed by SEM analysis agree with the nucleation and growth models established from the j-t transients for the PCz electrodeposition on SnO2 electrode. In other words, this work confirms that the NGM determination directly correlates with the morphology established by SEM. Therefore, the information obtained concomitantly with the deposiion process at controlled potential (j-t transient), constitute a very useful tool to predict the working conditions aimed at controlling the film morphology prepared by electropolymerization.
Acknowledgments
This work has been financially supported by the ECOS-CONICYT action C05E10. Dr. YAPI Abé would like to thank University Agency of La Francophonie (AUF) for financial support (Postdoc scholarship).
References
1. Patil, A.O.; Ikenoue, Y.; Wudl, F.; Heeger, A.J.; J. Am. Chem. Soc. 1987, 109, 1858.
2. Patil, A. O.; Ikenoue, Y.; Basescu, N.; Colaneri, N.; Chen, J.; Wudl, F.; Heeger, A. J.; Synth. Met. 1987, 20, 151-.
3. Chayer, M.; Faïd, K.; Leclerc, M.; Chem. Mater. 1997, 9, 2902. 4. Cloutet, E.; Olivero, C.; Ades, D.; Castex, M. C.; Siove, A.;
Polymer2002, 43, 3489.
5. Durán G., M.; PhD Thesis, Pontificia Universidad Católica de Chile, Santiago, Chile, 2002.
6. Ikenoue, Y.; Tomozawa, H.; Saida, Y.; Kira, M.; Yashima, H.; Kobayashi, M.; Synth. Met. 1991, 40, 333.
7. Tran-Van, F.; Henri, T.; Chevrot, C.; Electrochim. Acta2002,
47, 2927.
8. Castex, M. C.; Olivero, C.; Fischer, A.; Mousel, S.; Michelon, J.; Adès, D.; Siove, A.; Appl. Surf. Sci.2002, 197-198, 822. 9. Syed Abthagir, P.; Saras Wathi, R.; Org. Electron.2004, 5, 299. 10. Siove, A.; Adès, D.; Polymer2004, 45, 4045.
11. Choudhury, S.; Saxena, V.; Gupta, S. K.; Yakhmi, J. V.; Thin Solid Films2005, 493, 22.
12. Diamant, Y.; Chen, J.; Han, H.; Kamenev, B.; Tsybeskov, L.; Grebel, H.; Synth. Met. 2005, 151, 202.
13. Taoudi, H.; Bernède, J. C.; del Valle, M. A.; Bonnet, A.; Morsli, M.; J. Mat. Sci. 2001, 36, 631.
14. Schrebler, R.; Grez, P.; Cury, P.; Veas, C.; Merino, M.; Gómez, H.; Córdova, R.; del Valle, M. A.; J. Electroanal. Chem. 1997,
430, 77.
15. del Valle, M. A.; Cury, P.; Schrebler, R.; Electrochim. Acta2002,
48, 397.
16. del Valle, M. A.; Ugalde, L.; del Pino, F.; Díaz, F. R.; Bernède, J. C.; J. Braz. Chem. Soc. 2004, 15, 272.
17. del Valle, M. A.; Ugalde, L.; Díaz, F. R.; Bodini, M.; Bernède, J. C.; J. Appl. Polym. Sci. 2004, 92, 1346.
18. del Valle, M. A.; Ugalde, L.; Díaz, F. R.; Bodini, M.; Bernède, J. C.; Chaillou, P.; Polym. Bull. 2003, 51, 55.
19. East, G. A.; del Valle, M. A.; J. Chem. Ed. 2000, 77, 97. 20. Harrison, J.; Thirsk H. In Electroanalytical Chemistry; Bard,
A. S., ed.; Marel Dekker: New-York, 1972, vol. 5.
21. Asavapiriyanont, S.; Chandler, G. K.; Gunawardena, G. A.; Pletcher, D.; J. Electroanal. Chem. 1984, 177, 229.
22. Asavapiriyanont, S.; Chandler, G. K.; Gunawardena, G. A.; Pletcher, D.; J. Electroanal. Chem. 1984, 177, 245.
23. Ugalde, L.; Bernède, J. C.; del Valle, M. A.; Díaz, F. R.; LeRay, P.; J Appl. Polym. Sci. 2002, 84, 1799.
24. González-Tejera, M. J.; Carrillo, I.; Hernández-Fuentes, I.;
Electrochim. Acta2000, 45, 1973.
25. del Valle, M. A.; Díaz, F. R.; Bodini, M. E.; Alfonso, G.; Soto, G. M.; Borrego, E.; Polym. Int. 2005, 54, 526.
26. Obretenov, W.; Schmidt, H.; Lorez, W. J.; Staikov, G.; Budevski, E.; Carnal, D.; Miller, U.; Siegenthaler, H.; Schmidt, E.; J.
Electrochem. Soc. 1992, 140, 692.
Received: June 7, 2006