www.scielo.br/rbg
COMPARISON OF AUTOMATIC AND SEMI-AUTOMATIC METHODS
FOR CLASSIFICATION OF SIDE SCAN SONAR IMAGERY
Tiago Rafael de Barros Pereira
1, Helenice Vital
1,
André Giskard Aquino da Silva
2and Cecília Alves de Oliveira
1ABSTRACT.The main scope of this paper is the analysis of seafloor classification using acoustic remote sensing data. These data were acquired in a hydroacoustic survey of bathymetry and sonography using an interferometric swath bathymetry system. The study area is a sector of the internal northeast Brazilian shelf adjacent to the Ponta Negra beach - Natal (RN, Brazil). The objective of the work is to identify and draw the different textural patterns, which characterize the seafloor of the study area. In addition, two approaches for textural classification of sonograms were compared and evaluated, which were: Automatic Gray Level Co-occurrence Matrix (GLCM) classification available in SonarWiz software; and the semi-automatic Maximum Likelihood, available in ArcGIS software. The comparison tested the capacity for identifying and drawing the textural patterns distribution. The automated classification identified 5 patterns while on the semi-automated 6 patterns were identified. It was made the correlation between the textural patterns found in each classification, besides the correlation between textural patterns and the levels of intensity of reflectance presents on the sonogram.
Keywords: sonography, textural classification, textural patterns, hydroacoustic.
RESUMO.Este trabalho foi realizado a partir da análise de dados geofísicos adquiridos em levantamento hidroacústico de batimetria e sonografia utilizando um sonar interferométrico EdgeTech 4600. A área de estudo é uma porção da plataforma interna do nordeste brasileiro adjacente Natal (RN). O objetivo deste trabalho é identificar e delimitar os diferentes padrões texturais que caracterizam o substrato marinho da área de estudo. Adicionalmente, são avaliadas e comparadas duas abordagens distintas de classificação textural de sonogramas, sendo elas: a classificação automática GLCM disponível no software SonarWiz, e a classificação semi-automática máxima verossimilhança (Maximum Likelihood) disponível no software ArcGIS. A comparação foi realizada com base na capacidade de identificação e delimitação da distribuição dos padrões texturais. A utilização da classificação automática identificou 5 padrões, enquanto que, na classificação semi-automática 6 padrões foram identificados. Foi feita a correlação entre os padrões texturais encontrados em cada classificação, além da correlação entre os padrões texturais e os níveis de intensidade de reflectância presente no sonograma.
Palavras-chave: sonografia, classificação textural, padrões de textura, hidroacústica.
1Universidade Federal do Rio Grande do Norte, Centro de Ciências Exatas e da Terra - CCET, Departamento de Geologia, Campus Universitário – Lagoa Nova, 59078-970,
hydroacoustic techniques for seabed imaging led to the increase in mapping accuracy, quality and velocity. Such advances improved the geological, biological and geomorphological classification of the seabed allowing the identification of geohabitats (Brown & Collier, 2008).
The accurate mapping of geohabitats, seabed morphology and sedimentology (i.e. textural classification of sonograms) are the first necessary steps for the implementation of hydro-ways, construction of new harbors, installation of structures for hydrocarbons exploration and production (E&P), and other mineral resources (e.g. gas hydrates, manganese nodules, sand extraction, etc.). Moreover, seabed mapping is an important tool for coastal zone management and coastal protection projects (Che Hasan et al., 2014).
Seabed mapping for bottom classification is based on the analysis of the backscattered hydroacoustic wave (Blondel, 2009). Different types of substrate result in different intensities of the backscatter (Che Hasan et al., 2014). However, the seabed sedimentological (or textural) classification requires in
different patterns on the sonogram, therefore, dependent of the interpreter’s experience and knowledge of the area (Souza, 2006). Automatic and semi-automatic classifications have been used to minimize subjectivity on the seabed classification process, which is based on statistical analysis of the backscatter signal to define the spatial limits of the textural classes which are present in a given location.
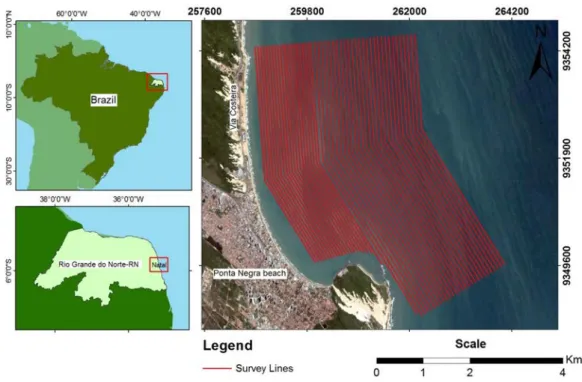
In this sense, this work targeted the comparison between automatic and semi-automatic seabed classification, using side scan sonar backscatter signal, of the inner shelf adjacent to Ponta Negra beach (Natal-RN), which is located at the northeast Brazilian coast (approximately -5.8◦latitude) (Fig. 1).
The area has approximately 18.0km2, with depths varying
between 2.0m and 13.0m. The continental shelf is ∼25.0km wide with the shelf break occurring at ∼60.0m water depth. In the adjacent Ponta Negra beach, the Morro do Careca sandy costal dune occurs on top of a rocky headland. Tides on this location are semi-diurnal with amplitudes ranging from ∼1.4m to ∼2.2m, for neap- and spring tide, which characterizes a meso-tidal regime.
Figure 2 – Flowchart presenting the steps to process the sonograms.
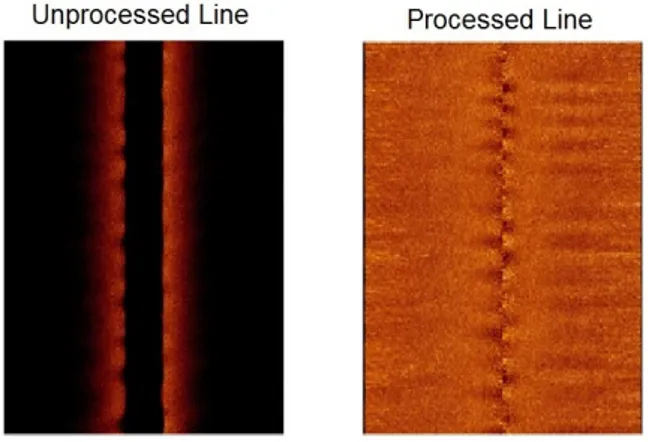
Figure 3 – Raw (left) and processed (right) sonograms showing the
improvement in image quality.
METHODOLOGY
The data were acquired with an integrated interferometric system EdgeTech 4600 which records simultaneously high resolution multi-beam bathymetry and side scan sonar. It has a maximum angular coverage of 200◦ which allows covering 12 times the
water depth (limited to a maximum of 140m swath coverage for bathymetry data acquisition) and operates at 54kHz.
A GPS, a depth sounder, a motion reference unit and a gyrocompass were used in the survey to record the position information of sonar data. The side scan sonar data were acquired with 150m swath coverage. The insonified area covered approximately 18km2totaling 50 coastal parallel lines ranging of
4.9km to 5.5km length. The survey lines were spaced 60m to 80m from each other, depending on water depth (Fig. 1).
To process the bathymetry data the software Hypack 2014 was used to integrate sound velocity, tide and bathymetry data. The SonarWiz 5.0 software was applied to process the sonograms following the steps described in the flowchart of Figure 2.
The sonograms were georeferenced (Datum WGS84, UTM projection Zone 25S), and the swath percentage was defined based on visual inspection of the backscatter intensity of the far beams in relation to the near beams, when imaging the same textural sediment type. This evaluation revealed that using 90% of swath coverage would guarantee both total (100%) bottom coverage (yet minimizing data overlap) and uniformity of backscatter data across swath. Moreover, the bottom tracking tool was used to eliminate the blank area at nadir. The Empirical Gain Normalization (EGN) standardized colors of areas which have similar reflectance (i.e. same backscatter signal intensity) using
The processing flow (Fig. 2) significantly improved the sonograms quality and facilitated visual identification of the textural patterns (Fig. 3).
The side scan sonar mosaic was done following reflectance tones and was adjusted to initiate seabed textural classification.
Automatic classification was performed using the software SonarWiz 5.0 by applying the Gray Level Co-occurrence Matrix (GLCM). In this classification the following image attributes were used: standard deviation, entropy, auto-correlation and pixel contrasts.
Semi-automatic classification was performed using the software ArcGIS. In this classification the number of classes was determined by visual analysis of the sonogram which had the color tone variation as the major parameter for determining textural classes. The software uses Maximum Likelihood to determine the spatial limit between adjacent classes. The validation of the textural classification was done using sediment samples archived at the Geologia e Geofísica Marinha e Monitoramento Ambiental (GGMMA) laboratory located at Universidade Federal do Rio Grande do Norte (UFRN).
RESULTS Bathymetry
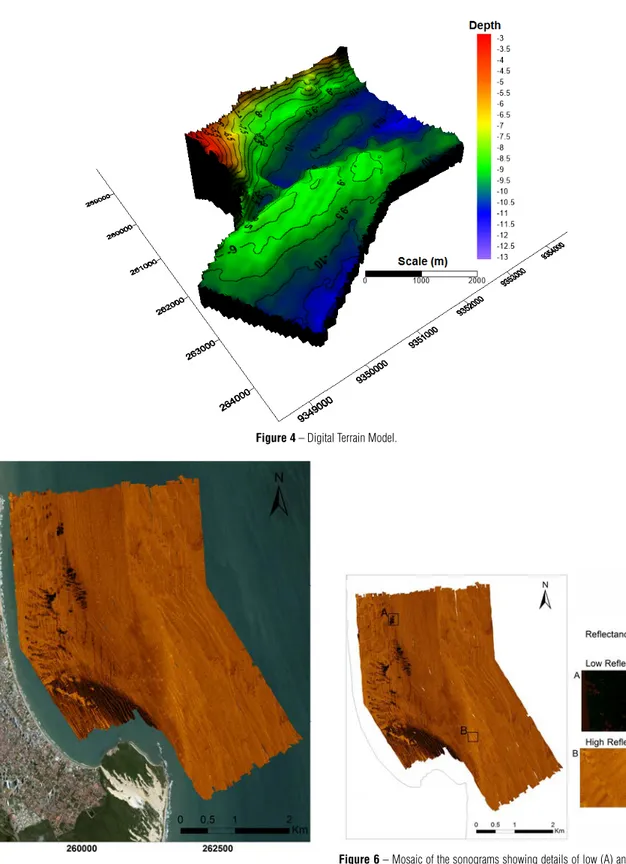
Bathymetry depth ranges in the area from 13.9m to a minimum of 2.5m and mean depths of 8.29m (Fig. 4).
Sonography
Figure 4 – Digital Terrain Model.
Figure 5 – Sonography mosaic.
Figure 6 – Mosaic of the sonograms showing details of low (A) and high (B)
The color tones are directly related to reflectance (backscatter intensity), hence, regions showing dark color tones are characterized by low reflectance (high attenuation of the acoustic wave) while regions of bright color tones are characteristic of high reflectance (low attenuation of the acoustic wave) (Fig. 6).
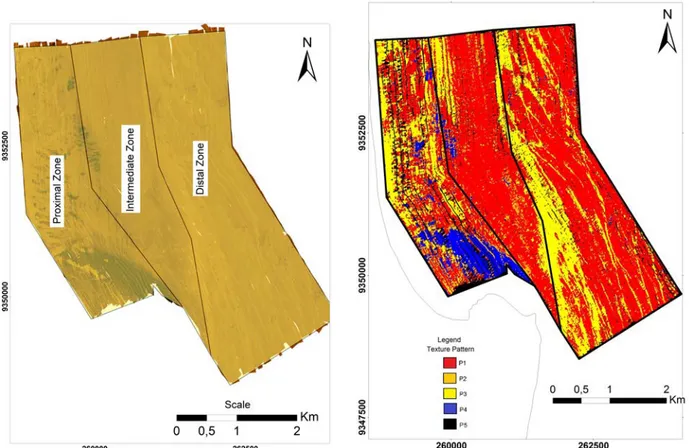
For ease description and understanding of the results, the survey area was divided in three zones according to their respective distance from the shoreline (proximal, intermediate, distal) (Fig. 7).
CLASSIFICATION Automatic Classification
In GLCM automatic classification 5 textural patterns were identified named P1 to P5 (Fig. 8).
In the proximal zone the pattern P1 appears more frequently with 42.74% occurrence along the entire zone (Table 1). Textural pattern P2 covers 7.66% of the proximal zone, occurring in contact to P4. In turn, P4 covers approximately 16.4% of the proximal zone, occurring predominantly on the south. P3 correspond to 32.64% of the proximal zone and occurs predominantly at the central part of this zone.
On the intermediate zone all textural patterns were present, however, P1 covers 77.59% of this zone (Fig. 8). P3 is the second most representative textural pattern found on the intermediate zone. P1 and P3 represent 92.55% of the textural variability of this one, with P3 occurring predominantly at east and west extremities of this zone (Table 1, Fig. 8). The textural pattern P2 occurs predominately on the south part of this zone and corresponds to 5.97% of it. The pattern P4 covers 1.36% of the textural variability of this zone and its occurrence is concentrated on the center west portion (Fig. 8).
Figure 7 – Division of the survey area in three zones: proximal, intermediate
and distal.
represent 1.03% of the textural variability of this zone; hence, the distal zone has the least textural variability when compared to the proximal and intermediate zones (Fig. 8).
In general, the textural pattern P1 occurs more frequently than all others added, corresponding to 63.60% of the survey area. P3 was the second more abundant textural pattern, covering 27.48% of the survey area. P4 and P5 together represent 4.74% and 0.27% of the survey area, respectively, while P2 covers 3.92% (Table 1).
Table 1 – Percentages of the textural patterns found on the survey area according
to the automatic classification.
Textural patterns Proximal Intermediate Distal Total area P1 42.74% 77.59% 67.16% 63.60% P2 7.66% 5.97% 0.74% 3.92% P3 32.64% 14.96% 31.63% 27.48% P4 16.40% 1.36% 0.29% 4.74% P5 0.56% 0.12% 0.18% 0.26% 100.00% 100.00% 100.00% 100.00%
Table 2 – Percentages of the textural patterns found on the survey area according
to the semi-automatic classification
Textural patterns Proximal Intermediate Distal Total area P1 42.71% 65.23% 60.11% 56.62% P2 12.15% 14.24% 4.18% 8.98% P3 21.90% 14.49% 34.02% 25.62% P4 4.49% 0.87% 0.51% 1.70% P5 8.92% 3.84% 0.95% 3.90% P6 9.83% 1.33% 0.23% 3.18% 100.00% 100.00% 100.00% 100.00% Semi-automated classification
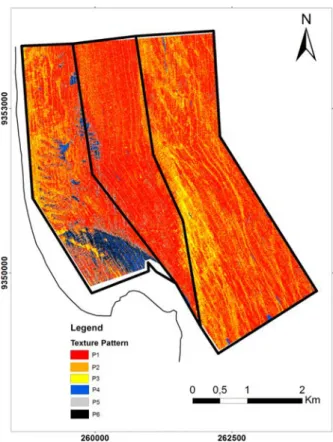
On the semi-automated classification 6 textural patterns were identified named P1 to P6 (Fig. 9). The proximal zone shows highest heterogeneity among the three zones (Fig. 9). P1 is the textural most abundant pattern, covering 42.71% occurring predominantly on the west part of this zone (Fig. 9). P3 is the
associated to P6 and P2. The textural pattern P6 corresponds to 9.83% of this zone and it is found on the south. (Fig. 9). P4 represents 4.49% of the proximal zone, found at its central and south parts and always in contact to P6 (Fig. 9).
On the intermediate zone predominates the textural patterns P1, P2 and P3 which add up 93.96% of this zone (Table 1). P1 is the most common, corresponding to 65.23% and occurring throughout the entire zone. P2 and P3 are found with approximately the same frequency (14.24% and 14.49%, respectively). P2 was found predominantly on the center-south portion, while P3 occurs along the east limit and to the northwest. The patterns P4, P5 and P6 add 6.04% of this zone and are found preferably at its midwest portion (Fig. 9).
Figure 9 – Semi-automatic classification performed using the software ArcGIS.
The distal zone shows the least textural variability and it is composed predominately by P1 and P3, which add 94.13% of the textural patterns found on this zone (P1=60.11% and P2=34.02%, respectively) (Table 2). P1 occurs throughout the
Figure 10 – A – Sonography mosaic with location and textural classification of seabed samples/ B – Semi-automatic classification/ C – Automatic classification
entire zone, however, it is concentrated on the east (Fig. 9). P3 is commonly found at the midwest portion. The textural patterns P2, P4, P5, and P6 add 5.87% of this zone occurring mainly to the east part, where P1 predominates (Fig. 9).
DISCUSSION
Texture is one of the characteristics of a sonogram used to distinguish reflectance levels of a given acoustic wave on the seabed (Lurton, 2002; Blondel, 2009). In this way data from the automatic and semi-automatic classification were associated to textural patterns, which in turn correspond to different reflectance levels (Fig. 10). On the survey area low reflectance was correlated to fine to very-fine grained unconsolidated sediments (i.e. silt or clay) (Fig. 10A). Conversely, regions of high reflectance were correlated to unconsolidated sediment sand (i.e. siliciclastic, carbonate or mixed sands) or bedrocks (i.e. rocks or compacted sediments) (Collier & Brown, 2005; Brown & Collier, 2008).
Automatic classification generates faster results and it is independent from the interpreter’s subjectivity on the determination of the number of textural classes present on the sonogram (Souza, 2006). However, its comparison with the semi-automatic textural classification revealed that automatic classification underestimated the number of classes. (Figs. 10B and 10C).
The textural pattern P3 represent the same textural pattern on the classifications automatic and semi-automatic, respectively. They represent maximum reflectance sites, hence, brighter color
P4 on the automatic classification represent the merge of P4 and P6 of the semi-automatic classification. At these sites occurs the highest attenuation of the acoustic wave on the survey area (i.e. lowest reflectance).
The pattern P1 on automatic and semi-automatic classifications, are correlated and represent an intermediate reflectance level.
P2, of the automatic classification, was correlated to P5, of the semi-automatic classification, and they represent sites of low to intermediate reflectance levels. The textural pattern P5, of the automatic classification, represent an artifact resulted from the application of the bottom tracking tool to remove the water column (nadir blank area) from the sonogram. This artifact was not present on the semi-automatic classification.
The textural pattern P2 of the semi-automatic classification could not be correlated to any of the automatic classification. On the sonogram this pattern represents an intermediate reflectance level and considered as a transition from P1 to P5 (Fig. 11).
A qualitative analysis of the products from automatic and semi-automatic classifications reveal that they represent approximately on the same manner the major textural patterns. However, automatic classification drew abrupt contacts between different classes while semi-automatic classification managed to capture a gradational transition between them, which commonly occurs in nature (Wang et al., 1998; Trindade & Ramos-Pereira, 2009).
The automatic classification was not able to resolve the gradational transition between adjacent textural classes.
Figure 11 – A - Transition zone from low reflectance to intermediate reflectance/B - Transition zone in semi-automatic classification
showing the transition from P5 and P2.
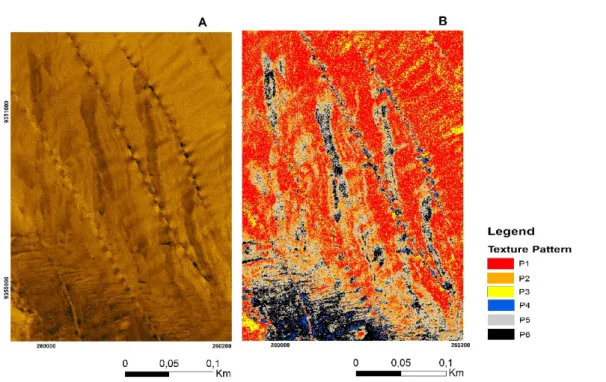
Figure 12 – Transition zone between different textural patterns (A - Sonography mosaic/ B - Semi-automatic classification/ C - Automatic
classification).
Moreover, in coastal depositional systems the faciologic distribution is directly related to the hydrodynamic conditions of the area which promote gradational transition between the facies (e.g. beach system) (Wang et al., 1998; Calliari et al., 2003; Trindade & Ramos-Pereira, 2009).
Once the survey area is inserted on the inner continental shelf (Coutinho, 1976; Vital et al., 2010; Vital, 2014) it is likely that such gradational contact occurs and that the semi-automatic classification most accurately described the sedimentological variability on the survey area (Fig. 12).
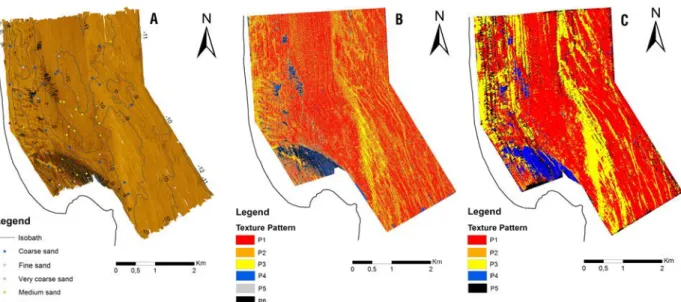
Figure 13 – A - Sonography mosaic and sampling station/ B - Integration between sediment composition and automatic classification/ C - Integration between grain
size of sediment and automatic classification.
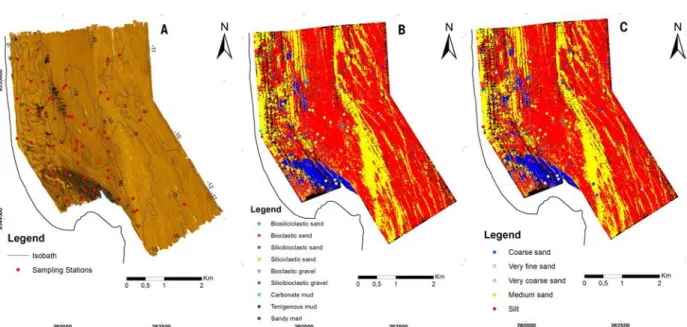
Figure 14 – A - Sonography mosaic and sampling station/ B - Integration between sediment composition and semi-automatic classification/ C - Integration between
grain size of sediment and semi-automatic classification.
The comparison with seabed sediment samples reveal that the variability of the reflectance patterns is related not only to grain size but also to sediment composition (i.e. different proportions of siliciclastic versus bioclastic material in the samples). However, low reflectances are still related to fine grained sediment (P4 of automatic classification and P4 and P5 of the semi-automatic classification), while on higher reflectances the variability is
associated to compositional changes of the sand (i.e. variations on the bioclastic vs siliciclastic material) (Figs. 13 and 14).
CONCLUSION
The processing steps applied on the sonograms revealed to be efficient on the improvement of the sonogram’s quality by
hand, the semi-automatic classification efficiently resolved the gradational transition between adjacent sedimentary facies. Therefore, the experience of the interpreter still plays a significant role on the analysis of sonograms for textural classification of seabed.
ACKNOWLEDGMENTS
Thanks are due to PRH-ANP22 (MCT/FINEP/CTPETRO) for the scholarship to the first author. Funding of this research was provided by projects PLAT N-NE (REDE 05/FINEP/CTPETRO), CNPq grant no. 311413/2016-1, Ciências do Mar 207-10 (CAPES), INCT/AMBTROPIC and SOS PONTA NEGRA (CNPq). The authors would like to thank the Brazilian students participating in fieldwork.
REFERENCES
BLONDEL P. 2009. The Handbook of Sidescan Sonar. Geophysical Sciences. Berlin Heidelberg: Springer-Verlag. 326 pp.
BROWN CJ & COLLIER JS. 2008. Mapping benthic habitat in regions of gradational substrata: An automated approach utilising geophysical, geological, and biological relationships. Estuarine, Coastal and Shelf Science, 78(1): 203-214.
CALLIARI JL, MUEHE D, HOEFEL FG & TOLDO Jr E. 2003. Morfodinâmica praial: Uma breve revisão. Revista Brasileira de Oceanografia, 51: 63-78.
CHE HASAN R, IERODIACONOU D, LAURENSON L & SCHIMEL A. 2014. Integrating Multibeam Backscatter Angular Response, Mosaic and
Geology, 214(4): 431-449.
COUTINHO PN. 1976. Geologia marinha da plataforma continental Alagoas-Sergipe. Tese (livre docência) - Centro de Tecnologia. Universidade Federal de Pernambuco. Brazil. 112 pp.
LURTON X. 2002. An Introduction to Underwater Acoustics. Springer Science & Business Media. 680 pp.
SIMONS DG & SNELLEN M. 2009. A Bayesian approach to seafloor classification using multi-beam echo-sounder backscatter data. Applied Acoustics, 70: 1258-1268.
SOUZA LAP. 2006. Revisão crítica da aplicabilidade dos métodos geofísicos na investigação de áreas submersas rasas. Doctorate thesis. Instituto Oceanográfico. Universidade de São Paulo, Brazil. 311 pp. TRINDADE J & RAMOS-PEREIRA A. 2009. Sediment Textural Distribution on Beach Profiles in a Rocky Coast. (Estremadura – Portugal). Journal of Coastal Research, 56(SI): 138-142.
VITAL H. 2014. The north and northeast Brazilian tropical shelves. In: CHIOCCI FL & CHIVAS AR (Eds.). Continental Shelves of the World: Their Evolution during the Last Glacio-Eustatic Cycle. volume 41, p. 35-46. Geological Society of London. URL https://dx.doi.org/10.1144/ M41.4.
VITAL H, GOMES M, TABOSA W, FRAZÃO EP, SANTOS CLA & PLÁCIDO JÚNIOR JS. 2010. Characterization of the Brazilian continental shelf adjacent to Rio Grande do Norte state, NE Brazil. Brazilian Journal of Oceanography, 58(SPE1): 43-54.
WANG P, DAVIS RA & KRAUS NC. 1998. Cross-shore distribution of sediment texture under breaking waves along low-wave-energy coasts. Journal of Sedimentary Research, 68(3): 497-506.
Recebido em 16 fevereiro, 2017 / Aceito em 28 dezembro, 2018 Received on February 16, 2017 / accepted on December 28, 2018