AUTOMATED PROCESSING OF HIGH RESOLUTION AIRBORNE IMAGES
FOR EARTHQUAKE DAMAGE ASSESSMENT
F. Nex, E. Rupnik, I. Toschi, F. Remondino
3D Optical Metrology Unit, Bruno Kessler Foundation, Trento, Italy Email: (franex, rupnik, toschi, remondino)@fbk.eu
Web: http://3dom.fbk.eu
Commission I, WG I/2
KEY WORDS: Imagery, Matching, Orthophoto, Urban, Classification, Feature Extraction,
ABSTRACT:
Emergency response ought to be rapid, reliable and efficient in terms of bringing the necessary help to sites where it is actually needed. Although the remote sensing techniques require minimum fieldwork and allow for continuous coverage, the established approaches rely on a vast manual work and visual assessment thus are time-consuming and imprecise. Automated processes with little possible interaction are in demand. This paper attempts to address the aforementioned issues by employing an unsupervised classification approach to identify building areas affected by an earthquake event. The classification task is formulated in the Markov Random Fields (MRF) framework and only post-event airborne high-resolution images serve as the input. The generated photogrammetric Digital Surface Model (DSM) and a true orthophoto provide height and spectral information to characterize the urban scene through a set of features. The classification proceeds in two phases, one for distinguishing the buildings out of an urban context (urban classification), and the other for identifying the damaged structures (building classification). The algorithms are evaluated on a dataset consisting of aerial images (7cm GSD) taken after the Emilia-Romagna (Italy) earthquake in 2012.
1. INTRODUCTION 1.1 General context
In recent years, Earth Observation (EO) systems (satellite as well as aerial acquisitions) became a new asset at the disposal of emergency response teams in case of natural disasters and hazards (earthquake, tsunami, landslide, subsidence, flooding, hurricane, volcanic eruption, etc.). EO systems can perform rapid mapping of damages and help guide rescue efforts. This was formalised in 2000 when ESA, CNES and CSA signed the ‘International Charter - Space and Major Disasters’ – an agreement to prioritise image acquisition over disaster zones. Among the most tragic and hazardous natural disasters, earthquakes represent the highest mortality rate (Bartels and VanRooyen, 2011). Although fully-functional early warning systems are still far to be achieved, it is possible to reduce the impact of an event through an effective risk mitigation and disaster management plan. In this respect, collecting real-time or near real-time data of post-event damaged area can be of paramount importance in order to plan an adequate rescue and reconstruction response. For instance, in urban areas the amount of building damage, the rate of collapsed buildings and the type of damage affecting each building represent crucial information for a successful post-event strategy (Schweier and Markus, 2006). In order to gather this information, the use of geo-spatial data proved to be valuable and relevant for the entire disaster management cycle (Altan et al., 2001; Clark et al., 2010). Although there are many data sources that can be efficiently exploited by the geo-information science, remotely sensed data are usually preferred over ground surveys, that are restricted to façade detection and limited by productivity issues. Remote sensing techniques, require minimal fieldwork and allow continuous coverage, fast response, digital processing and quantitative results to be achieved with an automatic or semi-automatic approach. A comprehensive review of these methods can be found in (Rezaeian and Gruen, 2008; Dell’Acqua and
Gamba, 2012; Dong and Shan, 2013), where their application for obtaining building damage information is discussed. Within the remote sensing application field, data are collected either by space-borne or airborne platforms, and both passive (e.g. optical and multispectral imagery) and active (e.g. LIDAR and SAR technology) sensors are effectively exploited. Optical images can be used to extract a number of building properties, such as grey scale, spectral, texture, shape and morphological features (Rathje et al., 2005; Guo et al. 2009; Dong and Shan, 2013). Among optical systems, satellite platforms are usually preferred when a large area should be surveyed. Some limitations are nevertheless to be considered (Rezaeian and Gruen, 2008), such as weather-related restrictions and concerns due to satellite revisit time, that restrict the data collection over a given area to a particular time of the day. On the contrary, aerial imagery benefits from a more flexible data acquisition, both in terms of time and flight pattern. The on-board sensors have usually a much higher spatial, spectral and radiometric resolution compared with that of most satellite sensors. A review of the different airborne platforms and sensors for damage assessment can be found in (Kerle et al. 2008), whereas Joyce et al. (2009) summarize the space-borne available solutions for the same application field.
Airborne as well as space-borne image data are usually collected from a conventional vertical perspective, that reduces occluded area and makes the data registration phase a rapid and automatic process. This traditional way of image acquisition is largely limited to collection of roof information, while façades are not visible or visible at high incidence angles. For that matter nadir imagery is useful if a complete collapse is to be identified yet useless in case of small damages, whose effects are typically detectable only along the façades. A promising solution to this issue is in the use of airborne oblique imagery, alone or in combination with nadir data. Façade information available in such imagery can be analysed in order to distinguish structural damages that affect façades, even if the roof is still intact or only partially destroyed. Few papers The International Archives of the Photogrammetry, Remote Sensing and Spatial Information Sciences, Volume XL-1, 2014
investigate the use of oblique images to take a detailed inventory of damages on the building façades. In Altan et al. (2001) a number of indicators are adopted to identify different categories of damage, such as proximity to critical structural elements. This method requires the provision of a reference “framework” for each structure, with a clear disadvantage in terms of both rapid and safe damage assessment. Gerke and Kerle (2011) assess the adoption of airborne oblique multi-view Pictometry data by processing them within a two-step strategy. Images are first classified using a supervised approach and 22 image-derived features, then classification results are combined from different viewing directions into a per-building damage score in accordance with the European Macroseismic Scale1. Finally, Unmanned Aerial Vehicle (UAV) platforms (Nex and Remondino, 2013; Colomina and Molina, 2014) are becoming a valuable source of data for post-disaster assessment and response is nowadays an active area of research. A review of recent applications of UAVs for image acquisition in disaster related situations can be found in Adams and Friedland (2011) with advantages that can support the adoption of UAVs, such as flexibility, ease of operation, and relatively low-cost of ownership and operation.
Once the optical data are collected after an earthquake, several automatic methods can be adopted in order to process them and detect the damaged buildings. According to the available input data, two main categories of damage assessment approaches can be identified, i.e. multi-temporal and single epoch strategies.
Multi-temporal methods are usually able to provide better results but they are dependent on the availability of reliable data that describe the pre-event building condition. They can be categorized in “Image to Image” and “Map to Image” approaches. The former are based on the application of change detection algorithms using both pre- and post-event images. Several papers have already presented promising results achieved using this approach (Huyck et al, 2005; Yamazaki et al., 2008; Tomowski et al., 2010). The damage assessment usually consists of four main phases: image registration, object extraction, attributes (features) collection and classification. Both pixel-based and object-oriented classification strategies can be efficiently applied in the latest step (Bitelli et al., 2004). Very different algorithms such as Fuzzy Inference Logic (Samadzadegan and Rastiveisi, 2008) or augmented Bayesian network (Rezaeian and Gruen, 2008) can be adopted. In the “Map to Image” approach, multi- or single epoch (post-event) data are used in combination with vector information (e.g. maps produced from GIS data before the event), in order to easily locate all buildings on the images. Then, the assessment of each building is performed by extracting spectral, texture and structural features (Guler and Turker, 2004).
The detection of building damage by using only post-event data (i.e., single epoch) has recently been boosted by the availability of high-resolution imagery. The development of this approach was also forced by the lack of reliable pre-event information occurring at many occasions. Many properties characterizing partially-destroyed and/or collapsed buildings have been efficiently exploited for damage detection, such as edge, statistical textures, spatial relationship and spectral information. For instance, the use of single-epoch airborne imagery is discussed in (Guo et al., 2009, Sirmacek and Unsalan, 2009).
1.2 Objectives
Most of the aforementioned methods use supervised approaches to classify and assess damages. The downside of such
1
http://www.protezionecivile.gov.it/cms/attach/editor/rischio-sismico/Scala_EMS-1998.pdf (last accessed: 16 October 2014)
approaches is the requirement to collect training samples, that is a time-consuming task. This issue neglects their application in emergency response conditions or when unskilled users have to provide a damage map.
In this paper we present a novel unsupervised approach for the automated detection of damaged buildings that attempts to address the shortcomings of existing approaches. The algorithm is evaluated on a set of high-resolution airborne images acquired over an urban landscape after a seismic event. Imagery is the most common type of information available immediately after an earthquake, hence it is the only input for the detection routines.
The algorithm implementation and initial results will be described in the following sections. The paper is organized as follows: the methodology is first described, giving a brief introduction into the Markov Random Fields (MRF) and the general workflow of the algorithm. A description of the used features is given as well. The test areas and the achieved results are presented in Section 3, while the conclusions and the outlooks are discussed in Section 4.
2. METHODOLOGY 2.1 Classification methods
To classify an image or a point cloud means to assign a class (the so-called label) to every 2D-pixel or 3D-point (the so-called site) respectively. The problem is solved in a supervised or unsupervised manner.
The supervised approach requires a data training phase in which the class samples, represented by feature vectors, undergo a statistical learning. The learning procedure generates a discriminative function that can map feature vectors to probabilities of belonging to a given class. The state-of-the-art classifiers are: random forests, support vector machines,
AdaBoost or the classical maximum likelihood classifier (Schindler, 2012).
In unsupervised classification there is no explicit teacher and no
a priori knowledge on the class membership of the samples. Unfortunately the autonomy comes at the expense of more complexity and less reliability as the classifier does not know the class appearance explicitly. Among established methods that infer classes from unlabelled data we can cite: K-means, Fuzzy-c-means, AUTOCLASS, DBSCAN, expectation maximization
(Estivill-Castro, 2002).
Less popular methods involve solving the classification problem with graphical modelling. These methods were proved in unsupervised (Lafarage and Mallet, 2012; Gerke and Xiao, 2014) and supervised (Schindler, 2012) scenarios. Graphical models are represented by vertices that denote random variables and edges that denote their mutual relationships. The edges are either directed (causal model; Bayesian Network) and model conditional dependencies between vertices, or undirected (non-causal models; Markov Random Field) corresponding to the joint probabilities.
Bayesian Network factorizes the joint probability distribution to a product of conditional distribution for each node,
∏ | (1)
where x are sites, and are the parents of ; the latter factorizes to a product of clique potentials,
∏
(2)
where the clique is defined by the site with its connected neighbourhood, the partition function is a normalizing factor The International Archives of the Photogrammetry, Remote Sensing and Spatial Information Sciences, Volume XL-1, 2014
and, notably, the potentials normally do not have any probabilistic interpretation (Bishop, 2006).
On the other hand, Markov Random Fields (MRFs) with their non-causal property, allows to flexibly handle interactions among 2D-pixels, 3D-points or other sites. MRFs incorporate contextual constraints into the labelling problem by biasing neighbouring sites to have the same class hence leading to a smoother result. Under this assumption sites are no longer independent random variables but compound random fields. They depend on both data and classes of neighbouring sites (the
clique) (Kumar and Hebert, 2006; Li, 2009; Schindler, 2012). The classification, effectively, tries to maximise the expression in Eq. (2), or alternatively minimize an energy function
∑
∑
(3)
on a graph consisting of a set of nodes , connected by a set of edges . Denoted by is the class labels set.
The data penalty function (unary potential) contains information about the probability of a given site to belong to a particular class . This class preference is evaluated for every site and every class.
The term, called the interaction or binary potential, encourages spatial coherence (i.e. smoothness) by penalizing sites whose neighbour class assignment dissents. Two established models to specify the interactions are the Ising model in case of binary classification and the Pottsmodel for multiclass problems.
Several efficient algorithms exist to infer the optimal configuration of classes with respect to the energy function defined as in Eq. (3). The global method of graph cut (Boykov and Kolmogorov, 2004) is definitely among the best optimization schemes.
2.2 The developed workflow
The implemented classification methodology adopts the MRF theory in conjunction with the Potts model to describe interactions between 3D-points. The unary potential of each regarded point is a product of factors i.e. the features calculated on the basis of the height information - provided by the photogrammetric DSM (in form of geo-referenced depth map) - and spectral information – provided by the generated true orthophoto (see section 2.3 and 2.4). Both products are derived from the original images. Every point in the DSM is characterized by a set of reliable features that help to discriminate buildings from other urban infrastructure and vegetation, as well as the intact buildings from the damaged ones.
The classification strategy consists of two steps:
1. The building regions are identified by considering the entire urban area with its context (urban classification - section 2.3). The goal is to identify four main classes, i.e. buildings,
roads/bare soil, low vegetation and high vegetation. More complicated models with higher number of classes are possible, but this falls out of the general goal of the paper. 2. The set of classes is extended to include intact building and
damaged building classes, i.e. 5 classes in total (building classification – section 2.4). The result of the previous step is used to fix the energy (Eq. 3) of the remaining classes to low values, while the energy of the new classes reflects the state of the newly computed features. In this fashion, the boundaries of the roads as well as low and high vegetation classes are propagated from the urban classification phase, while the building class is reclassified split into the intact or damaged building class. The presence of ruins close to
damaged buildings (but previously classified as ground) is therefore neglected in this implementation of the algorithm. The features of each step are merged together to form unary potential term of Eq. (3). For the binary potential a smoothness prior (Potts model) is imposed on the class labels. Inference is then performed with C++ implementation of the known –expansion graph cuts2.
2.3 Features for urban classification
The three 2D- and 3D-point features adopted for the urban classification stage are:
- Normalized Digital Surface Model (fnDSM). In order to provide a normalized DSM (nDSM= DSM – DTM), a digital terrain model is extracted from the photogrammetric DSM using the approach presented in (Nex and Remondino, 2012). This algorithm was developed for the processing of photogrammetric dense matching results and it is able to efficiently deal with the following issues: (i) ground height variations over a big region patch, (ii) presence of large buildings that impede the determination of correct ground height when too small DSM patches are considered and, (iii) presence of blunders or local noise that influence the determination of ground height values. The nDSM represents a valuable source of information about the height of each point. As suggested in (Gerke and Xiao, 2014; Lafarge and Mallet, 2012), the fnDSM values are linearly projected onto a [0,1] range. The higher the point is (building and high vegetation), the larger the feature value. On the other hand, low values of fnDSM identify ground and low vegetation classes.
- PNDVI (fPNDVI). In the absence of the NIR band, the PNDVI index is a valuable alternative to the NDVI. The attribute is computed as (Höhle, 2014):
red blue
blue red PNDVI
I
I
I
I
f
(4)High values of fPNDVI are expected for low/high vegetation classes. On the other hand, low values occur for building/ground classes.
- Slope index (fslope). The slope feature is computed as the maximum slope occurring in eight symmetrical directions (2 vertical, 2 horizontal, 4 diagonal) that leave each 3D-point. Low
fslope values (i.e. low slope) describe low vegetation, ground and building classes. High vegetation is characterized by high fslope values.
The aforementioned features (also referred to as factors) are merged together in the unary potentials of Eq. (3), according to the following expression:
(5)
2.4 Features for building classification
Prior to calculating the features for building classification, the photogrammetric DSM is segmented to establish boundaries of individual geometric entities (e.g. building’s roof). Based on criterion such as local curvature, local normal and distance between points, a region growing segmentation is performed. The repetitive spectral feature and the local planarity feature are computed for a 1m-radius neighbourhood. The two filters
2 http://vision.csd.uwo.ca/code/ (last accessed: 16 October 2014)
preserve the edges by intersecting the neighbourhood with the segmented geometries.
The three 2D- and 3D-point features adopted to classify buildings (damaged / intact) are:
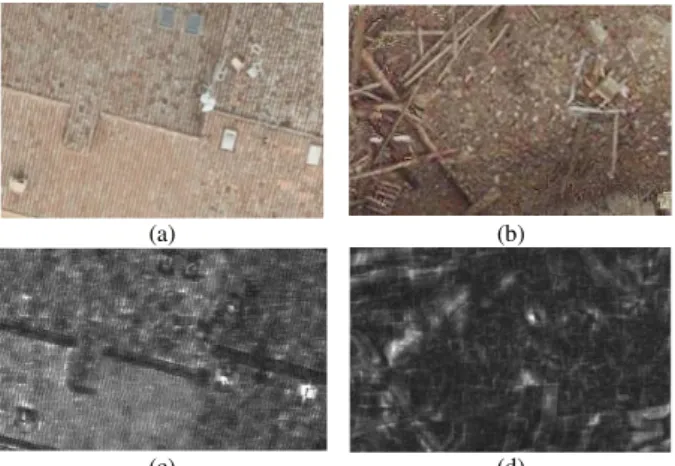
- Repetitive spectral feature (fspectral). Intact roofs are usually characterized by regular and repetitive textures (i.e. shingle roofs, see Fig. 1a) or by low textured surfaces (i.e. metal roofs). Brick roofs show spectral gradients locally higher in one direction while damaged roofs and collapsed buildings have random textures with chaotic spectral gradients variations (Fig. 1b). Low textured surfaces provide a low and ambiguous level of information caused by shadows, metal or painted surfaces.
(a) (b)
(c) (d)
Figure 1. Texture (a) and corresponding spectral feature (c) for a not-damaged roof; texture (b) and corresponding spectral feature (d) for a damaged roof.
Starting from these observations, the developed feature provides a description about the random spectral distribution of pixels (see Figure 1c and 1d). The fspectral, computed on the true orthophoto, is granted exclusively to well texturized areas, otherwise the factor takes the value 1. Initially, for each pixel the radiometric gradients along the eight symmetrical directions (2 vertical, 2 horizontal, 4 diagonal) are computed. For every pixel there exists a vector of eight gradient attributes, which is equivalent to eight 2D-matrices in the entire image. Next, the algorithm traverses the eight matrices, element by element, and derives eight new measures calculated as the sum of the gradients within a 5x5 window. These new measures likewise compose an eight-element vector of values for every pixel. The final index to indicate the spectral distribution is a ratio of the maximum and the minimum value within that vector (Gmax and
Gmin, respectively) as shown in Eq. 6:
where is a threshold value that is function of the images and scenario characteristics. Areas characterized by repetitive patterns show big differences between different gradient directions: very high values in the principal gradient direction are coupled with lower values in the other directions. On the contrary, in the randomly textured areas the gradient has approximately the same value in every direction.
Textures with Gmax lower than Th are considered to have too low texture to provide useful information, thus they are excluded. N is a parameter used to limit the ratio to a [0,1] range and here assumes the value of 0.2 (defined according to the performed tests). The texture feature to be added within the unary potentials of Eq. (3) is defined as:
{
(7)
- Size of the detected region (fsize). Intact roofs usually belong to bigger regions with regular shapes. Collapsed roofs and walls are fragmented and with irregular shapes. Thus, the ratio between the perimeter (P) and the area (A) serves as suitable measure to identify the region of collapsed buildings by penalizing small regions with uncompact shapes. The values of
fsize are given accordingly:
{
(8)
where N is a parameter to normalize the ratio on the [0,1] range and it ranges between 10 and 20 according to the dataset. Values of that exceeds 1 are stored as 1 in .
- Segment local planarity (fplanar). Roofs are characterized by planar surfaces, while collapsed buildings have irregular shapes, usually far from lying on a planar region. Local planarity is estimated for every 3D-point by collecting its neighbourhood and fitting a plane. The mean residual value Ri of all points adhering to the plane computation serves as the final feature. The residuals are linearly projected on [0,1] range according to the following equation:
{
(9)
Values higher than 4·GSD are marked as outliers and set to 1. Regions with less than 10 points are regarded as wrongfully matched and excluded from further analysis. The final feature takes the following form:
{
(10)
These three features are finally merged together in order to define the unary potentials of the energy function in Eq. (3):
(11)
3. EXPERIMENTS 3.1 Area of study and dataset
To evaluate the suggested approach for the automated detection of damaged buildings, the authors selected a dataset of aerial images taken after the Emilia-Romagna (Italy) earthquake. Two massive seismic events struck the area on May 20-29, 2012 and several tremors of different magnitude occurred in the following weeks. As a consequence, buildings, both historical and industrial, where seriously damaged along their roofs and façades.
Days after the first earthquake a number of aerial and satellite images were acquired over the destroyed areas. For the purpose of this research, aerial images over the town of San Felice sul Panaro (Modena, Italy) were processed. The images were collected with a Vexcel Ultracam XP with a 7 cm GSD and 80/40 overlap along-/across-track.
{
(6)
3.2 Experimental results
The images were elaborated using MicMac, an open-source set of routines for bundle block adjustment and dense image matching (Deseilligny and Clery, 2011; Pierrot-Deseilligny and Paparoditis, 2006). After the aerial triangulation, a 7 cm DSM and a true orthophoto at the same resolution were produced.
As expected, the generated DSMs present some noisy areas, especially around the collapsed buildings where significant depth variations and occlusions prevail. The noise is accordingly evident in artefacts on the true orthophotos. Two subareas of the entire dataset were chosen for evaluating the operation of classification. The first area (hereinafter termed “Area 1”) challenges the approach in dealing with historical buildings made of bricks, while the second area (hereinafter
called “Area 2”) is to examine the method’s performance in presence of modern and industrial buildings.
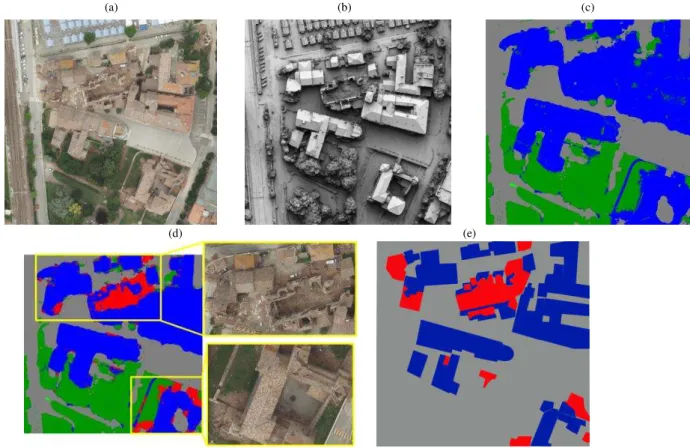
For Area 1 (Fig. 2), the size of the investigated area is 2500 by 2500 pixels. Figure 2b shows the extracted DSM while Figure 2c shows the urban classification result with all man-made structures correctly distinguished from other parts of the landscape. The successive building classification stage recognized all the major collapses (see close-up views in Fig. 2d) but is ineffective in spotting small changes when solely the building shingle is knocked while the roof frame (i.e. the roof structural elements) still stays in place. As these regions are small in size, the dense matching reconstruction smoothes the surface hence hiding the only discriminative clue of the damage. Some false positive are visible too, close to the building borders due to the noisy matching results. Such regions could be easily removed by setting a minimum dimension of a detectable damage.
(a) (b) (c)
(d) (e)
Figure 2: True orthophoto (a) generated from the extracted DSM (b) of Area 1. Results of the urban classification (c) with four classes: low vegetation (light green), high vegetation (dark green), ground (gray), building (blue). Automatically detected damaged buildings and the created classification map (d) - with close-up views on the original imagery: damaged (red), intact (blue). Manual identification of damaged / intact buildings (e).
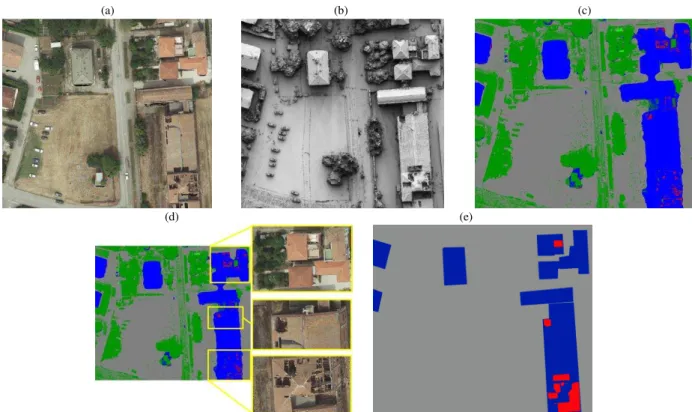
The second area (Area 2) is an industrial zone and the test region consists of 2200 by 2000 pixel. The outcome of the urban classification is presented in Figure 3. All the buildings are recovered nonetheless problems occur in noisy parts of the buildings that are misclassified as vegetation (green).
The results of the successive stage for damage detection (Fig.3d) are quite good although only the contours of the collapsed parts are usually spotted. The texture on buildings is less pronounced than in Area 1 and the repetitive spectral feature cannot significantly contribute to the discrimination of the collapsed areas. On the other hand, the information provided by the dense matching results allows the detection of the main collapsed areas on the roofs. False positive appear on flat roofs due to the presence of some bulky objects on its top that introduce the unflatness effect.
4. CONCLUSIONS AND OUTLOOK
The paper presented a methodology to automatically identify damages in buildings from high-resolution vertical aerial images. The methodology relies on sequential classification stages on height (DSM) and spectral (orthoimage) information derived from the available images. The methods has shown to provide satisfying results detecting big damages and completely collapsed building. The implemented features provide for evidences of non-planar and irregular surfaces as well as chaotic distribution of radiometric gradients. On the other hand, amendments are needed to cope with the detection of small damages on the roof surfaces.
The achieved results have also shown some classification problems due to incorrect image matching results. This will be The International Archives of the Photogrammetry, Remote Sensing and Spatial Information Sciences, Volume XL-1, 2014
(a) (b) (c)
(d) (e)
Figure 3: True orthophoto (a) generated from the extracted DSM (b) of Area 2. Results of the urban classification (c) with four classes: low vegetation (light green), high vegetation (dark green), ground (gray), building (blue). Automatically detected damaged buildings and the created classification map (d) - with close-up views on the original imagery: damaged (red), intact (blue). Manual identification of damaged / intact buildings (e).
solved considering oblique views which will allow to mitigate the occlusions issues and to verify the damages from a different perspective.
Finally, the proposed algorithm adopts a sequential process, that may cause an error propagation from the first step up to the final damage detection. In order to avoid this shortcoming, the future implementation will adopt a joint approach.
ACKNOWLEDGMENTS
This work was supported by RapidMap (http://rapidmap.fbk.eu), a CONCERT-Japan project, i.e. a European Union (EU) funded project in the International Cooperation Activities under the Capacities Programme the 7th Framework Programme for Research and Technology Development.
REFERENCES
Altan, O., Toz, G., Kulur, S., Seker, D., Volz, S., Fritsch, D. and Sester, M., 2001. Photogrammetry and geographic information systems for quick assessment, documentation and analysis of earthquakes. ISPRS Journal of Photogrammetry & Remote Sensing, 55(5-6), pp. 359-372.
Ardila, J. P., Tolpekin, V. A., Bijker, W. and Stein, A., 2011. Markov random-field-based super-resolution mapping for identification of urban trees in VHR images. ISPRS Journal of Photogrammetry and Remote Sensing, 66 (6), pp. 762-775.
Bartels, S.A. and VanRooyen, M.J., 2011. Medical complications associated with earthquakes. The Lancet, 379 (9817), pp. 748–757.
Bishop, C.M., 2006. Pattern recognition and machine learning. New York: Springer, pp. 740.
Bitelli, G., Camassi., R., Gusella., L. and Mognol, A., 2004. Image change detection on urban areas: the earthquake case. In:
The International Archive of Photogrammetry and Remote Sensing, 35 (B7), pp. 692-697.
Boykov, Y., Veksler, O. and Zabih, R., 2001. Fast approximate energy minimization via graph cuts. IEEE Transactions on Pattern Analysis and Machine Intelligence, 23(11), pp. 1222-1239.
Boykov, Y. and Kolmogorov, V., 2004. An experimental comparison of min-cut/max-flow algorithms for energy minimization in vision. IEEE Transactions on Pattern Analysis and Machine Intelligence, 26(9), pp. 1124-1137.
Clark, A. J., Holliday, P., Chau, R., Eisenberg, H., and Chau, M., 2010. Collaborative geospatial data as applied to disaster relief: Haiti 2010. Security Technology, Disaster Recovery and Business Continuity, Vol. 122, pp. 250-258.
Colomina, I., and Molina, P., 2014. Unmanned aerial systems for photogrammetry and remote sensing: A review. ISPRS Journal of Photogrammetry and Remote Sensing, Vol.92. 79-97.
Dell’Acqua, F. and Gamba, P., 2012. Remote Sensing and Earthquake Damage Assessment: Experiences, Limits, and Perspectives. Proc. IEEE, Vol. 100(10), pp. 2876-2890.
Dong, L. and Shan, J., 2013. A comprehensive review of earthquake-induced building damage detection with remote sensing techniques. ISPRS Journal of Photogrammetry and Remote Sensing, 84 (2013), pp. 85-99.
Estivill-Castro, V., 2002. Why so many clustering algorithms: a position paper. In: ACM SIGKDD Explorations Newsletter, 4(1), pp. 65-75.
Gerke, M. and Kerle, N., 2011. Automatic structural seismic damage assessment with airborne oblique pictometry imagery.
Photogrammetric Engineering and Remote Sensing, 77(9), pp. 885-898.
Gerke, M. and Xiao, J., 2014. Fusion of airborne laserscanning point clouds and images for supervised and unsupervised scene classification. ISPRS Journal of Photogrammetry and Remote Sensing, 87, pp. 78-92.
Guler, M.A. and M. Turker, 2004. Detection of the earthquake damaged buildings from post-event aerial photographs using perceptual grouping. In: The International Archives of Photogrammetry, Remote Sensing and Spatial Information Sciences, 35(B3), pp. 451-454.
Guo H.D., Lu, L.L, Ma, J.W., Pesaresi, M. and Yuan F.Y., 2009. An improved automatic detection method for earthquake-collapsed buildings from ADS40 image. In: Chinese Science Bulletin, 54 (18), pp. 3303-3307.
Haala, N., 2013. The landscape of dense image matching algorithms. In: Photogrammetric Week ‘13 (Ed. Fritsch, D.). Wichmann, Berlin/Offenbach, Germany, pp. 271–284.
Höhle, J., 2014. Automated Mapping of building facades by machine learning. In: The International Archives of Photogrammetry, Remote Sensing and Spatial Information Sciences, 40(3), pp.127-132.
Huyck, C.K., Adams, B.J., Cho, S., Chung, H.-C. and Eguchi, R.T., 2005. Towards rapid citywide damage mapping using neighborhood edge dissimilarities in very high-resolution optical satellite imagery – application to the 2003 Bam, Iran, earthquake. Earthquake Spectra, 21(S1), pp. 255-266.
Joyce, K.E., Belliss, S.E., Samsonov, S.V., McNeill, S.J. and Glassey, P.J., 2009. A review of the status of satellite remote sensing and image processing techniques for mapping natural hazards and disasters, Progress in Physical Geography, 33(2):183-207.
Kerle, N., Heuel, S. and Pfeifer, N., 2008. Real-time data collection and information generation using airborne sensors. In: Geospatial Information Technology for Emergency Response (Ed.. Zlatanova, S. and Li, J.), London: Taylor & Francis, pp. 43-74.
Kumar, S. and Hebert, M., 2006. Discriminative random fields.
International Journal of Computer Vision, 68(2), pp. 179-201.
Lafarge, F. and Mallet, C., 2012. Creating large-scale city models from 3D-point clouds: a robust approach with hybrid representation. International Journal of Computer Vision, 99(1), pp. 69-85.
Li, S.Z., 2009. Markov random field modeling in image analysis. Advances in Computer Vision and Pattern Recognition. Springer, London.
Nex, F. and Remondino, F., 2012. Automatic roof outlines reconstruction from photogrammetric DSM. In: ISPRS Annals of the Photogrammetry, Remote Sensing and Spatial Information Sciences, I(3), pp. 257-262.
Nex F. and Remondino, F., 2013. UAV for 3D mapping applications: a review. Applied Geomatics, Vol. 6(1), pp. 1-15
Pierrot-Deseilligny, M. and Clery, I., 2011. APERO - Open source bundle adjustment software for automatic calibration and orientation of a set of images. In: The International Archives of Photogrammetry, Remote Sensing and Spatial Information Sciences, 38(5/W16), pp. 269-277.
Pierrot-Deseilligny, M. and Paparoditis, N., 2006. A multiresolution and optimization - based image matching approach: An application to surface reconstruction from SPOT 5 - HRS stereo imagery. In: The International Archives of Photogrammetry, Remote Sensing and Spatial Information Sciences, 36(1/W41).
Rathje, E.M., Crawford, M., Woo, K. and Neuenschwander, A., 2005. Damage patterns from satellite images of the 2003 Bam, Iran, Earthquake. Earthquake Spectra, 21(1), 295-307.
Remondino, F., Spera, M.G., Nocerino, E., Menna, F. and Nex, F., 2014. State of the art in high density image matching. The Photogrammetric Record, 29(146), pp. 144-166.
Rezaeian, M. and Gruen, A., 2011. Automatic 3D building extraction from aerial and space images for earthquake risk management. Georisk: Assessment and Management of Risk for Engineered Systems and Geohazards, 5(1): 77-96.
Samadzadegan, F. and Rastiveisi, H., 2008. Automatic detection and classification of damaged buildings, using high resolution satellite imagery and vector data. In: The International Archives of the Photogrammetry, Remote Sensing and Spatial Information Sciences, 37(B8), pp. 415-420.
Schindler, K., 2012. An overview and comparison of smooth labeling methods for land-cover classification. IEEE Transactions on Geoscience and Remote Sensing, 50(11), pp. 4534-4545.
Schweier, C. and Markus, M., 2006. Classification of collapsed buildings for fast damage and loss assessment. In: Bulletin of Earthquake Engineering, 4, pp. 177-192.
Sirmacek, B. and Unsalan, C., 2009. Damaged building detection in aerial images using shadow information. In:
Proceedings of the 4th International Conference on Recent Advances in Space Technologies, pp. 249-252.
Tomowski, D., Klonus, S., Ehlers, M., Michel, U. and Reinartz, P., 2010. Change visualization through a texture-based analysis approach for disaster applications. In: ISPRS Technical Commission VII Symposium – 100 Years ISPRS Advancing Remote Sensing Science Sensing Proceedings, 38(7A), pp. 263-268.
Yamazaki, F., Suzuki, D. and Maruyama, Y., 2008. Detection of damages due to earthquakes using digital aerial images. In: 6th International Workshop on Remote Sensing for Disaster Applications, Pavia, Italy.