of Chemical
Engineering
ISSN 0104-6632 Printed in Brazil www.scielo.br/bjce
Vol. 35, No. 03, pp. 1019-1028, July - September, 2018 dx.doi.org/10.1590/0104-6632.20180353s20170178
SIMULATION OF A DIRECT REDUCTION MOVING
BED REACTOR USING A THREE INTERFACE
MODEL
A. Mirzajani
1, H. Ale Ebrahim
1and S.M.M. Nouri
2,*
1 Chemical Engineering Department, Petrochemical Center of Excellence,AmirKabir University of Technology, Tehran 15875-4413, Iran
2 Chemical Engineering Department, Hakim Sabzevari University, Sabzevar, Iran
(Submitted: April 2, 2017; Revised: July 17, 2017; Accepted: August 30, 2017)
Abstract - In the present study, the rate of reduction in the direct reduction moving bed reactor of a MIDREX plant has been studied. The reactor was modeled by a one-dimensional, nonisothermal, steady-state model. The three interface unreacted shrinking core model accounting for different iron oxides reduction was used for describing the reaction behaviors at the pellet scale. The quasi steady state assumption was used to calculate the gas species concentrations at the interfaces. The effects of external and internal mass transfer resistance through the pellets and heat transfer on the overall rate of reduction were considered. The results of the model were validated with the data of the Khorasan Steel plant (Neyshabur, Iran). The model results show good agreement with the plant data. The effect of gas and solid flow rates, feed gas properties, and pellet characteristics on the reactor performance were investigated using the model.
Keywords: Simulation, Direct reduction, Moving-bed reactor, Unreacted shrinking core model, Three interface model.
INTRODUCTION
Direct reduction of hematite with synthesis gas as the reducing agent is a well-established process for the production of solid iron with considerably low greenhouse emission (Kim and Worrell, 2002). The world direct reduced iron (DRI) production has increased from 790 kt/yr in 1970 to 74.55 Mt/yr in 2014. Iran is the second largest producer of sponge iron in the world (14.55 Mt/yr), mostly using the MIDREX process for iron production (Pineau et al., 2006) (MIDREX, 2014).
The direct reduction reactor is a moving-bed reactor in which pellets are loaded at the top of the bed and move countercurrent to the reducing gas,
which is injected at the bottom. The sponge iron is removed as product at the bottom.
The iron oxide is reduced to sponge iron via the following reactions:
(1)
(2)
(3)
(4)
*Corresponding author. E-mail address: m.nouri@hsu.ac.ir
Fe O
CO
Fe O
CO
3
2 3+
"
2
3 4+
2Fe O3 4+CO" 3FeO+CO2
FeO
+
CO
"
Fe
+
CO
2Fe O
H
Fe O
H O
(5)
(6)
Direct reduction has been investigated for three
decades and different mathematical models were
introduced in order to predict the reaction behavior. Direct reduction is a complex phenomenon in which
many parameters have influence on the reaction
behavior. It is neither possible nor necessary to consider all the parameters in the mathematical model. So, all the models developed up to now have used some simplifying assumptions and neglected the parameters which have less importance in the reduction reactor.
Almost all of the models developed for the direct reduction reaction neglected the accumulation term and assumed that the reaction is pseudo steady state (Beheshti et al., 2014; Negri et al., 1991; Nouri et al., 2011; Parisi and Laborde, 2004; J Szekely and El-Tawil, 1976; Tsay et al., 1976; Mohammad Sadegh Valipour and Saboohi, 2007). Among the mathematical models applied to the iron ore reduction, the shrinking core model has been used in most of the works, which assumes that there is a sharp interface between the reacted and unreacted zones (Beheshti et al., 2014; Negri et al., 1991; Parisi and Laborde, 2004). Also, most of the researches to date tended to focus on the pellet scale and pilot scale modeling rather than an industrial reactor (Nouri et al., 2011; Parisi and Laborde, 2004). Moreover, research on the subject has been mostly restricted to the pure reducing gases as the reducing agents (H2 or CO or a mixture of H2 and CO)
and the effect of real gas conditions were neglected
(Hou et al., 2015; Jozwiak et al., 2007; Monazam et al., 2014; Negri et al., 1991; M. S. Valipour et al., 2006). Considering global reduction reaction rates (hematite to metallic iron) is another simplifying assumption used by some researchers (Nouri et al., 2011; Parisi and Laborde, 2004). This actually assumes that the reduction of hematite to iron has just one controlling step and the kinetic constant of this step was used for the overall reaction. Other researchers also neglected some controlling steps such as external mass transfer of gas reactants to the pellet surface (Beheshti et al.,
2014), diffusion of gas reactant through the pores
inside the pellet and the iron oxides to the reaction surface (Hou et al., 2015).
In this work, the industrial direct reduction reactor of the Khorasan Steel plant was modeled using a mathematically simple but accurate model. Also the
effects of operating parameters such as gas and solid
flow rates, H2/CO ratio, reducing gas potential, and pellet size on the reactor performance have been studied.
MATHEMATICAL MODELING
Pellet scale
A three interface model (hematite/magnetite, magnetite/wustite, and wustite/iron) based on the unreacted shrinking core model has been developed for the prediction of pellet behavior in the direct reduction reactor. The model assumptions are as follow:
1) The hematite pellets are non-porous. 2) The reactions are reversible.
3) The pellets reacted at three sharp interfaces (hematite/magnetite, magnetite/wustite, and wustite/iron) with reducing gases.
4) The pellet diameter remains constant during the reaction.
5) The side reactions between the gaseous species are neglected.
The reaction rates of different iron oxides with
reducing gases at each interface determine how the radius of the interfaces changes during the reduction.
The key step in the use of the three-interface unreacted shrinking core model is the calculation of reducing gases concentrations (H2 and CO) and also the produced gases concentrations (H2O and CO2) at each interface using the quasi steady state assumption
as follows (Bischoff, 1963; Q. T. Tsay et al., 1976):
(7)
(8)
(9)
Equations for calculation of Ωi can be found
elsewhere (Q. T. Tsay et al., 1976) . Equations (7) and
(8) show the concentrations of hydrogen and carbon
FeO
+
H
2"
Fe
+
H O
2C C
R R
k k k
R R R R 1 , , , , , , A w Fe A b
C F A S AFe
ew Fe em w eh m d F A S AFe F A S AFe
$ X X = -+ + + + + -- - -R T SS SS
SSS " " #
V X WW WW WWW % % C
k k k C
C Ab e w Fe e m w e h m D B b
$#X - - X-
-V X WW WW WWW & C C
R k Rk
R 1 , , , A m w A w Fe
a S A w
e m w
e h m b S B
w S Aw
$ X X = -+ + - --
-#
&
#C
k k
C a Aw Fe
e m w
eh m b B
w Fe
$ X - - X-
-#
&
& C C R R k R R C k C , , , A h m A m w S A m j h m e h m S B m S AmA m w
eh m B m w $ = -+ + --
-#
&
# &monoxide at the wustite/iron interface and magnetite/ wustite interface, respectively. Also equation (9) shows the concentration of these gaseous species at the hematite/magnetite interface (concentration at the unreacted core). The following superscripts represent the various iron oxides: hematite/magnetite (h-m), magnetite/wustite (m-w), and wustite /iron (w-Fe). Equations (10)-(12) show the concentration of product
gases (Q. T. Tsay et al., 1976).
(10)
(11)
(12)
The diffusion of hydrogen and carbon monoxide into the pellets is affected by several resistances from
the bulk gas to each reaction interface.
The mass transfer resistance for all gaseous species from the bulk gas to the outer surface of the pellets is
expressed by equation (13). The diffusion resistance
between the porous iron surface and the iron/ wustite interface is presented in equation (14). The
diffusion resistance between the wustite/magnetite
and magnetite/hematite interfaces can be stated by equations (15) and (16) respectively. Also the reaction resistances at each interface are presented in equation (17). (13) (14) (15) (16) (17)
Reactor scale modeling
The reactor investigated in this study is a typical direct reactor of a MIDREX plant. The iron oxide pellets are loaded at the top of the reactor and move downward. The reduction process is accomplished
by the upward reducing gases through the iron oxide pellets by reactions (1)-(6).
The following assumptions have been considered for derivation of the mass and energy balance equations:
1) The gas and solid phases are in plug flow and
also axial and radial dispersions are negligible.
2) The gas flow is uniform radially.
3) Gas mixture is ideal.
4) The reduction reactor is at steady state condition.
5) All the reactions are first order and reversible.
Considering these assumptions, the mass balance equations for the gas phase are expressed by equations (18) and (19). These equations represent variations of reducing gas concentration along the reactor.
(18)
(19)
Equation (20) describes the interface position of the pellets at any point of the reactor (Tsay et al., 1976).
(20)
The reaction rate at each interface of the pellet is the sum of both reducing gas reaction rates with various iron oxides at the interface.
Energy balance for the gas and solid phases can be written as follows (Nouri et al., 2011):
(21)
(22)
The physical properties of the solid phase such as porosity, heat capacity and density change from the top to the bottom of the reactor. Therefore, these properties should be calculated along the reactor.
The volumetric heat capacity of the pellets presented in equation (23) is a function of physical and chemical properties of each solid layer (hematite, magnetite, wustite, and iron) (Tsay et al., 1976).
(23) C C R R R R C C , , , , B w Fe B b
F A S A Fe F B S B
Fe A b A w Fe $ = + ++
-- # & ! - $
C C RR C C
, , Bm w Bw Fe
S Aw S B w
Aw Fe Am w $
= +
-- - # & ! - -$
C C R R C C , , B h m B m w S A m S Bm
A m w A h w $ = +
-- - # & ! - -$
. R
k r
R T
j A B
4
, , f j
m j p g s 2 r = = R D R T r r r r 4 , , s jFe
eff jFe g s
w Fe p p w Fe $ r
= -
-R, R TD 4r r rr ,
s j w
eff jw g s
m w w Fe w Fe m w $ r
= --
--
-R R TD
r r
r r
4
, , s jm
eff jm g s
h m m w m w h w $ r = -- -- -R k r R T 4 , , j i t s
r it s t s g s 2 r =
-- Q V
-dz dc
G
c R R R
CO t h m
COh m m w COm w w Fe COw Fe
z z z
=- " - - + - - + - - %
dz dc
G c
R R R
H t h m H
h m m w H
m w w Fe H w Fe 2
2 2 2
z z z
=- - - + - - + -
-" %
dz dr
u K C k
c 1 1 , , t s
r t s t s r CO t s CO t s e CO t s CO t s 2 $
t z f
=-- - + --
-Q V # T Y
K, C ck
, r H
t s H t s
e Ht s H Ot s
2 2 2 2 + - - -T
Y Y&
dz dT GC h a T T g ps c s g s $
= - " - %
dz dT
u c
h a T T
u c
1 1
1 s
b s ps c s
g s
b s ps
$ $ $
f t f t
=Q - V Q - V+Q - V
/
H R , s i t s i t s t s
i CO H2 D
-
-=
/
/
C C rr C r r r
C r r r C rr
1 1
1 1 1
s ps h ph h p h m
m pm m
p m w h w
w pw w
p w Fe m w
Fe pFe Fe p w Fe 3 3 3 3 3 3 3 3 3
t t f t f
t f t f
Reaction rate equation
In the three interface model, the reduction rates of
iron oxides in the different reaction steps (hematite to
magnetite, magnetite to wustite, and wustite to iron) can be calculated as follows (Tsay et al., 1976):
(24)
Subscript A indicates the reducing gases hydrogen and carbon monoxide and t-s is related to different interfaces within the pellets.
Boundary conditions for the mass and energy balances along the reactor are as follows:
At the solid inlet (top):
(25)
(26)
(27)
(28)
At the gas inlet (bottom):
(29)
(30)
(31)
Combination of the pellet and reactor scale
equations leads to seven ordinary differential equations.
The Runge-Kutta method was used to solve the mass and energy balance equations and the boundary value problem was reduced to an initial value problem using the shooting method (Dormand and Prince, 1980). In
the shooting method, we first guessed three missing
boundary conditions at the top of the reactor and
solved the differential equations with these initial
boundary conditions using the Runge-Kutta method. Then the resulting boundary conditions at the bottom
of the reactor were compared with actual fixed values
(temperature and concentration of gas phase) and, by changing the assumed initial boundary conditions,
repeated the above steps again until these values were approximately equal within a given tolerance.
Parameter calculation
Porosity
The intermediate solid products (magnetite, wustite, and iron) are porous; therefore, assuming no volume change of pellets along the reactor, the following equations were used to calculate the porosity of solids (Tsay et al., 1976):
(32)
(33)
(34)
The porosity of different oxides and metallic iron
can be seen in Table 2.
Diffusion coefficients
The effective diffusivity of gas reactants through
the solid pores can be obtained as follows:
(35)
where DAM is the molecular diffusivity, which was estimated from the Slattery and Bird equation (Bird et al., 2007) and DAK is the Knudsen diffusivity, calculated as (J. Szekely et al., 1976):
(36)
Heat and mass transfer coefficients
The following empirical equation was used for
calculation of the heat transfer coefficient between
the gas and the solid pellets in a moving bed reactor (Akiyama et al., 1993):
(37)
The mass transfer coefficient was obtained using
the analogy between heat and mass transfer.
(38) R
r r K C K
C 3 1
, A
t s p
b t s t s r t s
A t s
e A t s Bt s 3
2
$ f
z
= -
-- - - -
-Q V Q V T Y
rh m z 0 r
p
= =
- Q V
rm w z 0 r
p
= =
- Q V
rw Fe z 0 r
p
= =
- Q V
T zsQ =0V=Ts0
CH z L CH
0
2Q = V= 2
CCO z L CCO
0
= =
Q V
T zg L Tg
0
= =
Q V
1 1 2
Fe h
Fe h f = -Q -fVtt
1 1 2
w h
w h f = -Q -fVtt
1 1 32
m h
m h f = -Q -fV tt
D D D
1 1 1 1
e0 0 AM AK 2
f
= T + Y
D 9700 2S MT
. AK
w 0
0 0 5
# f
= T Y
. Re Pr
Nu 2 0 39 p
1 2 1 3
= +
. Re
Sh 2 0 39 p Scj
1 2 1 3
Activation energy, rate constant and equilibrium constant
The kinetic data proposed by (Takenaka et al., 1986) was used in this work. The Arrhenius relation is used in order to calculate the rate constants for the reduction reactions. Frequency factors, activation energies and equilibrium constants for the reactions are listed in Table 1.
RESULTS AND DISCUSSION
In this section, the model developed was validated using reduction reactor data of the Foolad Khorasan plant (Neyshabur, Iran). Then, the model was used to
predict the reactor behavior for different operational
conditions. The operational conditions of the industrial plant are shown in Table 2.
A comparison between the results of the mathematical model and the plant data are listed in Table 3. As can be seen, deviations of the model results from the plant data are negligible.
Figure 1 presents the variation of gas and solid temperatures along the reactor. It is obvious that the both solid and gas temperatures increase from the top to the bottom of the reactor. Due to the heat that the reduction reactions release and absorb on the surface of iron oxides pellets, the temperatures of the solid and gas phases are equal in the bottom of the reactor. Since most of the endothermic reactions happen in the top half of the reactor, the decrease of the gas temperature is considerable in this section. The bold points are the boundary temperatures of the reactor (at the top and bottom of the reactor).
The variations of gas composition along the reactor can be seen in Figure 2. The reducing gas contains hydrogen, carbon monoxide, water vapor, carbon dioxide and inert gases. As the reaction proceeds and the reducing gases move upward in the reactor, the concentrations of hydrogen and carbon monoxide decrease and the concentrations of product gases
Table 1. Frequency factors, activation energies and equilibrium constants of reactions (Takenaka et al., 1986).
Reactions K0 (cm/s) Ea(J/mol) Ke=A exp(B/T)
A B
16000 92092 30761 -362.6
2300 71162 4722 -7916.6
3000 63627 2.54 1586.9
270000 113859 51.42 968.37
2500 73674 7942.64 -3585.6
1700 69488 0.053 2744.6
Table 2. Operating conditions of the Khorasan plant.
Gas
Gas flow rate 170000 Nm3/h
H2 54.43
CO 34.51
H2O 4.82
CO2 3.38
CH4+N2 3.84
Inlet temperature 1193 K
Solid
Production (Fe) 110 ton/h
Mineral pellet density 4.1 g/cm3 Sponge iron density 3.1 g/cm3
Pellet radius(r0) 0.5 cm
Porosity H M W Fe
0.204 0.232 0.364 0.635
Reactor
reaction zone length 1000 cm
Diameter 560 cm
(water vapor and carbon dioxide) increase. The bold points show the mole fractions of output gases at the top of the Khorasan plant.
There is a difference between the solid conversion profiles developed by this model and some previous
published works (Nouri et al., 2011; Parisi and
Laborde, 2004). As can be seen in Figure 3, in the first
two meters of the reactor, the solid conversion curve shows slight change and after that, it rises relatively
fast to its final value. But for other models, the trends steadily rise for the first 6 meters of the reactor and
the rates slow down gradually after that. This may be
explained by the methods used by the different models for defining the conversion equation. In this work, the solid conversion was defined as the amount of
wustite layers reduced to metallic iron and, since the hematite layers at the top of the reactor were reduced
to magnetite first, the solid conversion in that area
Taknaka confirmed that the overall rate of reduction
decreases upon increasing the ratio of hydrogen to carbon monoxide (Takenaka et al., 1986). This result is likely to be related to the heat of reduction of H2 and CO with iron oxides. The majority of the reduction reactions with hydrogen are endothermic. Therefore, with increasing hydrogen concentration, the portion of reduction reactions with hydrogen increases which result in a decrease in the reactor temperature and overall reduction rates. On the other hand, the majority of reduction reactions with carbon monoxide are exothermic, and the solid conversion rate increases with increasing carbon monoxide concentration in the feed gas due to the increase in the reactor temperature and consequently the rate of reduction reactions.
It should be noted that, if the concentration of carbon monoxide is greater than the hydrogen concentration in the feed gas, the possibility of coke deposition on the sponge iron increases, which leads to a decrease in the reduction rate due to increasing
diffusional resistances. So, the H2/CO ratio is usually greater than one.
Table 3. Comparison between the model results and plant data.
Outlet gas composition Model data (dry base) (%) Foolad Khorasan data (dry base) (%)
Hydrogen 48.73 45 ± 2
Carbon monoxide 24.3 23.8 ± 1
Carbon dioxide 21.2 23.1 ± 1.2
Nitrogen and Methane 5.77 5.7 ± 0.8
Solid conversion 94.14 93.7 ± 1
Gas outlet temperature 580 k 620 k
Figure 1. Temperature profiles of the gas and solid along the
reactor calculated by the model (the dots on the temperature axis are the solid and gas input temperature).
Figure 2. Composition profiles of gases along the reactor (points
below and above H2 •, H2O ♦, CO and CO2 ○; composition lines show the outlet gas composition of the reactor).
in the constant increase of solid conversion in the solid inlet section.
Effect of feed gas composition
Figure 4 shows the effect of feed gas composition
on the solid conversion. The experimental results of
Figure 3. Comparison between the solid conversion profiles
Effect of feed gas potential
The gas potential is defined as the ratio of hydrogen
and carbon monoxide concentration to water vapor and carbon dioxide concentrations or (H2+CO)/ (H2O+CO2). In the direct reduction processes, this parameter depends on the reformer operating conditions, that usually change within 5-49 (Takenaka et al., 1986). It can be seen in Figure 5 that the reduction decreases for lower gas potential due to the decrease in the reducing gas concentrations.
Effect of pellet size
Figure (6) shows the effect of pellet size on the solid
conversion. As the pellet size decreases, the active surface exposed to the reducing gases increases. So, the
diffusion path within the pellet decreases and the solid
conversion increases respectively. It should be noted that, in this case, the gas phase pressure drop along the reactor will increase considerably. Previous researches show that the pressure drop is inversely proportional to the cubed value of the bed void fraction and void fraction increases with pellet size (Afandizadeh and Foumeny, 2001; Brunner et al., 2015).
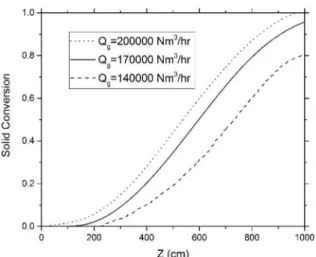
Effect of gas flow rate
The effect of gas flow rate on the solid conversion is presented in figure (7). As the gas flow rate is
increased, the concentration of reducing gases and the gas velocity are increased. So, Reynolds number,
heat and mass transfer coefficients are consequently
increased according to equations (37) and (38).
Increasing the mass transfer coefficient between the
bulk gas and the pellet surface results in an increase in the concentration of reducing gases on the pellet
surface, which decreases the effect of mass transfer on
the overall rate of reaction. Also with increasing heat
transfer coefficient, the solid temperature rises, leading
to an increase in the reaction rate and solid conversion.
CONCLUSIONS
The purpose of the current study was to investigate the behavior of an industrial direct reduction reactor using a relatively simple mathematical model. A model based on the three interface unreacted shrinking core model at the pellet scale, combined with mass and energy balances for the reactor, has been developed in this work.
Figure 4. Effect of the reducing gases ratio on the solid conversion
calculated by the model.
Figure 5. Effect of gas potential on the solid conversion calculated
by the model.
Figure 6. Effect of pellet size on the solid conversion calculated
The results of this study confirm that the direct
reduction reactor behavior can be predicted with considerably high precision using the model.
This study has shown that the pellet size and gas
flow rate exert the most important effects on the
conversion of iron oxide. A limitation of this study is that most of the industrial data are available only for the top and bottom of the reactor and not along the reactor. So, the validity of the model could not be compared throughout the reactor.
ACKNOWLEDGMENT
We would like to show our gratitude to the Foolad Khorasan Company for the contribution of the plant data.
NOMENCLATURE
A related to hydrogen and carbon monoxide (mol/cm3)
as total pellet surface area per unit bed volume (cm2/cm3)
B related to water vapor and carbon dioxide (mol/cm3)
Ct total concentration of inlet gas (mol/cm3)
CAt-s concentration of gas component A at the interface t-s
(mol/cm3)
CBt-s concentration of gas component B at the interface t-s
(mol/cm3)
CP heat capacity (J/mol.k)
Cih-m concentration of gas component i at the interface
h-m(mol/cm3)
Cim-w concentration of gas component i at the interface m-w
(mol/cm3)
Ciw-f concentration of gas component i at the interface
w-f (mol/cm3)
CiB concentration of gas component i in bulk phase
(mol/cm3)
Deff effective diffusivity (cm2/s)
Dij binary diffusivity (cm2/s)
Dim diffusivity of component i in multi component system (cm2/s)
E activation energy (J/mol)
G molar flow of gas phase (mol/cm2s)
hc heat transfer coefficient (W/K.cm2)
Kr,At-s specific rate constant for reaction from t to s
species(cm/s)
Ket-s equilibrium constant for reaction from t to s species
km heat transfer coefficient (cm/s) Mw Molecular weight (g/mol)
Nu, Re Nusselt and Reynolds numbers, respectively Sc, Sh Schmidt and Sherwood numbers, respectively
rt-s radius of interface between t and s species (cm)
RAt-s reaction rate from t to s per unit volume of bed
(mol/cm3s)
Rg gas constant rp pellet radius (cm)
Ts ,Tg solid and gas phase temperatures (K) t-s related to various interfaces h-m, m-w, w-Fe us , ug gas and solid velocity (cm/s)
Z distance from the top of the bed (cm)
Greek letters
ρt true molar density of t species (mol/cm3)
ρrs , ρps true molar density of reactant and product solids (mol/cm3)
τ tortuosity factor
φt-s oxygen density change from t to s species,
φh-m=0.333, φm-w =0.832, φw-Fe=1 (atm O/mol t))
εb void fraction of the bed
εt void fraction of t phase
∆H heat of reaction (J/mol)
Subscripts
h hematite m magnetite w wustite Fe iron
REFERENCES
Afandizadeh, S., and Foumeny, E. A. Design of packed bed reactors: guides to catalyst shape, size, and loading selection, Appl. Therm. Eng., 21, No 6), 669-682 (2001).
Figure 7. Effect of gas flow rate on the conversion of iron ore
Akiyama, Tomohiro, Takahashi, Reijiro, and Yagi, Jun-ichiro.. Measurements of heat transfer
coefficients between gas and particles for a single
sphere and for moving beds, ISIJ. Int., 33, No 6), 703-710 (1993).
Beheshti, Reza, Moosberg-Bustnes, John, and Aune, Ragnhild E. Modeling and simulation of isothermal reduction of a single hematite pellet in gas mixtures of H2 and CO. Paper presented at the 143rd Annual Meeting and Exhibition, TMS 2014, San Diego, CA; United States (2014)
Bird, R.B., Stewart, W.E., and Lightfoot, E.N. Transport phenomena (Revised 2 ed.). Wiley, New York (2007)
Bischoff, K. B. Accuracy of the pseudo steady state approximation for moving boundary diffusion
problems, Chem. Eng. Sci., 18, No 11), 711-713 (1963).
Brunner, Kyle M., Perez, Hector D., Peguin, Robson P. S., Duncan, Joshua C., Harrison, Luke D., Bartholomew, Calvin H., and Hecker, William
C.. Effects of Particle Size and Shape on the
Performance of a Trickle Fixed-Bed Recycle Reactor for Fischer-Tropsch Synthesis, Ind. Eng. Chem. Res., 54, No 11), 2902-2909 (2015).
Dormand, J. R., and Prince, P. J. A family of embedded Runge-Kutta formulae, J. Comp. Appl. Math., 6, No 1), 19-26 (1980).
Hou, B., Zhang, H., Li, H., and Zhu, Q. . Determination
of the intrinsic kinetics of iron oxide reduced by
carbon monoxide in an isothermal differential
micro-packed bed, Chinese. J. Chem. Eng., 23, No 6), 974-980 (2015).
Jozwiak, W. K., Kaczmarek, E., Maniecki, T. P., Ignaczak, W., and Maniukiewicz, W. Reduction behavior of iron oxides in hydrogen and carbon monoxide atmospheres, Appl. Catal. A-Gen., 326, No 1, 17-27 (2007).
Kim, Y., and Worrell, E. International comparison of CO2 emission trends in the iron and steel industry, Energ. Policy., 30, No 10), 827-838 (2002).
MIDREX, R&D. (2014). 2014 world direct production statistics.
Monazam, E. R., Breault, R. W., and Siriwardane, R. Reduction of hematite (Fe2O3) to wüstite (FeO) by carbon monoxide (CO) for chemical looping combustion, Chem. Eng. J., 242, No 1, 204-210 (2014).
Negri, E.D., Alfano, O.M., and Chiovetta, M.G. . Direct reduction of hematite in a moving-bed reactor. Analysis of the water gas shift reaction
effects on the reactor behavior, Ind. Eng. Chem.
Res., 30, No 3, 474-482 (1991).
Nouri, S. M. M., Ale Ebrahim, H., and Jamshidi, E. Simulation of direct reduction reactor by the grain model, Chem. Eng. J., 166, No 2, 704-709 (2011). Parisi, D. R., and Laborde, M. A. Modeling of counter
current moving bed gas-solid reactor used in direct reduction of iron ore, Chem. Eng. J., 104, No 1-3, 35-43 (2004).
Pineau, A., Kanari, N., and Gaballah, I. Kinetics of reduction of iron oxides by H2: Part I: Low temperature reduction of hematite, Thermochim. Acta., 447, No 1), 89-100 (2006).
Szekely, J, and El-Tawil, Y. The reduction of hematite pellets with carbon monoxide-hydrogen mixtures, Metall. Mater. Trans. B., 7, No 3), 490-492 (1976).. Szekely, J., Evans, J.W., and Sohn, H.Y. Gas-solid
reactions (Vol. 66). Academic Press New York, (1976)
Takenaka, Y., Kimura, Y., Narita, K., and Kaneko, D. Mathematical model of direct reduction shaft furnace and its application to actual operations of a model plant, Comput. Chem. Eng., 10, No 1), 67-75 (1986)..
Tsay, Q. T., Ray, W. H., and Szekely, J. The modeling
of hematite reduction with hydrogen plus carbon monoxide mixtures: Part I. The behavior of single pellets, AIChE J., 22, No 6, 1064-1072 (1976).
Tsay, Q.T., Ray, W. H, and Szekely, J. The modeling
of hematite reduction with hydrogen plus carbon monoxide mixtures: Part II. The direct reduction process in a shaft furnace arrangement, AIChE. J., 22, No 6), 1072-1079 (1976).
Valipour, M. S., Motamed Hashemi, M. Y., and Saboohi, Y. . Mathematical modeling of the reaction in an iron ore pellet using a mixture of hydrogen, water vapor, carbon monoxide and carbon dioxide: an isothermal study, Adv. Powder. Technol, 17, No 3), 277-295 (2006).
Valipour, M. S., and Saboohi, Y. . Modeling of multiple noncatalytic gas-solid reactions in a moving bed
of porous pellets based on finite volume method,