Andreia Marisa da Silva Fortuna
Licenciada em Bioquímica
Gold nanoprobes for assessing
expression of critical genes in the
infection pathway of MRSA
Dissertação para obtenção do Grau de Mestre em
Biotecnologia
Orientador: Prof. Doutora Rita Gonçalves Sobral, FCT/UNL
Co-orientador: Prof. Doutor Pedro Viana Baptista, FCT/UNL
Júri:
Presidente: Prof. Doutora Ana Cecília Afonso Roque Arguente: Doutora Teresa Conceição
Vogal: Prof. Doutora Rita Gonçalves Sobral
iii Gold nanoprobes for assessing expression of critical genes in the infection pathway of MRSA
Copyright em nome de Andreia Marisa da Silva Fortuna e da FCT, UNL.
v My master thesis allowed me to contribute to this following publication:
vii
Acknowledgments
I could not have performed this work without the help of several people and the support from the institution that contributed to its success. In this regard, I would like to thank all of those who in one way or another helped me whenever I needed during the course of this project.
First of all I would like to thank all the teachers that contributed to my academic path and the Institution, Faculdade de Ciências e Tecnologia da Universidade Nova de Lisboa, that provided me with the facilities and conditions, crucial for my learning process.
I want to express my gratitude to my supervisors, Prof. Rita Sobral and Prof. Pedro Viana Baptista: for all the opportunities they have given me; for having received me in their laboratories; for sharing knowledge; for scientific guidance and for calling me attention; for their patience and support.
I have to extend my gratitude to all my laboratory colleagues: Ana Bárbara Carreira, Ana Sofia Matias, Bárbara Gonçalves, Bruno Veigas, Fábio Carlos, Joana Silva, João Jesus, Letícia Giestas, Miguel Larguinho, Milton Cordeiro, Pedro Pedrosa, Rafaela Canto, Raquel Portela, Raquel Vinhas, Rita Cabral, Sara Figueiredo. I would like to thank you all: for the support, the advices and suggestions; for the availability, the encouragement and the guidance in the laboratory; for all the laughs and good moments.
A special acknowledgement to my colleagues and friends Ana Bárbara Carreira and Rafaela Canto: thank you for your unconditional support and strength given throughout this year.
To all my closest friends who have always supported and encouraged me, I am very grateful to them for being there whenever I needed them, for the advices given, the patience and for all the joys.
A special acknowledgement to Fernando Gonçalves for the motivation given and for believing in me.
Finally, I am immensely grateful to my family, specially my parents and brother for the love, unconditional support, comprehension, patience and for never doubting me.
ix
Resumo
Staphylococcus aureus é um agente patogénico oportunista clinicamente relevante responsável por uma enorme variedade de doenças, desde situações ligeiras até às que envolvem risco de vida. S. aureus pode colonizar diversas partes do corpo humano, sendo as fossas nasais anteriores o seu nicho ecológico primário. A sua importância clínica deve-se à sua habilidade de resistir a quase todas as classes de antibióticos disponíveis, associado a um elevado número de fatores de virulência. As estirpes de MRSA (Methicillin-Resistant S. aureus)
são particularmente importantes no contexto hospitalar, sendo a maior causa mundial de infeções nosocomiais.
A resistência das estirpes MRSA aos antibióticos β-lactâmicos envolve a aquisição do gene
mecA, incluído na cassete SCCmec.
Técnicas de diagnóstico rápidas e confiáveis são necessárias para a redução da mortalidade e morbilidade associadas às infeções por MRSA, através da identificação precoce do agente de infeção. As técnicas de identificação atuais normalmente demoram 5 dias para determinar o perfil de resistência aos antibióticos. Têm sido desenvolvidas diversas técnicas baseadas em amplificação de forma a acelerar o diagnóstico.
O nosso principal objetivo foi desenvolver uma metodologia ainda mais rápida que evitasse o passo de amplificação de DNA. Foram usadas nanossondas de ouro para detetar a presença do gene mecA no genoma de S. aureus, associado a padrões de resistência, para ensaios colorimétricos baseados no método de non-crosslinking.
Os nossos resultados mostraram que as nanossondas de ouro mecA e mecA_V2 são suficientemente sensíveis para discriminar a presença do gene mecA em produtos de PCR e em amostras de DNA genómico (gDNA) para concentrações de alvo de 10 ng/µL e 20 ng/µL, respetivamente. Como o nosso principal objetivo implicava a eliminação do passo de amplificação, concluímos que a melhor metodologia de identificação de MRSA num estado inicial de infeção é a realização de ensaios colorimétricos baseados no método de non-crosslinking
com amostras de gDNA, que podem ser extraídas diretamente de amostras de sangue.
xi
Abstract
Staphylococcus aureus is an important opportunistic pathogen that can cause a wide variety of diseases from mild to life-threatening conditions. S. aureus can colonize many parts of the human body but the anterior nares are the primary ecological niche. Its clinical importance is due to its ability to resist almost all classes of antibiotics available together with its large number of virulence factores. MRSA (Methicillin-Resistant S. aureus) strains are particularly important in the hospital settings, being the major cause of nosocomial infections worldwide.
MRSA resistance to β-lactam antibiotics involves the acquisition of the exogenous mecA
gene, part of the SCCmec cassette.
Fast and reliable diagnostic techniques are needed to reduce the mortality and morbidity associated with MRSA infections, through the early identification of MRSA strains. The current identification techniques are time-consuming as they usually involves culturing steps, taking up to five days to determine the antibiotic resistance profile. Several amplification-based techniques have been developed to accelerate the diagnosis.
The aim of this project was to develop an even faster methodology that bypasses the DNA amplification step. Gold-nanoprobes were developed and used to detect the presence of mecA
gene in S. aureus genome, associated with resistance traits, for colorimetric assays based on non-crosslinking method.
Our results showed that the mecA and mecA_V2 gold-nanoprobes were sensitive enough to discriminate the presence of mecA gene in PCR products and genomic DNA (gDNA) samples for
target concentrations of 10 ng/µL and 20 ng/µL, respectively. As our main objective was to avoid the amplification step, we concluded that the best strategy for the early identification of MRSA infection relies on colorimetric assays based on non-crosslinking method with gDNA samples that can be extracted directly from blood samples.
xiii
Table of contents
Acknowledgments ... vii
Resumo ... ix
Abstract ... xi
Figures Index ... xvii
Tables Index ... xix
Abbreviations ... xxi
1. Introduction... 1
1.1. Staphylococci ... 1
1.2. Staphylococcus aureus– an important human pathogen ... 1
1.2.1. Antibiotic resistance along time ... 2
1.2.2. MRSA, the most important nosocomial agent ... 2
1.2.3. Resistance to β-lactam antibiotics ... 3
1.2.3.1. Peptidoglycan biosynthesis ... 3
1.2.3.2. The mechanism of resistance –mecA gene ... 4
1.2.3.3. Major clones and MRSA epidemiology ... 5
1.2.4. Current identification techniques ... 5
1.2.5. Current needs ... 6
1.3. Nanotechnology ... 6
1.3.1. Gold Nanoparticles ... 7
1.3.1.1. Synthesis ... 8
1.3.1.2. Functionalization ... 9
1.3.2. Non-crosslinking method ... 10
1.4. Thesis Scope ... 11
2. Materials and Methods ... 13
2.1. Materials ... 13
2.1.1. Equipment ... 13
2.1.2. Chemical Reagents ... 13
2.1.3. Biological Reagents ... 13
2.1.3.1. Oligonucleotides sequences ... 14
xiv
2.1.4. Other materials ... 14
2.1.5. Solutions ... 15
2.2. Methods ... 16
2.2.1. Plasmid DNA Extraction ... 16
2.2.2. Genomic DNA Extraction... 17
2.2.3. Amplification of mecA gene and P. falciparum 18S RNA fragments by Polymerase Chain Reaction ... 17
2.2.3.1. Reaction Mixture ... 17
2.2.3.2. Reaction Program ... 18
2.2.4. Purification of PCR products ... 18
2.2.4.1. Ethanol precipitation ... 18
2.2.4.2. Dialysis ... 18
2.2.5. DNA fragmentation ... 18
2.2.6. RNA Extraction ... 19
2.2.7. Synthesis of AuNPs ... 20
2.2.8. Transmission Electronic Microscopy (TEM) analysis ... 20
2.2.9. Functionalisation of AuNPs ... 20
2.2.9.1. Oligo nucleotides preparation ... 20
2.2.9.2. Au-nanoprobes synthesis ... 21
2.2.10. DLS analysis ... 21
2.2.11. Nanoprobes Stability Assays ... 21
2.2.12. Non-crosslinking Detection Assays ... 21
3. Results and Discussion ... 23
3.1. Design of primers and probes ... 23
3.2. Preparation of targets ... 24
3.3. AuNPs characterization ... 25
3.4. Au-nanoprobes characterization ... 27
3.5. Au-nanoprobes calibration ... 28
3.6. Detection of PCR products ... 29
3.7. Detection of plasmid DNA ... 31
3.8. Detection of genomic DNA ... 32
xv 4. Conclusions and future perspectives ... 37
References ... 39
xvii
Figures Index
Figure 1.1β-lactam antibiotic mechanism of action. ... 3
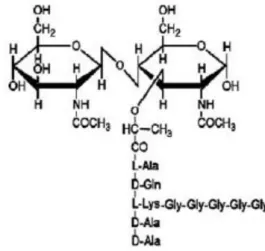
Figure 1.2 The basic unit of the peptidoglycan (Scheffers and Pinho, 2005). ... 4
Figure 1.3 Examples of nanomaterials (A-F upper the scale) and comparison with chemical and biological reagents (lower the scale) in terms of size... 7
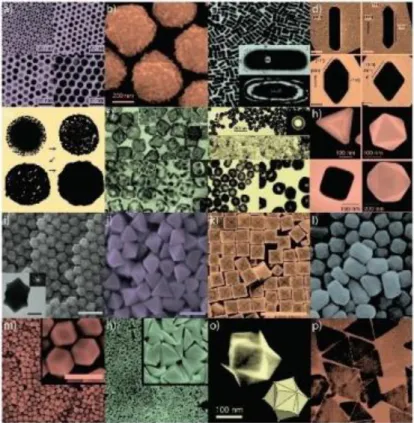
Figure 1.4 AuNPs of various sizes and shapes with potential application in biomedicine. ... 8
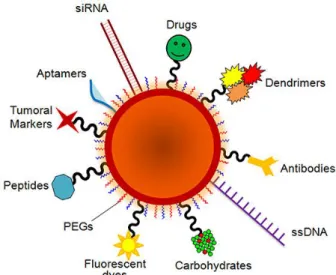
Figure 1.5 Schematic representation of an AuNP with various ligands (Conde et al., 2014). ... 9
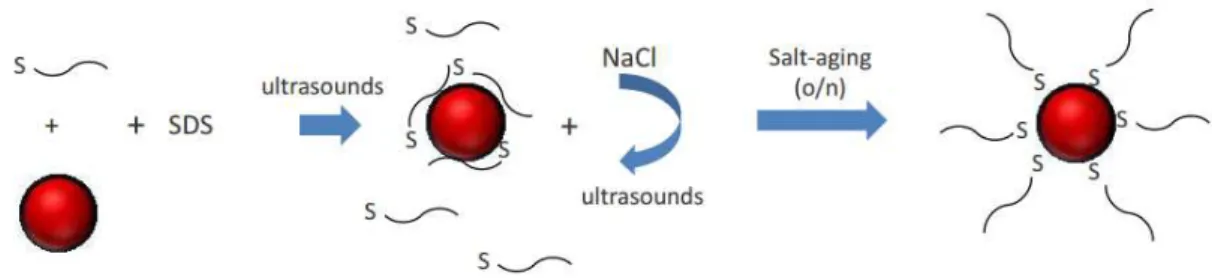
Figure 1.6 Schematic representation of functionalization of AuNPs with 5’-thiol-modified oligonucleotides by salt-aging (adapted from Hurst et al., 2006). ... 10
Figure 1.7 Non-crosslinking colorimetric assay using Au-nanoprobes for identification of nucleotides sequences (adapted from Larguinho et al., 2012). ... 11
Figure 3.1 Schematic representation of the target region of the mecA gene and primers (in yellow) and probes position (in orange)... 23
Figure 3.2 Electrophoretic analysis in 1% agarose gel.. ... 25
Figure 3.3 TEM image of spherical AuNPs with approximate 13 nm of diameter size. ... 26
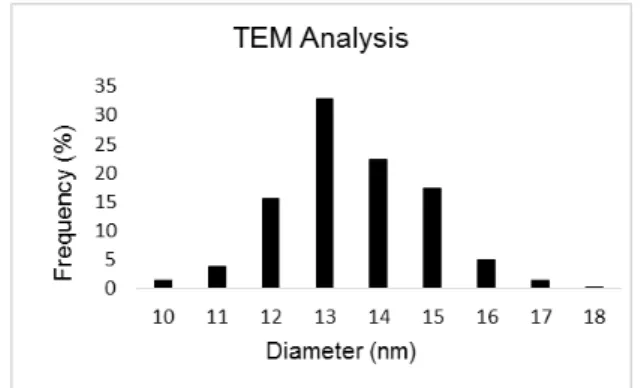
Figure 3.4 Histogram of the spherical AuNPs diameter analyzed by TEM. ... 26
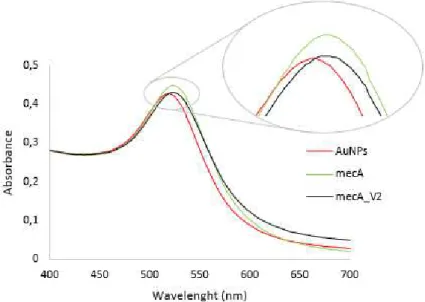
Figure 3.5 Spectra corresponding to AuNPs, mecA probe and mecA_V2 probe. ... 27
Figure 3.6 Au-nanoprobes stability assays using increasing concentrations of MgCl2. ... 28
Figure 3.7 Au-nanoprobes detection assays using 3 pmol/µL of oligonucleotides. ... 29
Figure 3.8 Au-nanoprobes detection assays using various concentrations of PCR product. .... 30
Figure 3.9 Au-nanoprobes detection assays using mecA_V2 probe and various concentrations of PCR product. ... 31
Figure 3.10 Au-nanoprobes detection assays using 30 and 60 ng/µL of sonicated pDNA. ... 32
Figure 3.11 Au-nanoprobes detection assays using various concentrations of sonicated gDNA. ... 33
Figure 3.12 Au-nanoprobes detection assays using various concentrations of RNA. ... 34
xix
Tables Index
Table 2.1 Equipment ... 13
Table 2.2 Oligonucleotides sequences ... 14
Table 2.3 Molecular Biology reagentes. ... 14
xxi
Abbreviations
Abs –AbsorbanceAL – Alkaline Lysis
AUC– Area under the curve
AuNPs – Gold Nanoparticles
bp– base pair
CA-MRSA - Community-Associated Methicillin-resistant Staphylococcus aureus DLS – Dynamic Light Scattering
DNA – Deoxyribonucleic Acid
dNTPs – Deoxyribonucleotide Triphosphate
DTT – Dithiothreitol
gDNA– genomic DNA
HA-MRSA - Health care-Associated Methicillin-resistant Staphylococcus aureus LB – Luria Bertani
MRSA– Methicillin-resistant Staphylococcus aureus MSSA– Methicillin-susceptible Staphylococcus aureus NCL– Non-crosslinking
PBP– Penicillin Binding Protein
PCR –Polymerase Chain Reaction
pDNA– plasmid DNA
RNA– Ribonucleic Acid
SCCmec–Staphylococcal chromosome cassette mec
SDS – Sodium Dodecyl Sulfate
SPR – Surface Plasmon Resonance
TEM – Transmission Electronic Microscopy
TSA– Tryptic Soy Agar
TSB– Tryptic Soy Broth
1
1. Introduction
1.1. Staphylococci
The genus Staphylococcus was introduced for the first time by Ogston in 1883 for the members of the micrococci group that have round-shaped cells, arrange as grape-like clusters, produce inflammation and suppuration develop violet coloration in the staining method (gram-positive bacteria). Staphylococcus genus includes over 40 different species, most of them animal commensals; the common phenotypic characteristics include being facultative anaerobes and catalase producers, capable to convert hydrogen peroxide to water and oxygen. Staphylococci are organized into two major groups, according to their capacity to produce coagulase, an enzyme that causes blood clot formation (Ogston, 1883).
1.2.
Staphylococcus aureus
–
an important human pathogen
A high number of hospital infections is caused by a specific species of coagulase positive staphylococci, Staphylococcus aureus (Solberg, 1965), name attributed by Rosenbach (Rosenbach, 1884).
Staphylococcus aureus is a commensal bacteria that colonizes the skin of healthy people. It is also an important opportunistic pathogen that can cause a wide variety of diseases, from mild conditions, such as skin infections like cellulitis, folliculitis, impetigo, abscesses, to life-threatening situations, such as pneumonia, endocarditis, meningitis, or toxic-shock syndrome (Foster, 2005), depending on its intrinsic virulence or the ability of the host to contain its opportunistic behavior (Grundman et al., 2006). Also, due to its capacity to produce exotoxins as virulence factors, S. aureus can be responsible for food poisoning (Lee, 2003).
Besides the skin, S. aureus can colonize other parts of the human body, such as the respiratory and the genitourinary tract (Skinner et al., 1941). However, the nose, specifically the anterior nares, is the primary ecological niche (Vanderbergh and Verbrugh, 1996).
In the pre-antibiotic era, S. aureus infections were responsible for the death of more than 80% of the infected patients. Moreover, 70% of the patients developed metastatic infections. The common treatment were general supportive measures, blood transfusions to supply red and leukocytes cells, surgical drainage of loci of infection and the administration of antitoxins to neutralize the circulating toxins (Skinner et al., 1941).
With the implementation of antibiotics for the treatment of infections, S. aureus immediately emerged as a highly versatile pathogen, showing the capacity to develop resistance to most classes of antibiotics (multi-resistant strains) and to spread worldwide through a number of successful clonal lineages (Vanderbergh and Verbrugh, 1996).
2
defense mechanisms (biofilm forming elements or protein A) (Skaar et al., 2004) and allowing the invasion and tissue penetration (leukocidins and enterotoxins) (Dinges et al., 2000).
1.2.1. Antibiotic resistance along time
The first β-lactam antibiotic used to combat infections caused by S. aureus was penicillin in 1940. Florey and Chain showed its high efficiency against gram-positive bacteria (Chain et al., 1940), however penicillin had been discovered earlier in 1928 by Alexander Fleming (Fleming, 1929).
Although the mortality associated to S. aureus drastically decreased with the introduction of penicillin, it was only 2 years later that the first resistant strains appeared in hospitals and in the community (Rammelkamp and Maxon, 1942). Resistance to penicillin is mediated by the acquisition of a plasmid-borne gene (blaZ) that encodes for a β-lactamase protein. This protein is only synthesized in presence of β-lactam antibiotics and hydrolyses the β-lactam ring, inactivating the effect of the antibiotic (Kernodle, 2000).
To overcome the acquired resistance to penicillin several semi-synthetics antibiotics, derived from penicillin and resistant to β-lactamase action, were created. The first one was methicillin in 1960 (Rolinson et al., 1960), but one year later, the first methicillin-resistant Staphylococcus aureus (MRSA), carrying the mecA gene was reported (Jevons, 1961).
MRSA strains have not only acquired resistance to methicillin, but also against other classes of antibiotics that have completely different cellular targets, namely protein synthesis or nucleic acid synthesis, such as chloramphenicol or rifampicin, respectively (van Bambeke et al., 2003).
More recently, antibiotics with great efficacy against MRSA infections were introduced into clinical practice, such as linezolid in 2013 (Gu et al., 2013) and tigecycline and daptomycin in 2014 (Dabul and Camargo et al., 2014). However, some few resistant strains have already emerged.
1.2.2. MRSA, the most important nosocomial agent
Since the introduction of the antimicrobial chemotherapy in the 1930’s, S. aureus has acquired many resistance traits. Methicillin resistance is the most important one and can be provided by one of two mechanisms: point mutations in specific chromosomal genes or horizontal transfer of an exogenous resistance gene. In this last mechanism, in which a single genetic element, the mecA gene, confers high level resistance to the major and more commonly prescribed class of antibiotics, the β-lactam antibiotics, such as penicillins, cephalosporins and carbapenemes (Grundman et al., 2006).
3 (PVL) and decreased resistance levels. However, more recently, the CA-MRSA strains began to also appear in hospitals, and the distinction between HA and CA-MRSA is progressively blurring. In fact, CA-MRSA are now endemic in many US hospitals (de Lencastre et al., 2007a; Vandenesch et al., 2003).
1.2.3. Resistance to
β
-lactam antibiotics
Bacteria have developed a variety of responses to the challenge of β-lactam antibiotics. In order to prevent the access of the drug to its target, different strategies are adopted by bacteria cells: mutations in the genes that encode the β-lactam’s targets, acquisition of β-lactamases (β -lactam hydrolytic deactivating enzymes), expression of protein inhibitors of the last enzymes, acquisition and activation of exporter proteins, removal of porin proteins of the cell membrane or modification of the cell wall (Fisher et al., 2005).
The targets of β-lactam antibiotics are the Penicillin-Binding Proteins (PBPs) that are involved in the last stages of peptidoglycan biosynthesis (van Bembeke et al., 2003). This class of antibiotics inhibit bacteria proliferation due to the fact that its ring is a structural analogue of the natural substrate of PBPs, the D-alanyl-D-alanine carboxy-terminus of the peptidoglycan pentapeptide (Tipper and Strominger, 1965). The β-lactam ring acylates the PBPs, forming a stable acyl-enzyme complex, in this way inactivating the PBPs by preventing them to bind to peptidoglycan (Yocum et al., 1979) (figure 1.1). The native enzymatic activity of PBPs includes the hydrolysis of the D-ala-D-ala bond of peptidoglycan and the formation of a new peptide bond between the fourth D-alanine residue and the terminal glycine residue of the bridge of the adjacent stem peptide.
β-lactam antibiotics are inactivated by β-lactamases that bind covalently to the β-lactam ring and hydrolyze its amide bond. These enzymes have amino acid sequence homology with PBPs and peptidases (Medeiros, 1997).
Figure 1.1β-lactam antibiotic mechanism of action. The PBP present in the cell wall recognize the drug, analogous of its natural substrate, and bind to it, being inactivated.
1.2.3.1.
Peptidoglycan biosynthesis
4
of the UDP-MurNAc-pentapeptide is associated to bactoprenol, the membrane acceptor, giving rise to MurNAc-pentapeptide-pyrophosphoryl-undercaprenol (lipid I). Then, lipid I is transformed into lipid II by receiving a GlcNAc molecule from UDP-GlcNAc, generating GlcNAc-β -(1,4)-MurNAc-pentapeptide-pyrophosphoryl-undecaprenol. The final step of the peptidoglycan biosynthesis takes place at the cell wall with the polymerization of the disaccharide-peptide units into pre-existing peptidoglycan. At this point, the PBPs catalyze the transglycosylation and transpeptidation reactions that will result in the formation of the glycosidic and peptidic bonds of the peptidoglycan. The transglycosylation reaction leads to the elongation of glycan strands while in the transpeptidation reaction, the terminal D-ala-D-ala bond is cleaved, with the release of the terminal D-alanine, and a new peptide bond is formed between the penultimate D-alanine of a donor peptide and an amino group of the cross bridge of an acceptor peptide (Scheffers and Pinho, 2005). The basic unit of the peptidoglycan can be seen in figure 1.2.
Figure 1.2 The basic unit of the peptidoglycan (Scheffers and Pinho, 2005).
1.2.3.2.
The mechanism of resistance
–
mecA
gene
The mechanism of resistance of MRSA strains involves the acquisition of mecA gene which encodes for Penicillin-Binding Protein PBP2A. The transpeptidation activity of this protein is redundant to the other Penicillin-Binding Proteins of S. aureus, however it has low affinity to β -lactams, and so, is able to takes over the peptidoglycan polymerization in the presence of the antibiotic (Fuda et al., 2005).
The mecA gene is exogenous to S. aureus and its origin is still unknown. One possibility is that mecA gene has evolved from a native gene of Staphylococcus sciuri, having been acquire by horizontal transfer (Couto et al., 1996). This bacteria colonizes the skin of domestic and wild
animals and it is free of the penicillinase plasmid. The widely spread use of penicillin in veterinary medicine, may have contributed to the emergence of MRSA strains, through the selective pressure of the antibiotic (de Lencastre et al., 2007b).
5 the S. aureus chromosome at a site-specific location (attBscc), situated near the origin of replication (Kuroda et al., 2001). This chromosomal cassette is bordered by recombinase genes (ccrA, ccrB or ccrC) that are responsible for the horizontal transfer of SCCmec (Hiramatsu et al., 2001). SCCmec is classified in many types, being the SCCmec type defined by the combination of the type of recombinase genes and the class of mec genes (Hiramatsu et al., 2013)
1.2.3.3.
Major clones and MRSA epidemiology
A significant number of MRSA clonal lineages have emerged from Methicillin-susceptible
Staphylococcus aureus (MSSA) strains with different genetic backgrounds that acquire SCCmec
through independent acquisition events. It is thought that MSSA strains are able to acquire different forms of mec element, behaving as recipients for the SCCmec transference. In fact, the composition of this genetic element has been widely used to classify MRSA clones.
The first MRSA strain (NCTC10442) isolated in the United Kingdom in 1960 harbored SCCmec type I. This MRSA clone is nowadays known as the Archaic clone and it disseminated worldwide in the 1960s. In 1982, an MRSA strain (N315) was isolated in Japan that harbored SCCmec type II. This clone was called New York/Japan clone and spread worldwide (Ito et al., 2001). Three years later, in 1985, a MRSA strain (85/2082) containing SCCmec type III was
discovered in New Zealand. Since the beginning of the 1990s that several MRSA clones harboring SCCmec type IV have disseminated worldwide (Vanderesch et al., 2003). In 2004, SCCmec type V was described in MRSA strain WIS, which was isolated in Australia. SCCmec type VI was first observed among MRSA isolates from Portugal and the prototype strain is called HDE288 (Oliveira
et al., 2006), but more recently it has been described in MRSA isolates from other countries. SCCmec type VII was first discovered in MRSA strain TSGH-17 and has been observed in MRSA isolates from Taiwan (Takano et al., 2008).
At the present, 11 types of SCCmec are registered (IWG-SCC, 2009), and a large number of
types is expected to appear during the next years.
1.2.4. Current identification techniques
6
produce a great amount of DNase, so positives should be always confirmed (Barry et al., 1973). Commercial biochemical tests are also used to identify S. aureus, although they are slower and more expensive (ligozzi et al., 2002). Molecular tests are been used too, especially PCR to amplified a large range of targets but is extremely expensive due to a vast number of samples that is necessary to analyse. These techniques are the most reliable (Barski et al., 1996).
To evaluate the methicillin susceptibility different techniques exist, which I will give some examples. Dilution methods include agar dilution or broth microdilution strategies and both require the use of NaCl and growth of the bacterial culture (NCCLS, 2003). The Etest method also uses NaCl and agar and involves the growth and application of bacterial inoculum with a swab (Huang et al., 1993). Latex agglutination may be used for the detection of PBP2A and involves the PBP2a extraction (Nakatomi et al., 1998) but may be poorly reliable if the colonies used for the extraction of PBP2a were grown in a medium with NaCl (Brown et al., 2001). Molecular methods for the detection of mecA gene use radiolabelled or digoxigenin-labelled DNA probes (Archer et al., 1990). The detection of MRSA in screening samples is also possible, using solid agar media with or without enrichment media.
1.2.5. Current needs
The need to develop techniques that allow a faster diagnosis at an early stage of infection arises in order to allow an earlier treatment, as well as knowing what type of antibiotic can be administered.
Diagnostic techniques have been improved in the latest years, especially molecular diagnostics. These tests can be very cheap, fast and are fairly easy to accomplish. In addition, they can allow the bypass of an amplification step and possibly without bacterial culture.
1.3. Nanotechnology
Nanotechnology merges engineering and technology at the nanoscale and can be defined like the science that studies, manipulates and controls materials between 1 and 100 nanometeres (Debnath et al., 2009) (figure 1.3). It includes the development of techniques for molecular diagnostics, such as the specific and selective molecular identification of pathogenic organisms. In this context, nanotechnology provides a rapid diagnostic that allows an early action against the infectious agent (Leroy et al., 2010, Baptista et al., 2006).
7
Figure 1.3 Examples of nanomaterials (A-F upper the scale) and comparison with chemical and biological reagents (lower the scale) in terms of size. The nanomaterials are comprised between 1 and 100 nm. A) gold-nanoparticle; B) carbon nanotube; C) liposome; D) micelle; E) quantum dot; F) dendrimer. Adapted from Marradi et al., 2010 and Joshi and Wang, 2010.
Nanomaterials have demonstrated their potentialities for biosensing application. High specific surface is one of the advantage of the nanomaterials in their use as biosensors, and provides high sensitivities and lowered detections limits. A biosensor can be defined by its biological or bioinspired receptor unit with unique specificities to corresponding analytes. The biological recognition is captured by transducers that translate the information into, for example, electrochemical, magnetic or optical signals (Holzinger et al, 2014).
1.3.1. Gold Nanoparticles
Gold nanoparticles (AuNPs) are widely and increasingly used for their potential on diagnostics. They are easily synthesized, in order to have controlled sizes and shapes (figure 1.4), and are extremely versatile, presenting great optical and physical properties such as intense colors or surface plasmon resonance (SPR), characteristics that are required to obtain a colorimetric result (Baptista et al., 2005).
8
Figure 1.4 AuNPs of various sizes and shapes with potential application in biomedicine. Small (a) and large (b) nanospheres, (c) nanorods, (d) sharpened nanorods, (e) nanoshells, (f) nanocages/frames, (g) hollow nanospheres, (h) tetrahedra/octahedra/cubes/icosahedra, (i) rhombic dodecahedra, (j) octahedra, (k) concave nanocubes, (l) tetrahexahedra, (m) rhombic dodecahedra, (n) obtuse triangular bipyramids, (o) trisoctahedra, and (p) nanoprisms (Dreaden et al., 2012).
Usually, for spherical AuNPs with 14 nm of diameter, the maximum SPR absorbance peak is localized at approximately 520 nm, conferring the AuNPs a strong red colour (Huang et al., 2007). As the size of the AuNPs increases, their colour tends to blue and the SPR peak suffers a shift to higher wavelengths, to the region of 600 nm, approximately. The same phenomenon is observed upon particle aggregation: when AuNPs associate and start to behave like a larger nanoparticle, their optical properties change accordingly and a shift to blue colour occurs (Sato et al., 2005).
1.3.1.1.
Synthesis
The nanomaterials can be synthesized by one of two concepts: top-down and bottom-up. Top-down methods include techniques such as lithography (Acikgoz et al., 2011), laser ablation (Mafuné et al., 2001) and focused ion beam (Shahmoon et al., 2010). These approaches tend to be slow and require the use of expensive equipment (Mühlig and Rockstuhl, 2013). Bottom-up methods relies on the production of nanomaterials from their precursors via self-assembly, requiring simple laboratory setup and tending to be simpler and faster than top-down methods (Grzelczaket al., 2010). Both concepts have being used to produce AuNPs.
However, the synthesis of AuNPs for applications in non-crosslinking methods (see section 1.3.2.) has been optimized by chemical reduction. Through addition of a reducing agent, sodium citrate, to a solution of chloroauric acid, Au3+ ions are reduced to neutral gold atoms, Au0. Being
9 Moreover, it is responsible for preventing aggregation of the AuNPs by electrostatic stabilization or by steric hindrance (Richards et al., 2005).
If the aim is to functionalize AuNPs (see section 1.3.1.2.) with ssDNA, the nanoparticles must be hydrophilic. The citrate reduction method (Turkevich et al., 1951) produces hydrophilic spherical AuNPs with 10 to 30 nm diameter. As stated above, in this method, sodium citrate acts both as a reducer and as a capping agent. By varying the molecular ratio of sodium citrate and gold salts, AuNPs of different diameters can be obtained, since higher concentrations of citrate lead to the formation of smaller particles and lower concentrations lead to the formation of larger particles. This phenomenon is due to the fact that, during the synthesis reaction, the diameter of the AuNPs increases until saturation by sodium citrate occurs (Ji et al., 2007).
This method gives rise to stable nanoparticles with negative charge, due to citrate capping, stabilized by electrostatic repulsion due to adsorption of sodium citrate to the surface of the AuNPs, a great advantage for the subsequent modification of the surface of the nanoparticle (Kumar et al., 2012).
1.3.1.2.
Functionalization
AuNPs can be functionalized with a wide list of organic ligands (see figure 1.5) in order to produce hybrid particles with enhanced functionality. With the appropriate ligand, nanoparticles can be used for gene silencing, drug delivery, colorimetric assays, sensing systems, imaging, and intracellular targeting, among others.
Figure 1.5 Schematic representation of an AuNP with various ligands (Conde et al., 2014).
Thiol groups have higher affinity for gold than sodium citrate, resulting in a quasi-covalent bond (Love et al., 2005) that stabilizes AuNPs against aggregation by salt induction (Sperling et al., 2010).
10
are both negatively charged. Surfactants like SDS are also used to improve the stability of the system. Thus, high concentrations of salt are needed to induce the aggregation of au-nanoprobes. A sonication step is performed after each salt addition in order to disrupt the interactions between the oligonucleotide bases. In this way, the surface of AuNP becomes more available for additional oligonucleotides to bind (Hurst et al., 2006).
Figure 1.6Schematic representation of functionalization of AuNPs with 5’-thiol-modified oligonucleotides by salt-aging (adapted from Hurst et al., 2006).
1.3.2. Non-crosslinking method
1.3.2.1. DNA/RNA detection Gold nanoprobes
The non-crosslinking method used in this work was designed by Baptista and co-workers (figure 1.7). If the Au-nanoprobes hybridize with complementary targets, the formation of heteroduplexes will provide stability to the Au-nanoprobes against salt-induced aggregation since the heteroduplex structure offers protection to the negatively charged backbones by steric hindrance. The stabilization is obtained when the electrostatic repulsions and the interparticle distance between AuNPs do not decrease (Baptista et al., 2005).
If the target present in the solution is a non-complementary target, the Au-nanoprobes will not stabilize and aggregation will occur in response to an increase of ionic strength upon salt addition. This aggregation phenomenon results in a change of color of the solution from red to blue that can be quantified with a spectrophotometer.
The ratio between Abs525nm and Abs600nm is commonly used to analyze and evaluate surface
plasmon resonance variations. Abs525nm represents the maximum absorbance of the dispersed
Au-nanoprobes, while Abs600nm represents the maximum absorbance for the aggregated
11
Figure 1.7 Non-crosslinking colorimetric assay using Au-nanoprobes for identification of nucleotides sequences (adapted from Larguinho et al., 2012).
An Abs525nm/Abs600nm ratio of 1 corresponds to equivalent amounts of dispersed and
aggregated Au-nanoprobes in the solution. Ratios over 1 are associated with a higher amount of dispersed Au-nanoprobes in comparison to aggregated ones, meaning that hybridization of the Au-nanoprobes with a complementary target and consequent stabilization occurred. On the other hand, a ratio value below 1, means that the amount of aggregated Au-nanoprobes is higher due to the presence of a non-complementary target (Larguinho et al., 2014). The trapezoidal rule can also be used to calculate the “areas under the curve” to both fractions dispersed and aggregated, originate a ratio between them (Conde et al., 2010).
To perform the colorimetric assay, it is more advantageous to use divalent salts, such as MgCl2, since they are capable of inducing aggregation of the nanoparticles at lower
concentrations than monovalent salts (Duguid et al., 1995).
Other important parameters have to be taken into account for the optimization of the non-crosslinking colorimetric assay: the nanoprobe concentration in the solution affects the stability assays, as it is related with the interparticle distance; the pH of the solution will influence the hybridization efficiency and target:probe specificity; the oligonucleotide density on the surface of AuNP will also influence the hybridization efficiency (Sun et al., 2009).
Once the optimal conditions of stability and hybridization are defined, the non-crosslinking method optimized by Baptista and co-workers can be used for colorimetric assays.
1.4. Thesis Scope
The molecular methods for detect MRSA infections involve carrying out a DNA amplification step result in high costs as also important hours. The huge emergence of the developing of new diagnostics techniques with less time-consuming, less costs and reliable makes it an important issue that has direct implication in human health.
12
1. Selection of target sequences;
2. Au-nanoprobes synthesis and characterization;
3. Extraction and purification of plasmid DNA from selected strains; 4. Amplification by PCR of selected fragments;
5. Extraction and purification of genomic DNA from selected strains;
6. Extraction and purification of RNA from selected strains. Optimization of extraction protocol for ease at point-of-care;
13
2. Materials and Methods
2.1. Materials
2.1.1. Equipment
Table 2.1 Equipment
Equipment Manufacturer
DLS, SZ-100 Horiba
FastPrep FP120 Thermo Electron Gel Doc XR+ Molecular Imager System Bio-Rad
Microfuge 3-16K Sartorius, Sigma Microfuge 1-14 Sartorius, Sigma
Microplate reader Infinite M200 Tecan
Peltier Thermal Cycler DNA Engine Bio-Rad Power supply electrophoresis BioRad
Programmable Thermal Controller PTC-100 MJ Research, Inc
Sonoreactor UTR200 Hielscher
Speed Vac Savant
Ultrasonic bath Elmasonic S10H Elma
UV-Vis Spectrophotometer NanoDrop ND1000 NanoDrop Technologies
UV-Vis Spectrophotometer UV mini 1240 Shimadzu
2.1.2. Chemical Reagents
All the chemical reagents used in this work were purchased from Sigma, Merck, Fluka, Invitrogen, Liofilchem and Panreac, with the highest purity available.
2.1.3. Biological Reagents
All the primer and target DNA fragments were ressuspended in sterile and filtrated water to achieve a concentration of 100 pmol and were stored at -20ᵒC. The treatment of the thiol-modified
14
2.1.3.1.
Oligonucleotides sequences
Table 2.2 Oligonucleotides sequencesName Sequence (5’-3’) Description
pmecAfw GAACAGCATATGAGATAGGC Primer
pmecArv ACTGCATCATCTTTATAGCC Primer
mecA_probe Thiol-ACTAATGAAACAGAAAGTCG Probe mecA_target CTTTTCCTAGAGGATAGTTACGACTTTCTGTTTCATTAGT Target
mecA_probeV2 Thiol-CCT AAT AGA TGT GAA GTC GC Probe
mecA_targetV2 ATC CTC TAG AAA AAG CGA CTT CAC ATC TAT TAG G Target pfalci18SF3 CAG ATG TCA GAG GTG AAA TTC Primer
pfalci18SB3 CAT GCA TCA CCA TCC AAG AAA TCA A Primer
2.1.3.2.
Molecular Biology reagents
Table 2.3 Molecular Biology reagentes.Product Producer
dNTPs mix Fermentas
DreamTaq Buffer Fermentas
DreamTaq polymerase Fermentas
GelRed Biotium
GeneRuler DNA Ladder Mix Fermentas
Oligonucleotides StabVida
RNA protect Qiagen
RNase A Fermentas
2.1.4. Other materials
Table 2.4 Other materials.
Product Producer
Acrodisc 32 mm Syringe Filter with 0.2µm Supor Membrane PALL
Dialysis Tubing – Visking Code DTV03500.02.00 Medicell Membranes Ltd
LoBase Polystyrene microplates 384 Greiner Bio-One
NAP-5 columns Sephadex G-25 DNA Grade GE Healthcare
15
2.1.5. Solutions
AGE I:
- 2% (w/v) SDS
- 10 mM phosphate buffer pH 8
- The solution was filtrated and stored at 4ºC
- The solution was warmed to 25ºC before use, to dissolve the SDS. AGE II:
- 1.5M NaCl - 0.01% (w/v) SDS
- 10 mM phosphate buffer pH 8
- The solution was filtrated and stored at 4ºC
- The solution was warmed to 25ºC before use, to dissolve the SDS. Alkaline Lysis I (AL I):
- 50 mM Glucose - 10 mM Tris-HCL pH 8 - 1 mM EDTA pH 8
- The solution was autoclaved and stored at 4ºC. Alkaline Lysis II (AL II):
- 200 mM NaOH - 1% (w/v) SDS
- The solution was always freshly prepared. Alkaline Lysis III (AL III):
- 3M sodium acetate
- The pH was adjusted to 5 with glacial acetic acid - The solution was stored at 4ºC
Luria Bertani (LB) medium:
- 1% (w/v) tryptone - 0.5% (w/v) yeast extract - 171 mM NaCl
- The pH was adjusted to 7, the medium was autoclaved and stored at 4ºC.
Phosphate Buffer 10 mM pH 7 0.1M Nacl: - 5.77 mM Na2HPO4
- 4.23 mM NaH2PO4
- 0.1 M NaCl
- The Buffer was autoclaved and stored at 4ºC Phosphate Buffer 10 mM pH 8:
- 9.32 mM Na2HPO4
- 0.68 NaH2PO4
16
Phosphate Buffer 10 mM pH8 0.1M NaCl:
- 9.32 mM Na2HPO4
- 0.68 NaH2PO4
- 0.1 M NaCl
- The Buffer was autoclaved and stored at 4ºC
2.2. Methods
2.2.1. Plasmid DNA Extraction
1. 10 mL of LB medium with 100 μg/mL ampicillin were inoculated with plasmids of cloned
mecA gene from S. aureus and cloned 18S ribosomal gene of Plasmodium falciparum and incubated overnight at 37ºC with agitation.
2. The culture was transferred to 1.5 mL tubes and centrifuged at 6660 x g for 15 minutes. 3. The supernatant was discarded, the pellet were resuspended in 150 µL of AL I solution and the sample was incubated on ice for 5 minutes.
4. 300 µL of AL II solution were added, the sample was homogenized gently by inversion and then incubated on ice for 5 minutes.
5. 225 µL of ALIII solution were added, the sample was homogenized by inversion and then incubated on ice for 30 minutes.
6. The lysate was centrifuged at 12500 x g for 30 minutes with soft start.
7. The supernatant was transferred to a clean tube and 2 volumes of ice-cold Absolut Ethanol were added.
8. The DNA was precipitated at -20ºC for 2 hours and centrifuged at 12500 x g for 10 minutes.
9. The supernatant was removed and the precipitate was washed with 1 volume of ice-cold 70% Ethanol and centrifuged at 12500 x g for 15 minutes.
10. The supernatant was discarded and the pellet was dried using a vacuum concentrator. 11. The DNA was ressuspended in 200 µL of sterile and filtrated water.
12. RNase A was added to a final concentration of 40µg/mL and incubated overnight at 37ºC. 13. 1 volume of phenol was added and the sample was thoroughly mixed for 1 minute. 14. After centrifugation at 12500 x g for 5 minutes the aqueous phase was transferred to a clean tube.
15. 1 volume of Phenol/Isoamyl Alcohol (24:1) was added and the sample was thoroughly mixed for 1 minute.
16. The sample was centrifuged at 13000 rpms for 5 minutes and the aqueous phase was transferred to a clean tube.
17. The DNA was precipitated with 2 volumes of absolute ethanol and washed with 1 volume of 70% Ethanol as in steps 7 to 10.
17
2.2.2. Genomic DNA Extraction
1. 1 mL of an overnight culture of COL and NCTC8325 S. aureus strains was centrifuged at 12500 x g for 2 minutes and the supernatant was removed.
2. The cell pellet was ressuspended in 100 µL of Tris, 1 µL of lysostaphin and 3 µL of RNase and incubated at 37ºC for 1 hour.
3. To complete the cell lysis procedure 600 µL of Nuclei Lysis Solution were added and gently homogenized.
4. The lysate was incubated at 80ºC for 5 minutes and then cooled to room temperature. 5. 200 µL of Protein Precipitation Solution were added to the RNase-treated cell lysate and the solution was vigorously mixed (vortex) for 20 seconds.
6. The sample was incubated on ice for 10 minutes and centrifuged at 13000 x g for 30 minutes at 4ºC.
7. The supernatant was transferred to a clean tube containing 600 µL of room temperature isopropanol and the contents were gently mixed by inversion until thread-like strands of DNA form a visible mass.
8. The sample was incubated for 15 minutes at room temperature and centrifuged at 13000 x g for 30 minutes at 4ᵒC.
9. The supernatant was removed and the DNA pellet was washed with 600 µL of 70% Ethanol.
10. The sample was centrifuged at 13000 x g for 15 minutes at 4ºC and the ethanol was aspirated.
11. The pellet was air-dried for 15 minutes and 100 µL of TE 1x were added. 12. The sample was stored at 4ºC.
2.2.3. Amplification of
mecA
gene and
P. falciparum
18S RNA fragments by
Polymerase Chain Reaction
2.2.3.1.
Reaction Mixture
- 1x DreamTaq Buffer - 0.2 µM primer rv - 0.2 µM primer fw - 0.2 mM dNTPs mix
- 25 mU/µL DreamTaq polymerase - 4 ng/µL template
18
2.2.3.2.
Reaction Program
mecA gene products:
1. 5 minutes, 95ºC Pre-Denaturation 2. 30 seconds, 95ºC Denaturation 3. 30 seconds, 59ºC Annealing 4. 90 seconds, 72ºC Extension
5. The steps 2 until 4 were repeated 30 times 6. 10 minutes, 72ºC Final extension
P. falciparum products:
1. 5 minutes, 95ºC Pre-Denaturation 2. 30 seconds, 95ºC Denaturation 3. 30 seconds, 58ºC Annealing 4. 30 seconds, 72ºC Extension
5. The steps 2 until 4 were repeated 30 times 6. 3 minutes, 72ºC Final extension
2.2.4. Purification of PCR products
2.2.4.1.
Ethanol precipitation
1. The PCR product was precipitated with 2 volumes of ice-cold Absolut Ethanol, mixed by inversion and incubated at -20ºC overnight.
2. The sample was centrifuged at 15500 x g and 4ºC for 20 minutes and the supernatant was discarded.
3. The PCR product was washed with 1 volume of 70% Ethanol and centrifuged at 15500 x g and 4ᵒC for 15 minutes.
4. The supernatant was removed and the pellet was air-dried on a speed-vac. 5. The pellet was ressuspended in 100 µL of sterile and filtrated water. 6. The samples were stored at -20ºC.
2.2.4.2.
Dialysis
1. The PCR products were introduced in the tampion of 1.5 mL tubes that were cut off of the tubes.
2. A dialysis membrane of 3500 da was used to cover the tampion and the samples were introduced in a beaker with miliQ water with agitation overnight.
3. The samples were transferred to new tubes and stored at -20ºC.
2.2.5. DNA fragmentation
19 2. The samples were sonicated with the help of a sonoreactor, during 6 minutes at 100% ultrasonication amplitude.
3. The samples were stored at 4ºC.
2.2.6. RNA Extraction
1. 50 mL of TSB medium were inoculated with an overnight culture in order to obtain an initial OD620nm of 0.01.
2. The culture was incubated at 37ºC with vigorous shaking until the OD620nm reached
0.7-1, corresponding to the mid-exponential phase of growth.
3. 10 mL of the culture were transferred to a 50 mL tube and the double volume of 20 mL of RNA protect was added.
4. The mixture was thoroughly homogenized using a vortex for 10 seconds and incubated at room temperature for 5 minutes.
5. The cells were pelleted by centrifugation at 6660 x g and 4ºC for 20 minutes and the supernatant was discarded.
6. The pellets were stored at -80ºC.
7. While the pellet was still frozen, 2 mL of Trizol were added. The pellet was ressuspended using the vortex.
8. The 2 mL of Trizol/ressuspended cells was divided into two 2 mL screw cap tubes with silica beads of 0.1 mm.
9. The cells were lysed in a FastPrep apparatus (speed setting=6 and time setting=40 seconds), a high-speed benchtop homogenizer.
10. After cell disruption, the sample was left at room temperature for 10 minutes. RNA is stable in trizol which deactivates RNases.
11. RNA extraction was achieved by adding 1/5 volume of Chloroform followed by vigorous shaking (vortex) and phase separation at room temperature for 5 minutes.
12. The sample was centrifuged at full speed for 15 minutes and the aqueous upper phase was transferred to a clean 1.5 mL tube.
13. Isopropanol was added to the aqueous phase to a final concentration of 70%, the mixture was homogenized by inversion and then incubated at room temperature for 10 minutes.
14. The sample was centrifuged at full speed for 15 minutes and the supernatant was removed, leaving approximately 100 µL covering the pellet.
15. 800 µL of 80 % ethanol were added to remove salts and the sample was slightly vortexed to release the RNA pellet from the bottom of the tube.
16. The sample was centrifuged at full speed for 2 minutes and the supernatant was removed as in step 14.
17. Washing step 15 was repeated.
20
19. The tubes were air-dried for 10 minutes and 25 µL of DEPC water were added to the pellet.
20. The pellets were ressuspended at room temperature for 10 minutes and stored at -80C.
2.2.7. Synthesis of AuNPs
1. All glass material was washed by immersion with aqua regia (HCl:HNO3, 3:1) overnight
and later with miliQ water (18.2 MΩ.cm at 25 °C).
2. A 500 mL round bottom flask with 250 mL of 1 mM HAuCl4 was boiled with vigorously stirring until reflux was reached.
3. 25 mL of 38.8 mM sodium citrate were added and 20 minutes later the colloidal solution was cooled at room temperature.
4. The colloidal solution was filtered using a 0.2 µm acrylic membrane and then stored in the dark, at room temperature.
2.2.8. Transmission Electronic Microscopy (TEM) analysis
The samples of AuNPs were sent to Instituto de Ciência e Engenharia de Materiais e Superfícies (ICEMS/IST) for TEM analysis. The preparation of samples involved the depositing of 10 μL of the previously prepared colloidal solution containing the AuNPs in carbon copper grids, washing twice with 10 μL of MiliQ water and them air dried. The TEM analyzis was performed with a HITACHI H-8100 microscope operated at 200 kV. The size and shape of the AuNPs were determined by analyzing the TEM pictures using the imaging software Carnoy 2.0.
2.2.9. Functionalization of AuNPs
2.2.9.1.
Oligo nucleotides preparation
1. The thiol-modified oligonucleotide was ressuspended in 100 µL of 1M DTT and the sample was incubated at room temperature for 3 hours.
2. Sterile and filtrated water was added to a final concentration of 0.1M DTT.
3. One volume of the thiol-modified oligonucleotide was extracted with two volumes of ethyl acetate and the sample was gently mixed.
4. The sample was centrifuged at 14460 x g for 5 minutes and the organic upper phase was discarded.
5. Steps 3 and 4 were repeated twice.
6. The aqueous phase was purified on a NAP-5 column and eluted with 10 mM phosphate buffer pH 8.0.
21
2.2.9.2.
Au-nanoprobes synthesis
1. The purified thiol-modified oligonucleotide was mixed with a solution of approximately 15 nM AuNPs to a theoretical ratio of 1:200 (AuNPs:Oligos).
2. AGE I solution was added to a final concentration of 10 mM phosphate buffer pH 8.0 and 0.01% (w/v) SDS and the sample was incubated 20 minutes at room temperature.
3. Aliquots of AGE II solution were added in order to increase the ionic strength of the solution, to attain final concentrations of 0.05, 0.1, 0.2 and 0.3M NaCl. The aliquots were added every 20 minutes followed by 10 seconds in an ultra-sounds bath.
4. After all the additions the solution was stored at room temperature overnight.
5. The obtained Au-nanoprobe sample was aliquoted in 2 mL tubes and centrifuged at 15500 x g for 40 minutes and the supernatant was discarded.
6. The pellets were washed three times with 10 mM phosphate buffer pH 8.0 and twice with 10 mM phosphate buffer pH 8.0 0.1M NaCl.
7. The pellets were added together, resulting in a final concentration of functionalized AuNPs of 13 nM.
2.2.10.
DLS analysis
The hydrodynamic radius of Au-nanoparticles and Au-nanoprobes was determined with Dynamic Light Scattering. A volume of 500 µL of approximately 2.5 nM nanoparticles and Au-nanoprobes was measured.
DLS analysis was performed in Departamento de Química (FCT/UNL).
2.2.11.
Nanoprobes Stability Assays
1. A solution containing a final concentration of Au-nanoprobe of 2.5 nM, and 10 mM phosphate buffer pH 7.0, 0.1M NaCl was heated during 5 minutes at 95ºC, cooled to room temperature and incubating at this temperature during 5 minutes.
2. Increasing concentrations of MgCl2 was added to the Au-nanoprobe sample to increase the salt concentration and reaching a total volume of 30 µL.
3. 20 minutes after salt addition all the samples were introduced in a microplate well and UV-visible spectroscopic measurements were registered in a microplate reader.
2.2.12.
Non-crosslinking Detection Assays
1. The amount of target needed for a detection assay was added to a solution of 2.5 nM Au-nanoprobe and 10 mM phosphate buffer pH 7.0, 0.1M NaCl. In parallel a blank solution without target was prepared.
2. All samples were heated for 5 minutes at 95ºC, cooled down to room temperature and incubating at this temperature for 5 minutes.
3. MgCl2 was added to the samples in order to reach the minimum salt concentration
22
23
3. Results and Discussion
As the prevalence of MRSA colonization and infection has increased after the introduction of
β-lactam antibiotics in hospitals and in the community, rapid and accurate detection systems of MRSA have been developed.
In this work the non-crosslinking method based on the colorimetric changes of Au-nanoprobes induced by the addition of salt was used for the detection of MRSA. To achieve this, a target sequence of the gene that confers resistance to methicillin, mecA gene, was chosen.
3.1. Design of primers and probes
Two primers, forward and reverse, of 20 nucleotides and with a GC content comprised between 40 and 50% were designed for the amplification of a consensus and relatively stable region of mecA gene with 334 bp.
For the colorimetric detection two probes were chosen, mecA and mecA_V2, both localized close to the middle of the target sequence, distant from the primers. As for the primers, both probes were 20 nucleotides long with a GC content comprised between 40 and 50%. The target region, primers and probes are schematically represented in figure 3.1.
The sequences of all the oligonucleotides were chosen with the help of NUPACK nucleic acid package (available online at www.nupack.org/design/new) and analyzed with the help of Nucleotide BLAST (Basis Local Alignment Search Tool) (available online in blast.ncbi.nlm.nih.gov/Blast.cgi). The NUPACK tool allowed choosing primers and probes that are not prone to self-annealing and with a free energy of secondary structures of 0.00 kcal/mol. The Nucleotide BLAST algorithm allowed to search for sequences in the database with which the probes could hybridize. Both probes only present 100% complementarity to sequences from the genomes of MRSA strains indicating that both probes are specific for MRSA detection.
In addition, mecA probe is complementary to the antisense chain of mecA gene sequence, while mecA_V2 probe is complementary to the sense chain of the target.
24
3.2. Preparation of targets
During the development of this work, DNA fragments of mecA gene were required as well as DNA fragments with no complementarity either to mecA gene or to the probes, with the pursuit of
serving as non-complementary targets for the non-crosslinking assays.
Firstly, plasmid DNA (pDNA) was extracted by the alkaline lysis method from plasmids of cloned mecA gene from S. aureus and of cloned 18S ribosomal gene from Plasmodium falciparum, both kindly provided by PhD student Bruno Veigas. PCR reactions using pmecA and pfalci specific primers were performed as suffered minor optimizations in the annealing temperature, so that there is no nonspecific products. In a second phase, genomic DNA (gDNA) of S. aureus strains COL (MRSA) and NCTC8325 (MSSA) was extracted using a commercial kit and finally RNA extraction from the same S. aureus strains was obtained using a Trizol based
method.
25
Figure 3.2 Electrophoretic analysis in 1% agarose gel. A) pDNA: lane 2 - mecA plasmid, lane 3 - sonicated mecA plasmid, lane 4 - falci plasmid, lane 5 - sonicated falci plasmid. B) mecA PCR product in lane 3, lane 2 is the negative control. C) falci PCR product in lane 3, lane 2 is the negative control. D) gDNA: COL gDNA in lanes 3-7, NCTC8325 gDNA in lanes 9-13, mecA pDNA in lane 16. E) gDNA: COL gDNA in lane 3, sonicated COL gDNA in lane 4, NCTC8325 gDNA in lane 5, sonicated NCTC8325 gDNA in lane 6. F) RNA: COL RNA in lanes 3-6, NCTC8325 RNA in lanes 8-11. G) Gene Ruler DNA Ladder mix in every first lanes.
3.3. AuNPs characterization
AuNPs were synthesized in the beginning of this work using sodium citrate as capping agent in order to achieve a final average diameter of 14 nm, as previously described in several reports in which non-crosslinking approaches were used (Costa et al 2010; Veigas et al 2010). To confirm if the desire size of AuNPs was obtained, the first simplest step was UV-vis spectroscopy analysis. The AuNPs presented a unique SPR absorbance peak in the region of 520 nm, more precisely
C)
B)
A)
F)
E)
D)
1 2 3 4 5
6
1 2 3 1 2 3
1 2 3 4 5 7 8 9 10 11 12 13 14 15 16
1 2 3 4 5 6 1 2 3 4 5 6 7 8 9 10 11
26
at 518 nm, confirming that the average diameter is approximately 14 nm, as expected (Huang et al 2007).
An alternative way to determine the AuNPs size was used, Dynamic light scattering (DLS). DLS is based on the differential scattering of the colloidal solutions conferred by their Brownian movement in the solution. The Brownian movement is related to the hydrodynamic radius of the AuNPs that differs with the molecules associated to its surface (Kato et al., 2009).
The results obtained through the DLS analysis showed that the AuNPs has an average diameter of 21.37 nm (±0.35), considerably higher than the predicted value of 14 nm. A possible cause for this discrepancy is the citrate capping of AuNPs witch alters the hydrodynamic radius of the AuNPs for higher values. According to this, the DLS results confirmed that the AuNPs had approximately the diameter required.
Finally, Transmission electron microscopy (TEM) analysis was performed to further confirm the average diameter of the AuNPs. TEM is a technique that generate images allowing the visualization of the AuNPs core and shape, providing a definitive and confinable confirmation for the size of the AuNPs. A representative image obtained by TEM analysis can be seen in figure 3.3.
Figure 3.3 TEM image of spherical AuNPs with approximate 13 nm of diameter size.
AuNPs were counted and their size was measured to a total of 420 measurements. The calculated average diameter of the nanoparticles was 13.4 nm (±1.3), presented as a histogram to better visualize the size distribution (figure 3.4).
27
3.4. Au-nanoprobes characterization
Once the desire size and shape of the AuNPs was confirmed, the next step was to functionalize the nanoparticles with the two probe sequences, mecA and mecA_V2 by salt-aging method (functionalize one amount of AuNPs with mecA probe and another amount of AuNPs with mecA_V2 probe). The functionalization was achieved by substituting the citrate ions on the surface of the AuNPs for thiol-modified oligonucleotides. The successive addition of salt, increasing the ionic strength resulted in the decrease of the electrostatic repulsion between the nanoparticles and allowed for the substitution of citrate ions for thiol groups.
As for the confirmation of the size of the AuNPs, the functionalization had to be confirmed prior to any subsequent assays with the Au-nanoprobes.
As before, the fastest and easiest way to verify the functionalization of the nanoparticles is to determine the UV-vis spectra. A successful functionalization will result in a shift of the maximum absorbance peaks to higher wavelengths. Both probes presented a shift in the SPR absorbance peak from 518 nm to 523 nm, indicating that the hydrodynamic radiuses of the nanoparticles had increased (figure 3.5).
Figure 3.5 Spectra corresponding to AuNPs, mecA probe and mecA_V2 probe. The spectra was obtained
by UV-Vis spectroscopy in the wavelength range of 400 - 700 nm.
To confirm this, the probes were analyzed by DLS. An increase in the hydrodynamic radius from 21.37 nm (±0.35) to 31.83 nm (±0.61) was observed for mecA probe and an increase to 32.93 nm (±0.40) was observed for mecA_V2 probe. The functionalization of AuNPs with an average diameter of 14 nm with 20 nucleotides probes is expect to yield Au-nanoprobes with 27.6 nm of diameter, since, according to Watson and Crick, the 20 nucleotides will cause an increase of 13.6 nm in the diameter of the nanoparticles (Watson and Crick, 1953). However, mecA probe only increased 10.46 nm the nanoparticle’s diameter, while mecA_V2 probe increased 11.56 nm. These differences between the obtained and the expected results can be explained by the
28
stretched. This could also meaning that the surface of the AuNPs has not the sufficient thiol-modified oligonucleotides attached, once with the electrostatic repulsion between the oligonucleotides sequences, the thiol-modified oligonucleotides should be stretched.
Stability assays were performed in order to evaluate the differences in the stability of the AuNPs colloid solution, once the citrate capped AuNPs aggregate by the increase of the ionic strength of the solution. As the oligonucleotides protect AuNPs from aggregation, by maintaining their stability in solution upon salt addition, it was expected that the Au-nanoprobes present the same stability when higher concentrations of salt were induced (Sato et al., 2003).
The stability assays for the Au-nanoprobes showed that the maximum shift in the SPR peak was to 594 nm for both probes. Also, the minimum concentrations of MgCl2 needed to induce full
aggregation of the Au-nanoprobes were determined as 65 mM for mecA_V2 probe and 110 mM for mecA probe, as shown in figure 3.6.
The value of the maximum shift in SPR peak for aggregated Au-nanoprobes and the value of SPR peak for dispersed Au-nanoprobes were used to define a reference ratio. Varied sets of wavelengths was studied in order to use the trapezoidal rule and to attain the highest numeric difference between dispersed and aggregated Au-nanoprobes. The intervals chosen was 10 nm before and after the SPR peaks for the dispersed and aggregated Au-nanoprobes, respectively. This ratio was used for all non-crosslinking assays and was set to define if there is more dispersed or aggregated Au-nanoparticles in solution. For ratio values lower than 1, nanoparticles were considered fully aggregated.
Figure 3.6 Au-nanoprobes stability assays using increasing concentrations of MgCl2. AUC ratio was calculated and for values lower than 1, Au-nanoprobes were considered aggregated. 65 and 110 mM of MgCl2 were considered the minimum concentrations needed to induce aggregation for mecA_V2 probe and mecA probe, respectively. The assays were all performed in triplicates.
3.5. Au-nanoprobes calibration
29 oligonucleotides hybridize with the Au-nanoprobes forming double stranded DNA sequences that are more complex and stable than single stranded molecules (Li and Rothberg, 2004). These structures will improve the steric hindrance around AuNPs, increasing their stability in solution, preventing aggregation. Both probes were able of detect complementary targets and discriminate them from non-complementary targets.
Figure 3.7 Au-nanoprobes detection assays using 3 pmol/µL of oligonucleotides. 110 mM of MgCl2 was used in assays for mecA probe and 65 mM of MgCl2 was used in assays for mecA_V2 probe. In B (Blank) assay, no DNA was added. In C assay, complementary target was added and in NC assay, non-complementary target was added. The assays were all performed in triplicates.
3.6. Detection of PCR products
Both probes were shown to be able of detect complementary targets using synthetic oligonucleotides. The next step was to determine if they were able to discriminate between complementary and non-complementary targets in the presence of higher DNA fragments sequences, double stranded and with several contaminants. Many components of the PCR reaction can interfere with Au-nanoprobes stability, such as dNTPs, proteins and salts (Eichmann and Bevan, 2010; Zhao et al., 2007). In order to remove the majority of these interfering compounds, the PCR products were purified by ethanol precipitation. Non-crosslinking colorimetric assays were performed using various concentrations of PCR products and the obtained results are shown in figure 3.8.
As expected, the results showed a direct correlation between the target concentration and the stability of the AuNPs, since higher concentrations of target mean higher stability of the AuNPs. The mecA_V2 probe seemed more sensitive and specific than mecA probe, as it presented higher ratios for the assays with the same concentrations of PCR products with the complementary target.
30
Figure 3.8 Au-nanoprobes detection assays using various concentrations of PCR product. 110 mM of MgCl2 was used in A) mecA probe and 65 mM of MgCl2 was used in B) mecA_V2 probe. In B (Blank) assay no DNA was added. In C assay, complementary target was added and in NC assay, non-complementary target was added. The targets were purified by ethanol precipitation. The assays were all performed in triplicates.
To improve the discrimination efficiency between the complementary target and the non-complementary, another purification method of the PCR products was tested: the PCR products were dialyzed using a membrane with MWCO of 3500 Da. All the assays were performed with mecA_V2 probe and the results are shown in figure 3.9.
31
Figure 3.9 Au-nanoprobes detection assays using mecA_V2 probe and various concentrations of PCR product. 65 mM of MgCl2 was used in all assays. In B (Blank) no DNA was added. In C assay, complementary target was added and in NC assay, non-complementary target was added. The targets were purified by dialysis. The assays were all performed in triplicates.
3.7. Detection of plasmid DNA
After the successful detection of the PCR products, the method was adapted for the detection of pDNA. By avoiding the amplification step, the time needed to obtain a final result as well as the associated costs, are decreased. Several studies showed impressive results using sonicated gDNA for application in biosensors, as fragmentation decreases the steric hindrance between the probes and the targets (Mann and Krull, 2004). The use of ultrasounds results in the fragmentation of biological molecules (Miller et al., 1996). The high frequency acoustic waves result in cavitation, the formation of microbubbles with gas. Inside this bubbles, high pressure and temperatures lead to mechanical and thermal degradation (Suslick et al., 1999).