João Miguel Borges Branco da Silva
Graduate in Biochemistry
Evaluation of Drought Tolerance in Several Genotypes of
Spelt
(
Triticum aestivum
Var. Spelta)
October, 2014
Thesis submitted for the Degree of Master in Food Technology and Safety
Supervisor:
Doctor Fernando José Cebola Lidon FCT/UNL
Co-supervisor: Doctor Ismail Cakmak FENS – Sabancy University
Jury Members:
President: Doctor Ana Lúcia Monteiro Durão Leitão
iii
Evaluation of Drought Tolerance in Several Genotypes of Spelt
(
Triticum aestivum Var. Spelta
)
Copyright © João Miguel Borges Branco da Silva, FCT/UNL
The Faculty of Sciences and Technology and the New University of Lisbon have the right, perpetual and without geographic boundaries, to file and publish this dissertation through printed copies in paper or in digital format, or by any other known means or yet to be invented, and to disclose it through scientific repositories and to allow its copy and distribution with educational purposes or for investigation, non-commercial, provided credit is given to the author and editor.
Estudo da Tolerância à Seca em Vários Genótipos de Espelta
(
Triticum aestivum Var. Spelta
)
Direitos de cópia © João Miguel Borges Branco da Silva, FCT/UNL
A Faculdade de Ciências e Tecnologia e a Universidade Nova de Lisboa têm o direito, perpétuo e sem limites geográficos, de arquivar e publicar esta dissertação através de exemplares impressos reproduzidos em papel ou de forma digital, ou por qualquer outro meio conhecido ou que venha a ser inventado, e de a divulgar através de repositórios científicos e de admitir a sua cópia e distribuição com objectivos educacionais ou de investigação, não comerciais, desde que seja dado crédito ao autor e editor.
The Author:
João Miguel Borges Branco da Silva
O Autor:
Acknowledgements
2013/2014
v
Acknowledgements
O meu grande agradecimento:
To Professor Ismail Cakmak who accepted and provided the opportunity to work on this project and also for all the help and patience, thank you very much!
To Yusuf, Atilla, Yasemin, Sinem, Özge and Hussein, for all help and support during our stay in Sabanci.
To Gözde, Ceyda, Onur, and the twins Irfan and Ersin, and all Erasmus friends for all integration and friendship, during all these months in this amazing adventure called Istanbul.
Ao Professor Fernando Lidon, por ser um óptimo professor, exigente e sério, mas ao mesmo tempo divertido e cativante em todas as aulas e momentos que estivemos juntos. E principalmente por nos ter apoiado e proporcionado esta experiência única de enriquecimento académico e pessoal que ficará marcada para sempre nas nossas vidas, ficarei para sempre grato por tudo o que fez por nós, muito obrigado por confiar em nós.
À malta da Costa, que garantiu durante todos estes anos, momentos espectaculares, criando um elo de amizade que faz impressão, Lino, Páscoa, Cascão, Valter e Luis.
Aos Fixes da Batalha, que estão comigo desde sempre, e que com vocês partilhei e vivi tudo até hoje como se não houvesse amanhã, Jon, Jorge, Simão, Bárbara, Elodie, Diana e Mónica, obrigado por me ajudarem a ser quem sou.
Para a minha família, que sempre me deu tudo o que precisei e tudo o que me ensinaram desde sempre para ser quem sou.
Para a minha Catarina, que me aguenta em qualquer altura e que está comigo em tudo, que cuida de mim e me ajuda sempre. Por toda a tua bondade e por seres tão única, tão diferente e especial. Por seres a pessoa mais bonita que já vi e por me amares tanto, mesmo quando não mereço, por ficares comigo e por sermos como somos, obrigado meu amor...
Abstract
2013/2014
vii
Abstract
Domestication of plants and plant breeding have dramatically eroded the allelic variations of crop species which led to an increasing susceptibility of crop plants to environmental stresses, diseases and pests. Drought is a major environmental stress factor that affects the growth and development of plants so the selection of tolerant genotypes becomes increasingly important with respect to the predicted effects of global warming. In this study, several genotypes of Spelt (Triticum aestivum var. spelta) were tested under low water supply in soil with the aim of to find Spelt genotypes more resistant than wheat to these conditions, and select them so that in future may be used to improve wheat crops. Morphological analyses were performed and mineral and enzymatic analyses and also dry matter production were calculated. Our results suggests that the genotypes Sp53, Sp96, Sp912, Sp757 and Sp804 are a potential ones to use in breeding programs to improve wheat production. Under drought, these genotypes had growth efficiency of 38%, 45%, 64%, 37%, and 31% respectively and also showed higher biomass than modern wheat and were also mineralogical richer. The genotypes Sp96 and Sp912 showed highest activity of all antioxidants enzymes tested. This work proves that Spelt is a good wheat to continue to study in order to improve wheat crops in dry areas and consequently increase the quality of life and health of the populations living in those areas.
Resumo
2013/2014
ix
Resumo
A domesticação e melhoramento de plantas têm vindo a alterar e reduzir geneticamente as variações alélicas das espécies o que levar a uma suscetibilidade maior dessas plantas a stresses ambientais, doenças e pragas. A seca é um dos mais importantes factores de stress ambiental que afecta o crescimento e desenvolvimento das plantas, deste modo, a selecção de espécies mais tolerantes torna-se cada vez mais importante no que diz respeito aos efeitos previstos de aquecimento global. Neste estudo, vários genótipos de Espelta (Triticum aestivum var. Spelta) foram testados sob baixo fornecimento de água no solo com o objetivo de encontrar genótipos mais resistentes do que o trigo a estas condições e selecioná-los para que, no futuro, possam vir a ser usados para melhorar as colheitas de trigo. Para este estudo foram realizadas análises morfológicas mineralógicas e enzimáticas bem como a produção de matéria seca calculadas. Os nossos resultados indicam que os genótipos Sp53, Sp96, Sp912, e Sp757 Sp804 são potenciais escolhas para no futuro serem usados em programas de cruzamento com o intuito de melhorar a produção de trigo. Sob seca, esses genótipos apresentaram uma eficiência de crescimento de 38%, 45%, 64%, 37% e 31%, respectivamente e não só em biomassa, mas também a nível de minerais na sua constituição, obtiveram melhores resultados quando comparando com o trigo moderno. Os genótipos Sp96 e Sp912 revelaram ainda possuir uma maior atividade de todas as enzimas antioxidantes testadas. Este trabalho prova que a Espelta é um bom trigo para continuar a estudar, a fim de melhorar as colheitas de trigo moderno em áreas secas e, consequentemente, aumentar a qualidade de vida e saúde das populações que vivem nessas áreas.
Table of Contents
2013/2014
xi
Table of Contents
Acknowledgements v
Abstract vii
Resumo ix
Table of Contents xi
Table of Figures xiii
Table of Tables xv
List of Abbreviations xvii
1. Introduction 1
1.1. Wheat 1
1.1.1. Origins and Importance 1
1.1.2. Domestication of Wheat 2
1.2. Changes in Society, Lifestyle and Diet 3
1.3. Drought Stress 4
1.4. Spelt 7
1.5. Vernalization 8
1.6. Mineral Content 8
1.7. Enzymatic Activity 9
2. Materials and Methods 11
2.1. Plant culture and treatments 11
2.1.1. 1st Experiment 11
2.1.2. 2nd Experiment 11
2.1.3. 3rd Experiment 12
2.2. Determination of Dry Matter Production 12
2.3. Determination of Mineral Nutrients 12
2.4. Determination of Enzymatic Activity 13
3. Results and Discussions 15
3.1. 1st Experiment 15
3.2. 2nd Experiment 18
3.3. 3rd Experiment 22
Conclusions and Future Aspects 33
Conclusões e Propostas Futuras 35
Table of Figures
2013/2014
xiii
Table of Figures
Table of Tables
2013/2014
xv
Table of Tables
Table 3.1 – Mineral composition of K, Ca and Na from all genotypes studied of the first experiment, as well as, drought efficiency and K/Na and (K+Ca)/Na ratios with respective
standard deviation (STD). ... 15
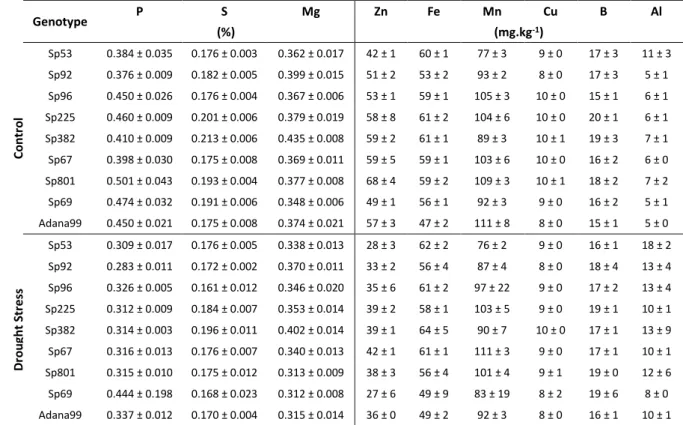
Table 3.2 – Mineral composition from all Spelt genotypes studied in the first experiment and Adana99, with respective STD. ... 18
Table 3.3 – Mineral composition of K, Ca and Na from all genotypes studied of the second experiment, as well as, drought efficiency and K/Na and (K+Ca)/Na ratios with respective STD. ... 19
Table 3.4 – Mineral composition from all Spelt genotypes studied in the second experiment and Adana99, with respective STD ... 21
Table 3.5 – Mineral composition of K, Ca and Na from all genotypes studied of the third experiment, as well as, drought efficiency and K/Na and (K+Ca)/Na ratios with respective STD ... 25
Table 3.6 – Mineral composition from all Spelt genotypes studied in the third experiment and Adana99, with respective STD. ... 27
Table 3.7 – Protein concentration from the 5 selected genotypes studied on the third experiment. ... 28
Table 3.8 – SOD Activity from the 5 selected genotypes studied on the third experiment. ... 29
Table 3.9 – GR Activity from the 5 selected genotypes studied on the third experiment. ... 30
Table 3.10 – CAT Activity from the 5 selected genotypes studied on the third experiment. ... 30
List of Abbreviations
2013/2014
xvii
List of Abbreviations
AA – Ascorbic Acid ABA – Abscisic Acid
APX – Ascorbate Peroxidase ATP – Adenosine Triphosphate CAT – Catalase
DSP – Desmoplakin
FENS – Faculty of Engieering and Natural Sciences FW – Fresh Weight
GR – Glutathione Reductase GSSG – Oxidized Glutathione ICP – Inductively Coupled Plasma LEA – Late Embryogenesis Abundant MDHA – Monodehydroascorbate
MDHAR – Monodehydroascorbate Reductase
NADP+– Nicotinamide Adenine Dinucleotide Phosphate
NADPH – Nicotinamide Adenine Dinucleotide Phosphate Oxidase NBT – p-Nitro Blue Tetrazolium Chloride
POD – Peroxidase
Introduction
2013/2014
1
1.
Introduction
1.1.
Wheat
1.1.1. Origins and Importance
With 620 and 681 million tons produced worldwide in 2006 and 2011, respectively, wheat provides about 20% of the calories consumed by humans, being an important source of protein, vitamins and minerals (Dubcovsky and Dvorak, 2007; Brenchley et al., 2012). Is the universal cereal of the Old World agriculture and the world’s foremost crop plant, followed by rice and maize (Peng et al., 2011). Far from being a staple food, in many parts of the world, is a major cereal crop, commonly known as a “King of Cereals” (Datta et al, 2009). Thus, wheat is the most important food crop of mankind, whose considerable areas of cultivations are located on low-moistured soils. The consumption of wheat increases each year, especially in developing countries. It is estimated that global wheat production between 2010 and 2020 will rise by 40% (Aliyev, 2012).
About 95% of the wheat crop is common wheat (Triticum aestivum), used for making bread, cookies, and pastries and the remaining 5% is durum wheat (Triticum durum), used for making pasta and other semolina products (Brenchley et al., 2012). Einkorn wheat (Triticum monococcum) and other hulled wheats, namely emmer (Triticum dicoccum) and spelt (Triticum spelta), are today relic crops of minor economic importance (Fig. 1.1) (Heun et al., 1997; Peng et al., 2011).
For many years, it was believed that bread wheat had evolved from Spelt by mutations that changed the form of the ear however, newer scientific research suggests that it evolved independently about 8,500 years ago but from the same two ancestors, Cultivated Emmer and a Goat Grass (Fig. 1.1) (Marcussen et al., 2014). This created a free-threshing hybrid that differed from Spelt by the ear being roughly square in section, with more grains and a tougher rachis [1].
Fig. 1.1 – The evolution of wheat from the prehistoric Stone Age grasses to modern macaroni wheat and bread wheat [1].
Introduction
2013/2014
2
1.1.2. Domestication of Wheat
The domestication of wheat around 10,000 years ago marked a dramatic turn in the development and evolution of human civilization. The society transited from a huntergatherer and nomadic pastoral, to a more sedentary agrarian one (Eckardt, 2010). Dependent on wild resources for their nutritional requirements, this nomadic lifestyle was dictated by plant availability, and the annual animal cycle. The cultivation of plants and the husbandry of animals enabled humans to obtain a control over their food resources, protecting them from climatic and environmental uncertainty (Brown et al., 2009). This transition was the beginning of agriculture and it caused many changes in human culture — a phenomenon known as the
“Neolithic Revolution” (Salamini et al., 2002).
The first humans to pioneer farming practices lived in the Fertile Crescent — a region that spans modern-day Israel, Jordan, Lebanon and western Syria, into southeast Turkey and, along the Tigris and Euphrates rivers, into Iraq and the western flanks of Iran (Fig. 1.2).
This region is characterized by a variable topography, marked seasonality with cold rainy winters and dry summers, a history of fluctuating precipitation and a rich palaeoflora that is well documented in the fossil pollen record. These features contributed to making this region the cradle of agriculture, there is why in the Fertile Crescent agriculture allowed the development of a dense human population (Salamini et al., 2002).
Domestication of plants (and also animals) is the major factor underlying human civilization and is a gigantic evolutionary experiment of adaptation. Is the outcome of a selection process that results in the increased adaptation to cultivation and use by humans (Brown, 2010) and, as Charles Darwin said, it is a gigantic evolutionary experiment of adaptation and speciation, generating incipient species (Darwin, 1905).
Introduction
2013/2014
3
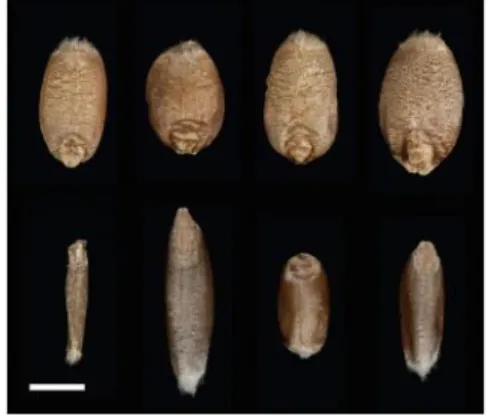
Two of the most important traits in the domesticatedbread wheat were an increase in grain size and the development of nonshattering seed (Fig. 1.3). The former has been associated with successful germination and growth of seedlings in cultivated fields, whereas the latter trait (a hallmark of domestication) prevents natural seed dispersal and allows humans to harvest and collect the seed with optimal timing (Eckardt, 2010). These traits contributed to an increase in crop yields.
1.2.
Changes in Society, Lifestyle and Diet
After the Green Revolution, thanks to advances in technology and science during the last decades, people adopted a new lifestyle. Due to this new lifestyle, not only in the developed countries, but also in the less developed countries, people changed their diet. Now people eat more, and more animal products (Chrispels and Sadava, 2003; Capper et al., 2013). For example, in Portugal, between 1961 and 2009 the average of Kcal daily consumed per person increased from 2473 Kcal to 3617 Kcal. From these values, in 1961 the Kcal/day consumed from animal products were 345 Kcal (14% of the total diet), and raised to 1034 Kcal (30% of the total diet) in 2009, which means that in Portugal from 1961 to 2009 the portion of animal products doubled, whereas about 1200 Kcal/day of human total diet was reached (Fig. 1.4) [2].
Fig. 1.4 - Comparison between the increases of consumption of meat with the population growth.
Fig. 1.3 – Differences between domesticated wheat (top) and ancestral species (bottom).
Introduction
2013/2014
4
In this context, if we correlate the population growth with the increase of consumption of meat,
we can speculate that we will not be able to produce enough food to feed the world’s
population. As we can see in the chart above (Fig. 1.4), from 1990 to 2011 the world’s population increase 30% whereas, on the other hand, the consumption of meat increase 70% during these 11 years [2]. With the prediction of population growth reach more than 9 billions in 2050, it is expected that the increase in meat consumption increase further. Only in Portugal, from 1990 to 2009 the consumption of meat increase from 62,8Kg per capita per year to 93,4Kg, more than 30Kg.
In addition, to produce 1Kg of meat (pork or beef) we need about 5Kg of cereals plus 15 000 liters of water, so basically, each person in Portugal spend indirectly more than 400Kg of grains and 1 000 000 liters of water per year to eat meat.
For all these reasons, is crucial to improve and develop new techniques that allow to obtain higher yields in crops, since only about 38% of the surface of the Planet Earth is arable (Chrispels and Sadava, 2003).
1.3.
Drought Stress
Due to climate change and global warming, crop yields tend to decrease (Nelson et al., 2009; Schlenker and Lobell, 2010). Climate change also impact significantly by increasing water demand, limiting crop productivity and by reducing water availability in areas where irrigation is most needed or has comparative advantage (Turral et al., 2011). Soil productivity is decreasing globally due to enhanced soil degradation in the form of erosion, nutrient depletion, water scarcity, acidity, salinization, depletion of organic mater and poor drainage. Near 40% of the agricultural land has been affected by soil degradation (Cakmak, 2002). Processes such as seed germination, seedling growth and vigour, vegetative growth, flowering and fruit set are adversely affected under drought conditions, reducing yield and quality of the final product (Sairam and Tyagi, 2004). Plants are also more susceptible to drought during flowering and seed development (the reproductive stages), as plant’s resources are deviated to support root growth (Oliveira et al., 2013).
Introduction
2013/2014
5
One factor contributing to this inadaptation to climate change is the domestication. The genetic changes responsible for the suite of traits that differentiate domesticated plants from their wild ancestors are referred to as the domestication syndrome. In wheat, as in other grains from scattering by wind and facilitating harvesting. Other traits of the wheat domestication syndrome shared by all domesticated wheats are increased seed size, reduced number of tillers, more erect growth, and reduced seed dormancy (Dubcovsky and Dvorak, 2007). Domestication causes also substantial genetic erosion and that erosion was reinforced during modern breeding processes, and thus increased susceptibility and vulnerability to environmental stresses, pests and diseases (Peng et al., 2011).Introduction
2013/2014
6
It has been long known that crop plants are usually exposed to different environmental stresses during their development and these stresses limits their growth and productivity (Moud and Maghsoudi, 2008). The effects of these abiotic stresses on plants in both natural and agricultural settings is a topic that is receiving further attention because of the potential impacts of climate change on rainfall patterns, temperature extremes, salinization of agricultural lands by irrigation and the overall need to maintain or increase agricultural intensity and duration of stress, plant genotype, developmental stage and environmental factors that cause stress (Aliyev, 2012). Among these, drought and salinity are the most severe ones that reduces productivity (Moud and Maghsoudi, 2008).
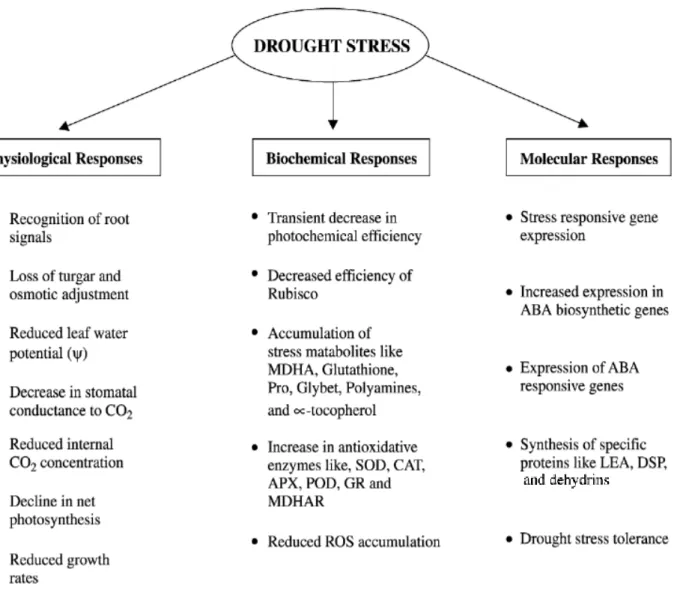
Drought is a major environmental stress factor that affects the growth and development of
plants. In the analysis of a plant’s drought response, the mode, timing, and severity of the
dehydration stress and its occurrence with other abiotic and biotic stress factors are significant. Furthermore different species, subspecies, and cultivars of crops show variation in their drought tolerance under same conditions, emphasizing the importance of genetic diversity as an underlying factor of drought and its significance in drought-related research. The effects of drought are expected to increase with climate change and growing water scarcity, thus, an understanding of drought stress and water use in relation to plant growth is of great importance for sustainable agriculture (Budak et al., 2013).
The results of drought stress are disorganization of membranes, loss of activity or denaturation of proteins and, as it was said before, oxidative damage by excess production of (ROS). As a consequence, inhibition of photosynthesis, metabolic dysfunction, and damage of cellular structures contribute to growth disorders, reduced fertility, and premature senescence (Krasensky and Jonak, 2012).
Introduction
2013/2014
7
The selection of tolerant genotypes becomes increasingly important with respect to the effects of global warming also in Central Europe, like higher temperatures, lower precipitation and an uneven distribution of precipitation during the growing season.These genotypes may exhibit differences in many physiological reactions such as changes in the osmotic adaptation of plants, changes in the levels of protective proteins and other metabolites and antioxidant capacity of plants. Having been exposed to stress conditions, the plants show induction of a number of biochemical and physiological changes, which lead to the development of protective mechanisms aimed at the efficient utilization of available water or salt excess in soil. Usually, the most resistant genotypes are those that exhibit tolerance at multiple levels at the same time (Truhlářová et al., 2012). Comparing the eight major crops (wheat, barley, corn, sorghum, soybean, oat, potato and sugar beet), wheat is the most sensitive to abiotic stresses involving drought and salinity (Pauk et al., 2012).For all these reasons, the best strategy for wheat improvement is to utilize the adaptive genetic resources of the wild progenitors, there is why in this study we used Spelt.
1.4.
Spelt
Introduction
2013/2014
8
Nutritionally, spelt contain higher levels of protein (12.1–17.1%), soluble dietary fiber, and minerals, such as zinc, selenium, lithium, phosphorus and magnesium than common wheat (Neeson et al., 2011). Results from an EU research project identified spelt varieties with increased protein yield (18%) and higher nitrogen efficiency enabling them to compete with wheat and oats in the livestock feed market. When harvested for forage, yields and protein content of winter spelt were significantly higher than for spring oats (Neeson et al., 2011). The aim of this study is to find Spelt genotypes with better growth rates and under drought conditions than modern wheat, to be used in the future to improve wheat crops by breeding programs. Accordingly, different genotypes of spelt, randomly selected, and modern wheat (Adana99) were grown at the same time under drought stress. Therefore, morphological differences between spelt and modern wheat as well as enzymatic activity and mineral composition were assessed.
1.5.
Vernalization
In this experiment, we will adopt a technique to grow our plants called Vernalization. This technique consists in prolonged exposure to cold temperatures in absence of light in order to promoting flowering, before being sown (Amasino, 2004). A good vernalization should be done with temperatures between 3-8oC (with some exceptions) and the time required for complete vernalization depends of the specie. The length of vernalization treatment required for complete vernalization is related to whether a species has an obligate or facultative vernalization requirement. Many crops of the biennial plants stay vegetative without cold exposure so the cold requirement is obligatory, on the other hand, for some species, vernalization has only a furthering effect on flower induction, therefore the cold requirement for those is called facultative (Kaymak and Güvenç, 2010).
1.6.
Mineral Content
Introduction
2013/2014
9
Intracellular K+ and Na+ homeostasis is important for the activities of many cytosolic enzymes, and for maintaining membrane potential and an appropriate osmoticum for cell volume regulation. Na+ stress due to drought, disrupts K+ uptake by root cells, accumulates to high levels inside plant cells and becomes toxic to enzymes (Zhu, 2003). Even in halophytic plants, which accumulate large quantities of Na+ inside the cell, their cytosolic enzymes are just as sensitive to sodium as enzymes of glycophytic ones, which implies that halophytes have to compartmentalize the Na+ into the vacuole. K+ deficiency inevitably leads to growth inhibition because K+, as the most abundant cellular cation, plays a critical role in maintaining cell turgor, membrane potential and enzyme activities (Zhu, 2007).When intracellular Na+ are in toxic levels, there is a cytoplasmatic trigger in Ca2+ signal wich is needed to remove Na+ from cells (Zhu, 2002). Increased Ca2+ supply has a protective effect on plants under Na+ stress, because Ca2+ sustains K+ transport and K+/Na+ selectivity in sodium-changelled plants. This beneficial effect of Ca2+ is mediated through an intracellular signaling pathway that regulates the expression and activity of K+ and Na+ transporters. Ca2+ may also directly suppress Na+ import mediated by nonselective cation channels. Usually, the symptoms of damage by this stress are growth inhibition, accelerated development and senescence, and of course, death during prolonged exposure (Zhu, 2007).
1.7.
Enzymatic Activity
Enzymatic activity as glutathione reductase (GR), ascorbate peroxidase (APX), catalase (CAT) and superoxide dismutase (SOD) are also extremely important to support our search of genotypes resistant to drought stress. It will help to elucidate if the plants are under stress.
Introduction
2013/2014
10
Glutathione reductase is important to scavenge and remove these toxic products before cellular damage occurs because it plays an essential role in the protection of chloroplasts against oxidative damage by oxidation of essential thiol groups, inactivating these enzymes (Gamble and Burke, 1984). This enzyme along with the other ones provide highly efficient machinery for detoxifying O2- and H
2O2. For example, the balance between SODs and the different H2O2 scavenging enzymes in cells is considered to be crucial in determining the steady-state level of O2− and H2O2 (Hakeem and Ahmad, 2012). SOD is the primary scavenger, which converts O2- to H2O2 and then is eliminated by APX in association with GR, which helps in regeneration of ascorbic acid (AA). H2O2 is also scavenged by CAT, though the enzyme is less efficient than APX/GR system (Sairam and Srivastava, 2002). High concentrations of these enzymes will mean that plants are under stress.
Materials and Methods
2013/2014
11
2.
Materials and Methods
All experiments were conducted on Greenhouse of Faculty of Engineering and Natural Sciences of Sabancı University, Tuzla/Istanbul, Turkey (40°53'26¨N/29°22'42¨E). The soil used was collected from Central Anatolia region of Turkey. All experiments were performed between January and July of 2014.
All plants were grown in pots with soil from Central Anatolia of Turkey (39o90’N 35o00’E). This soil is characterized as highly calcareous and semi-arid, because this area is the driest region in Turkey, with an annual precipitation of 325 mm (Cakmak et al., 1996). Additionally, these soils also face nutrients deficiency (Bagci et al., 2007; Cakmak, 2008).
Adana99 was used as reference genotype was because is one of the most used seeds in Anatolian soil, due to have better growth rates and high yields in this type field (Mazid et al., 2009).
2.1.
Plant culture and treatments
2.1.1. 1st Experiment
Eight spelt wheat genotypes (Sp2, Sp41, Sp492, Sp563, Sp732, Sp757, Sp804 and Sp912) and one cultivar of modern wheat (Adana99), used as reference genotype, were selected to screen them for drought tolerance. Two different treatments (drought tolerance and control) were formed and each genotype were cultivated in 3 pots (triplicate) by using about 10 seeds per pot. Previously, each pot was filled with about 2.2Kg of soil enriched with 200 ppm of N, 100 ppm of P, 30 ppm of K, 5 ppm of Zn and 5 ppm of Fe. The water supply was reduced from 70% to 30% of field capacity after 3 weeks of germination. The whole duration of this experiment, since sown till harvest was 50 days.
2.1.2. 2nd Experiment
Materials and Methods
2013/2014
12
2.1.3. 3rd Experiment
Eight spelt wheat genotypes (Sp41, Sp67, Sp69, Sp92, Sp96, Sp563, Sp732 and Sp912) and one cultivar of modern wheat (Adana99), used as reference genotype, were selected to screen them for drought tolerance. The whole procedure was identical to the second experiment. The whole duration of this experiment, since sown till harvest was 30 days.
2.2.
Determination of Dry Matter Production
After harvesting, all plants from each pot (sample) were washed with water, placed in paper bags and storage at 55oC, during 1 week. Then, each sample was weighed (Sartorius CP3202S, d=0.01g) to determination of dry matter.
2.3.
Determination of Mineral Nutrients
Whole shoot and root samples were dried at 70 °C. All samples were milled to a fine powders in an agate vibrating cup mill (Pulverisette 9; Fritsch GmbH; Germany) during around 1 minute at 750rpm, digested and sent to ICP analysis for determination of macro (K, Ca, Na, P, S and Mg) and micronutrients (Zn, Fe, Mn, Cu, B and Al).
To digest, each sample were weighed (0.30g ± 0.10g) and transferred to a digestive tube, which was filled with 2mL of 30% H2O2 and 5mL of 65% HNO3 and then all samples were acid digested in closed-vessel microwave system (MarsExpress; CEM Corp., Matthews, NC, USA). After this process, 13mL of double-deionized water were added in each tube to brought up the volume of 20 mL and then all samples were filtered and storage. A blank was added to our set of samples, and also a reference of Tomato Leaf (NIST 1573a) (0.20g ± 0.00g).
Materials and Methods
2013/2014
13
2.4.
Determination of Enzymatic Activity
A sample of approximately 0.5g (Sartorius CP3202S, d=0.01g) of fresh leaves were collected from each pot and kept at -80oC. All samples were milled with help of liquid nitrogen and quartz powder in a porcelain mortar. Then, 5 mL of 50 mM potassium phosphate (K-P) buffer solution was added to the samples. The K-P buffer was prepared by mixing 50 mM KH2PO4 and 50 mM K2HPO4 and the pH was adjusted to 7.6. After, 0.1 mM EDTATitriplex-III was added to this mixture for the homogenization step. The homogenates were then centrifuged at 15000g for 30 min, and the supernatants were used for protein and enzyme analysis. Protein concentrations in the crude extracts were measured by using the Bradford assay as described by Bradford (1976). SOD activity was measured by a slightly modified version of the photochemical method described by Giannopolitis and Ries (1977). This assay is based on the inhibition of the photochemical reduction of p-nitro blue tetrazolium chloride (NBT) by SOD and its spectroscopic measurement at 560 nm. One tube of reaction mixture contains 500 μl 50 mM Na2CO3, 500 μL 12 mM
L-methionine, 500 μL 75 μM NBT and 500 μL 2 μM riboflavin as well as enzyme extracts (50-150
μL). The total volume was brought up to 5 ml with K-P (pH 7.6) containing 0.1 mM Na-EDTA. The reaction was started by adding the riboflavin to the mixture and placing the vials under the lights in growth chamber for about 8 min. One unit of SOD activity is defined as the SOD activity that results in a 50 % decrease in the NBT reduction. Glutathione reductase activity was determined by recording the oxidation of nicotinamide adenine dinucleotide phosphate (NADPH) at 340 nm according to Foyer and Halliwell (1976) with a few modifications. The 1 mL reaction mixture
consisted of 100 μL of 0.5 mM oxidized glutathione (GSSG), 100 μL of 0.12 mM NADPH, 50-150
μL of the enzyme extract and 650-750 μl of 50 mM K-P buffer (pH 7.6) with 0.1 mM Na-EDTA. Results were adjusted for the non-enzymatic oxidation of NADPH by observing the decrease of absorbance at 340 nm in the absence of GSSG. APX activity was measured according to Nakano and Asada (1981) by monitoring the decrease in absorbance of ascorbic acid at 290 nm. The 1 mL reaction mixture contained, 100 μL of 12 mM H2O2, 100 μL of 0.25mM ascorbic acid, 50-150
Results and Discussions
2013/2014
15
3.
Results and Discussions
3.1.
1
stExperiment
After submit the genotypes to drought stress, morphologically it was quite easy to choose which ones were the best candidates as stress tolerant plant. For the first experiment, the genotype Sp41 and Sp757 were the better ones under stress, on the other hand, the two worst were Sp563 and Sp732.
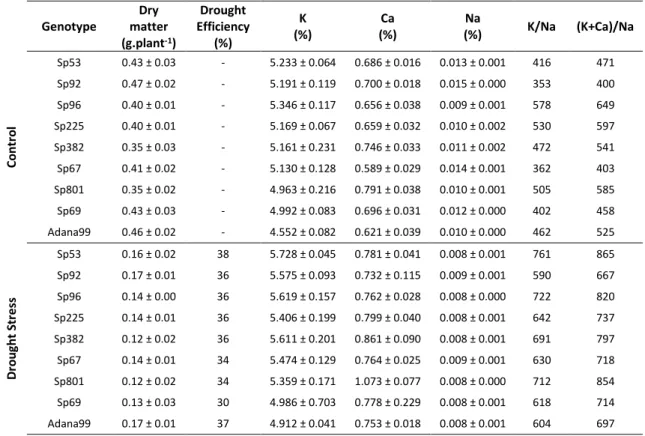
In the following table (Table 3.1) we can see the results of mineral content from ICP analysis for K, Ca and Na and the respective ratios as well as the drought efficiency:
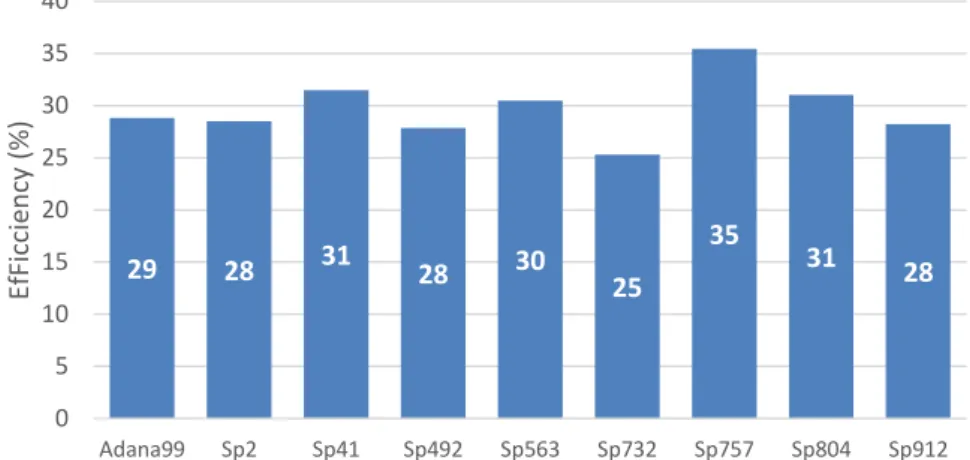
Drought efficiency was calculated by dividing the dry matter of drought stress plants, by the dry matter of control plants. Genotypes were ordered by drought efficiency and Adanna99 was placed last.
For a better interpretation of the results, the chart with efficiency was drawn as it can be seen in Fig.3.1:
Genotype
Dry matter (g.plant-1)
Drought Efficiency (%) K (%) Ca (%) Na
(%) K/Na (K+Ca)/Na
C o n tr o l
Sp757 1.25 ± 0.26 - 5.144 ± 0.100 0.615 ± 0.038 0.021 ± 0.003 243 272
Sp41 1.17 ± 0.11 - 5.247 ± 0.200 0.669 ± 0.077 0.027 ± 0.002 196 221
Sp804 1.46 ± 0.31 - 4.471 ± 0.333 0.748 ± 0.143 0.053 ± 0.002 85 99
Sp563 1.08 ± 0.29 - 5.308 ± 0.198 0.721 ± 0.064 0.018 ± 0.002 297 337
Sp2 1.18 ± 0.16 - 5.222 ± 0.160 0.614 ± 0.039 0.014 ± 0.002 363 406
Sp492 1.07 ± 0.16 - 5.559 ± 0.174 0.730 ± 0.046 0.031 ± 0.007 179 203
Sp912 1.01 ± 0.02 - 5.016 ± 0.235 0.648 ± 0.005 0.011 ± 0.001 444 501
Sp732 1.13 ± 0.17 - 5.126 ± 0.475 0.738 ± 0.094 0.013 ± 0.003 388 443
Adana99 1.17 ± 0.07 - 5.083 ± 0.351 0.684 ± 0.048 0.012 ± 0.002 419 475
D ro u g h t S tr e ss
Sp757 0.44 ± 0.09 35 5.619 ± 0.144 0.802 ± 0.016 0.028 ± 0.002 316 361
Sp41 0.37 ± 0.01 31 5.855 ± 0.221 0.956 ± 0.157 0.026 ± 0.006 228 265
Sp804 0.45 ± 0.23 31 6.226 ± 0.007 0.825 ± 0.079 0.019 ± 0.000 329 373
Sp563 0.33 ± 0.04 30 6.132 ± 0.073 1.099 ± 0.035 0.023 ± 0.005 267 314
Sp2 0.34 ± 0.04 28 5.825 ± 0.068 0.845 ± 0.021 0.022 ± 0.001 267 305
Sp492 0.30 ± 0.05 28 6.033 ± 0.059 1.041 ± 0.051 0.025 ± 0.003 242 284
Sp912 0.28 ± 0.05 28 5.750 ± 0.131 0.863 ± 0.056 0.023 ± 0.003 248 285
Sp732 0.29 ± 0.07 25 5.839 ± 0.025 1.069 ± 0.036 0.023 ± 0.003 249 295
Adana99 0.34 ± 0.03 29 5.064 ± 0.137 0.742 ± 0.021 0.018 ± 0.001 286 328
Table 3.1 – Mineral composition of K, Ca and Na from all genotypes studied of the first experiment, as well as, drought efficiency and K/Na and (K+Ca)/Na ratios with respective standard deviation (STD).
Results and Discussions
2013/2014
16
419 363 196 179 297 388 243 85 444 286 267228 242 267 249
316 329 248 0 50 100 150 200 250 300 350 400 450
Adana99 Sp2 Sp41 Sp492 Sp563 Sp732 Sp757 Sp804 Sp912
K/Na
Control Drought Stress
Fig. 3.2 – K/Na ratio from all genotypes tested from the first experiment under drought stress and control conditions.
These results shows that the genotypes Sp41 (31%), Sp563 (30%), Sp757 (35%) and SP804 (31%) have better efficiency when compared with the reference genotype Adana99. However only
these results doesn’t prove that the previously spelt genotypes hold some traits that confer
resistance to drought stress.
After determination of mineral content, the ratio K/Na was calculated (Fig.3.2):
The previously image clearly shows the different response of the same genotype when submitted to stress. Under control conditions (Green Bars) only the genotype Sp912 have better ratio than reference genotype, on the other hand, when the same genotypes were submitted to drought stress (Blue Bars) a totally different scenario happened. This time the genotypes Sp757 and Sp804 are the ones that have better ratio than reference genotype. This result enforces what was said earlier about the genotype Sp757 and Sp804 being better than modern wheat when submitted to drought stress. Although, despite the genotypes Sp41 and Sp563 have better drought efficiency than modern wheat, the K/Na ratio was lower.
29 28 31 28 30 25
35 31 28 0 5 10 15 20 25 30 35 40
Adana99 Sp2 Sp41 Sp492 Sp563 Sp732 Sp757 Sp804 Sp912
Ef Fi cci en cy (% )
Results and Discussions
2013/2014
17
A high cytosolic K/Na ratio is very important is because intracellular K+ and Na+ homeostasis is important for the activities of many cytosolic enzymes, and for maintaining membrane potential and an appropriate osmoticum for cell volume regulation (Zhu, 2003). The results shows that Na+ contents increased under drought conditions, and this increase results in a decrease of K/Na ratio in all genotypes studied (Fig. 3.2).In 2003, Zhu described that high concentration of minerals as Na+ due to low concentration of water disrupts K+ uptake by root cells, and when Na+ enter in the cells and accumulates to high levels, it becomes toxic to enzymes. To prevent growth cessation or cell death, excessive Na+ has to be expelled or compartmentalized in the vacuole. This compartmentation system not only lowers Na+ concentration in the cytoplasm but also contributes to osmotic adjustment to maintain water uptake from saline solutions. Other organelles, such as plastids and mitochondria, may also accumulate some Na+ (Zhu, 2003).
Plants limiting the uptake of toxic ions or maintaining normal nutrient ion contents could show greater tolerance (Khan et al., 2009) which is the case of some genotypes already mentioned in the present study. Also, some plants have better capacity to close stomata under drought stress, which permits to reduce the losses of water by transpiration. Abscicic acid (ABA) is the hormone response, besides other functions, to open and close stomata (Trejo et al., 1993). ABA have a crucial regulatory function under drought environments, so plants that are have higher capacity to sense drought and produce ABA are more adapted to dry soils, because plants response to water deficit with the accumulation of ABA in leaves, which induces stomatal closure and inhibits opening (Wilkinson and Davies 2002). This is a fundamental process in the plant’s capacity to maintain plant water status under conditions of low soil moisture content and high evaporative demand.
Results and Discussions
2013/2014
18
However, due to problems of seed germination in this experiment, it is not possible to state with certainty that the results reflect reality. For this reason in the second experiment all seeds were vernalized before sowing. Other genotypes were selected for this experiment to extend our range of genotypes.
3.2.
2
ndExperiment
In the second experiment, morphologically, the best two genotypes chosen were Sp92 and Sp96 and the worst were Sp67 and Sp801.
In the following table (Table 3.3) we can see the results of mineral content from ICP analysis for K, Ca and Na and the respective ratios as well as the drought efficiency for the second experiment:
Genotype P S Mg Zn Fe Mn Cu B Al
(%) (mg.kg-1)
C o n tr o l
Sp757 0.544 ± 0.074 0.390 ± 0.034 0.180 ± 0.010 40 ± 3 51 ± 5 96 ± 14 9 ± 0 21 ± 3 9 ± 2
Sp41 0.429 ± 0.038 0.380 ± 0.012 0.187 ± 0.015 47 ± 0 53 ± 6 126 ± 14 9 ± 1 20 ± 2 9 ± 1
Sp804 0.422 ± 0.029 0.376 ± 0.026 0.164 ± 0.003 42 ± 1 43 ± 4 113 ± 19 7 ± 0 19 ± 0 8 ± 1
Sp563 0.559 ± 0.152 0.422 ± 0.064 0.198 ± 0.022 53 ± 11 50 ± 4 118 ± 12 9 ± 1 19 ± 3 10 ± 0
Sp2 0.425 ± 0.061 0.386 ± 0.014 0.176 ± 0.003 44 ± 2 49 ± 2 111 ± 12 8 ± 1 17 ± 3 8 ± 1
Sp492 0.473 ± 0.030 0.398 ± 0.039 0.201 ± 0.005 52 ±3 49 ± 2 123 ± 6 9 ± 0 19 ± 0 8 ± 2
Sp912 0.412 ± 0.042 0.395 ± 0.026 0.175 ± 0.008 41 ± 2 51 ± 2 103 ± 6 8 ± 1 19 ± 1 10 ± 1
Sp732 0.507 ± 0.060 0.449 ± 0.026 0.201 ± 0.025 51 ± 7 49 ± 4 117 ± 15 9 ± 1 19 ± 2 6 ± 1
Adana99 0.481 ± 0.055 0.378 ± 0.012 0.183 ± 0.012 45 ± 6 53 ± 2 116 ± 9 9 ± 0 19 ± 1 10 ± 1
D ro u g h t S tr e ss
Sp757 0.394 ± 0.015 0.371 ± 0.025 0.185 ± 0.015 37 ± 1 55 ± 2 130 ± 23 9 ± 0 15 ± 1 8 ± 2
Sp41 0.364 ± 0.020 0.356 ± 0.023 0.198 ± 0.019 45 ± 3 55 ± 3 157 ± 9 11 ± 1 17 ± 3 10 ± 2
Sp804 0.381 ± 0.008 0.359 ± 0.005 0.194 ± 0.002 51 ± 4 57 ± 3 131 ± 13 10 ± 0 15 ± 2 10 ± 2
Sp563 0.398 ± 0.024 0.435 ± 0.015 0.223 ± 0.005 44 ± 3 56 ± 3 151 ± 7 10 ± 0 19 ± 3 9 ± 2
Sp2 0.322 ± 0.006 0.359 ± 0.017 0.187 ± 0.003 33 ± 0 52 ± 1 130 ± 5 8 ± 0 16 ± 1 10 ± 2
Sp492 0.371 ± 0.015 0.362 ± 0.021 0.220 ± 0.015 40 ± 1 55 ± 2 156 ± 21 9 ± 0 16 ± 1 10 ± 0
Sp912 0.348 ± 0.006 0.386 ± 0.007 0.188 ± 0.011 42 ± 1 61 ± 2 136 ± 20 10 ± 1 13 ± 3 13 ± 2
Sp732 0.378 ± 0.023 0.393 ± 0.030 0.225 ± 0.013 41 ± 1 53 ± 1 149 ± 14 11 ± 0 17 ± 2 10 ± 1
Adana99 0.380 ± 0.018 0.326 ± 0.013 0.179 ± 0.006 43 ± 2 52 ± 6 149 ± 20 9 ± 0 14 ± 0 7 ± 0
Results and Discussions
2013/2014
19
Genotype
Dry matter (g.plant-1)
Drought Efficiency (%) K (%) Ca (%) Na
(%) K/Na (K+Ca)/Na
C o n tr o l
Sp53 0.43 ± 0.03 - 5.233 ± 0.064 0.686 ± 0.016 0.013 ± 0.001 416 471
Sp92 0.47 ± 0.02 - 5.191 ± 0.119 0.700 ± 0.018 0.015 ± 0.000 353 400
Sp96 0.40 ± 0.01 - 5.346 ± 0.117 0.656 ± 0.038 0.009 ± 0.001 578 649
Sp225 0.40 ± 0.01 - 5.169 ± 0.067 0.659 ± 0.032 0.010 ± 0.002 530 597
Sp382 0.35 ± 0.03 - 5.161 ± 0.231 0.746 ± 0.033 0.011 ± 0.002 472 541
Sp67 0.41 ± 0.02 - 5.130 ± 0.128 0.589 ± 0.029 0.014 ± 0.001 362 403
Sp801 0.35 ± 0.02 - 4.963 ± 0.216 0.791 ± 0.038 0.010 ± 0.001 505 585
Sp69 0.43 ± 0.03 - 4.992 ± 0.083 0.696 ± 0.031 0.012 ± 0.000 402 458
Adana99 0.46 ± 0.02 - 4.552 ± 0.082 0.621 ± 0.039 0.010 ± 0.000 462 525
D ro u g h t S tr e ss
Sp53 0.16 ± 0.02 38 5.728 ± 0.045 0.781 ± 0.041 0.008 ± 0.001 761 865
Sp92 0.17 ± 0.01 36 5.575 ± 0.093 0.732 ± 0.115 0.009 ± 0.001 590 667
Sp96 0.14 ± 0.00 36 5.619 ± 0.157 0.762 ± 0.028 0.008 ± 0.000 722 820
Sp225 0.14 ± 0.01 36 5.406 ± 0.199 0.799 ± 0.040 0.008 ± 0.001 642 737
Sp382 0.12 ± 0.02 36 5.611 ± 0.201 0.861 ± 0.090 0.008 ± 0.001 691 797
Sp67 0.14 ± 0.01 34 5.474 ± 0.129 0.764 ± 0.025 0.009 ± 0.001 630 718
Sp801 0.12 ± 0.02 34 5.359 ± 0.171 1.073 ± 0.077 0.008 ± 0.000 712 854
Sp69 0.13 ± 0.03 30 4.986 ± 0.703 0.778 ± 0.229 0.008 ± 0.001 618 714
Adana99 0.17 ± 0.01 37 4.912 ± 0.041 0.753 ± 0.018 0.008 ± 0.001 604 697
Table 3.3 – Mineral composition of K, Ca and Na from all genotypes studied of the second experiment, as well as, drought efficiency and K/Na and (K+Ca)/Na ratios with respective STD.
Once again, for a better interpretation of the results, the chart with efficiency was drawn and
it’s shown below in Fig. 3.3:
This time, the results shows that only the genotype Sp53 (38%) have a better efficiency when compared with the reference genotype.
37 38
34
30
36 36 36 36 34
0 5 10 15 20 25 30 35 40
Adana99 Sp53 Sp67 Sp69 Sp92 Sp96 Sp225 Sp382 Sp801
Ef fi ci en cy (% )
Fig. 3.3 – Drought efficiency from second experiment.
Results and Discussions
2013/2014
20
Again, after determination of mineral content, the ratio K/Na was calculated and it is shown on the next figure (Fig. 3.4):
This time if we take a look in Fig. 3.4, under control conditions only the genotype Sp92 have lower K/Na ration than reference genotype. Under drought stress conditions the genotypes Sp53, Sp96 and Sp801 got a higher score however the genotype 801 have a low drought efficiency as it was shown in Fig. 3.3. Comparing this results with the previous, the genotypes Sp53 and Sp96 could be a better genotypes under drought stress when compared with modern wheat.
It is known that drought stress lead to cellular dehydration, which causes osmotic stress and removal of water from the cytoplasm, resulting in a reduction of the cytosolic and vacuolar volumes (Bartels and Sunkar, 2005). The major difference between the low-water-potential environments caused by salinity versus drought is the total amount of water available. During drought, a finite amount of water can be obtained from the soil profile by the plant, decreasing soil water potential. In most saline environments, a large amount of water is at a constant, but under low water potential (Leksungnoen, 2012).
As in the previous experiment, the remaining Macro and Micronutrients were also analyzed. This time, such as occurred on drought efficiency, the results were not as good as expected as it can be seen in the Table 3.4:
462 416
362 402 353
578
530
472 505
604
761
630 618 590
722
642 691 712
0 100 200 300 400 500 600 700 800
Adana99 Sp53 Sp67 Sp69 Sp92 Sp96 Sp225 Sp382 Sp801
K/Na
Control Drought Stress
Results and Discussions
2013/2014
21
Genotype P S Mg Zn Fe Mn Cu B Al
(%) (mg.kg-1)
C o n tr o l
Sp53 0.384 ± 0.035 0.176 ± 0.003 0.362 ± 0.017 42 ± 1 60 ± 1 77 ± 3 9 ± 0 17 ± 3 11 ± 3
Sp92 0.376 ± 0.009 0.182 ± 0.005 0.399 ± 0.015 51 ± 2 53 ± 2 93 ± 2 8 ± 0 17 ± 3 5 ± 1
Sp96 0.450 ± 0.026 0.176 ± 0.004 0.367 ± 0.006 53 ± 1 59 ± 1 105 ± 3 10 ± 0 15 ± 1 6 ± 1
Sp225 0.460 ± 0.009 0.201 ± 0.006 0.379 ± 0.019 58 ± 8 61 ± 2 104 ± 6 10 ± 0 20 ± 1 6 ± 1
Sp382 0.410 ± 0.009 0.213 ± 0.006 0.435 ± 0.008 59 ± 2 61 ± 1 89 ± 3 10 ± 1 19 ± 3 7 ± 1
Sp67 0.398 ± 0.030 0.175 ± 0.008 0.369 ± 0.011 59 ± 5 59 ± 1 103 ± 6 10 ± 0 16 ± 2 6 ± 0
Sp801 0.501 ± 0.043 0.193 ± 0.004 0.377 ± 0.008 68 ± 4 59 ± 2 109 ± 3 10 ± 1 18 ± 2 7 ± 2
Sp69 0.474 ± 0.032 0.191 ± 0.006 0.348 ± 0.006 49 ± 1 56 ± 1 92 ± 3 9 ± 0 16 ± 2 5 ± 1
Adana99 0.450 ± 0.021 0.175 ± 0.008 0.374 ± 0.021 57 ± 3 47 ± 2 111 ± 8 8 ± 0 15 ± 1 5 ± 0
D ro u g h t S tr e ss
Sp53 0.309 ± 0.017 0.176 ± 0.005 0.338 ± 0.013 28 ± 3 62 ± 2 76 ± 2 9 ± 0 16 ± 1 18 ± 2
Sp92 0.283 ± 0.011 0.172 ± 0.002 0.370 ± 0.011 33 ± 2 56 ± 4 87 ± 4 8 ± 0 18 ± 4 13 ± 4
Sp96 0.326 ± 0.005 0.161 ± 0.012 0.346 ± 0.020 35 ± 6 61 ± 2 97 ± 22 9 ± 0 17 ± 2 13 ± 4
Sp225 0.312 ± 0.009 0.184 ± 0.007 0.353 ± 0.014 39 ± 2 58 ± 1 103 ± 5 9 ± 0 19 ± 1 10 ± 1
Sp382 0.314 ± 0.003 0.196 ± 0.011 0.402 ± 0.014 39 ± 1 64 ± 5 90 ± 7 10 ± 0 17 ± 1 13 ± 9
Sp67 0.316 ± 0.013 0.176 ± 0.007 0.340 ± 0.013 42 ± 1 61 ± 1 111 ± 3 9 ± 0 17 ± 1 10 ± 1
Sp801 0.315 ± 0.010 0.175 ± 0.012 0.313 ± 0.009 38 ± 3 56 ± 4 101 ± 4 9 ± 1 19 ± 0 12 ± 6
Sp69 0.444 ± 0.198 0.168 ± 0.023 0.312 ± 0.008 27 ± 6 49 ± 9 83 ± 19 8 ± 2 19 ± 6 8 ± 0
Adana99 0.337 ± 0.012 0.170 ± 0.004 0.315 ± 0.014 36 ± 0 49 ± 2 92 ± 3 8 ± 0 16 ± 1 10 ± 1
Table 3.4 – Mineral composition from all Spelt genotypes studied in the second experiment and Adana99, with respective STD
For better evaluation of our results, the Efficiency vs K/Na chart was calculated from both experiments and it’s shown in Fig. 3.5 and Fig. 3.6. This can elucidate us to conclude which genotypes might have better yields under drought conditions and also if they’re more adaptive than modern wheat (Adana99) to survive in these conditions.
Adana99 Sp2 Sp41 Sp492 Sp563 Sp732 Sp757 Sp804 Sp912 24 26 28 30 32 34 36
220 240 260 280 300 320 340
Ef fi ci en cy (% ) K/Na
Results and Discussions
2013/2014
22
The previous charts help us to conclude which genotypes could come to be more resistant under drought stress. Using this information we can say that from the first experiment genotypes Sp804 and Sp757 are good candidates, and from the second experiment the genotypes Sp53 and Sp96 are the ones that might be more resistant under drought stress.
3.3.
3
rdExperiment
For the third experiment, we selected the best two and worst genotypes from the previous experiments. The genotypes selected as good were the Sp96 and Sp563 and as bad were Sp41, Sp67, Sp69, Sp92, Sp732 and Sp912.
Unfortunately the genotypes Sp53, Sp757 and Sp804 which were the better candidates as drought tolerant plants, as it can be seen in our results, couldn’t be selected for this experiment due to the lack of stock of seeds in our bank of seeds. We hope that in future experiments we can repeat these tests using those genotypes.
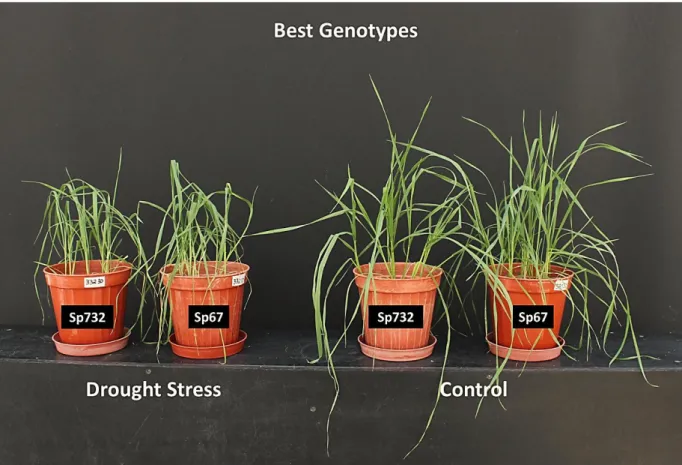
In this experiment, after morphological analysis we concluded that the worst genotypes under drought stress were the Sp41 and Sp96 and the best genotypes were the Sp67 and Sp732. In the next figures it is possible to analyze the genotypes under drought stress with the control conditions and compare the good ones with the bad ones (Fig. 3.7; Fig. 3.8; Fig. 3.9):
Adana99 Sp53
Sp67
Sp69
Sp92 Sp225 Sp382 SP96
Sp801 28 30 32 34 36 38 40
580 600 620 640 660 680 700 720 740 760 780
Ef fi ci en cy (% ) K/Na
Results and Discussions
2013/2014
23
Fig. 3.8 – Comparison of the best genotypes under drought stress with the respective controls.
Results and Discussions
2013/2014
24
68
56 56 61
80
49
61 60 64
0 10 20 30 40 50 60 70 80 90
Adana99 Sp41 Sp67 Sp69 Sp92 Sp96 Sp563 Sp732 Sp912
Ef
fi
ci
en
cy
(%
)
Fig. 3.10 – Drought efficiency results from the third experiment.
In the Fig. 3.7 we can clearly see that under drought stress the leaves become more yellow, thinner and wrinkled when compared with the control, on the other hand, the difference between the two best genotypes under drought stress with the control (Fig. 3.8) are not so extreme. The leaves are thicker and more vigorous of the genotypes Sp67 and Sp732 and this difference between good and bad genotypes under stress is more notable in the Fig. 3.9. However, as we said in the previous experiments, only with morphological analyzes it is not possible to conclude if those genotypes really have better yields under drought stress conditions.
Again, as in the first and second experiment, the efficiency was calculated (Fig. 3.10):
Results and Discussions
2013/2014
25
Using the previous results, we can affirm that the genotypes Sp92 (80%) and Sp912 (64%) have the better efficiency under drought stress, on the other hand, the genotypes Sp41 (56%), Sp67 (56%) and Sp96 (49%) have the lower efficiency. For the worst genotypes, the results coincide with the morphological analyzes, but for the best the results are not the same. An interesting thing that was noted was that the two genotypes with the better efficiency in this experiment had the lowest efficiency in the previous experiments. This fact can be explain with the duration of the experiments. In the first experiment the number of days under drought stress was longer than in the third experiment, and also in the first experiment we didn’t proceed to vernalization. The reason why the efficiencies are so high in this experiment is because of the short period of drought stress applied. It is important to study drought stress during long periods because some plants can tolerate better drought stress than others but only in short periods of time, and that may have happened in our experience.As in the previous experiments, the following table (Table 3.5) shows the results of mineral content from ICP analysis for K, Ca and Na and the respective ratios as well as the drought efficiency:
Table 3.5 – Mineral composition of K, Ca and Na from all genotypes studied of the third experiment, as well as, drought efficiency and K/Na and (K+Ca)/Na ratios with respective STD
Genotype
Dry matter (g.plant-1)
Drought Efficiency (%) K (%) Ca (%) Na
(%) K/Na (K+Ca)/Na
C o n tr o l
Sp92 0.28 ± 0.03 - 5.053 ± 0.718 0.530 ± 0.104 0.008 ± 0.002 603 667
Sp912 0.29 ± 0.03 - 5.524 ± 0.094 0.573 ± 0.025 0.009 ± 0.002 606 669
Sp563 0.27 ± 0.03 - 5.282 ± 0.185 0.581 ± 0.042 0.011 ± 0.001 475 528
Sp69 0.30 ± 0.05 - 5.241 ± 0.135 0.559 ± 0.039 0.007 ± 0.001 733 811
Sp732 0.36 ± 0.11 - 4.790 ± 0.613 0.647 ± 0.121 0.011 ± 0.002 451 712
S67 0.36 ± 0.09 - 5.290 ± 0.098 0.521 ± 0.035 0.007 ± 0.000 747 820
S41 0.28 ± 0.03 - 5.103 ± 0.118 0.631 ± 0.031 0.008 ± 0.001 640 720
Sp96 0.32 ± 0.02 - 5.460 ± 0.029 0.507 ± 0.025 0.007 ± 0.001 730 798
Adana99 0.27 ± 0.06 - 4.653 ± 0.042 0.507 ± 0.038 0.008 ± 0.001 556 617
D ro u g h t S tr e ss
Sp92 0.22 ± 0.02 80 5.727 ± 0.085 0.549 ± 0.021 0.008 ± 0.001 678 743
Sp912 0.19 ± 0.02 64 6.078 ± 0.080 0.617 ± 0.093 0.009 ± 0.001 708 779
Sp563 0.17 ± 0.02 61 5.824 ± 0.058 0.645 ± 0.055 0.009 ± 0.001 618 687
Sp69 0.18 ± 0.02 61 5.585 ± 0.184 0.570 ± 0.054 0.009 ± 0.001 608 670
Sp732 0.22 ± 0.02 60 5.603 ± 0.112 0.637 ± 0.048 0.009 ± 0.001 610 679
Sp67 0.20 ± 0.04 56 5.731 ± 0.138 0.511 ± 0.060 0.010 ± 0.001 592 645
Sp41 0.16 ± 0.03 56 5.535 ± 0.106 0.691 ± 0.057 0.009 ± 0.001 646 727
Sp96 0.16 ± 0.01 48 6.007 ± 0.246 0.560 ± 0.054 0.008 ± 0.001 735 803
Results and Discussions
2013/2014
26
With mineral contents obtained from ICP analyses showed in the previous table, K/Na ratio was calculated (Fig 3.11):
This time, the highest K/Na ratio under stress belongs to Sp96 and Sp912, and the lowest to Sp67 and Sp69. These results together with the previous proves that the genotypes Sp67 and Sp69 are not good under drought conditions, on the other hand, the genotypes Sp92 and Sp912, and the genotype Sp96, which were the worse and better respectively in the previous experiments, this time shows the best results for efficiency and K/Na ratio, as we can see in the Fig. 3.12:
556 640 747 733 603 730 475 451 606 688 646
592 608 678
735 618 610 708 0 100 200 300 400 500 600 700 800
Adana99 Sp41 Sp67 Sp69 Sp92 Sp96 Sp563 Sp732 Sp912
K/Na
Control Drought Stress
Adana99 Sp41 Sp67 Sp69 Sp92 Sp96 Sp563 Sp732 Sp912 45 50 55 60 65 70 75 80 85
580 600 620 640 660 680 700 720 740
Ef fi ci en cy (% ) K/Na
Fig. 3.12 – Efficiency vs K/Na from the results from the third experiment.
Results and Discussions
2013/2014
27
As we referred before, these results are slightly controversial and it is not possible for us conclude certainty about which genotypes are more adapted to drought stress conditions. The reason why could be because of vernalization and/or the duration of stress on these experiments.However, there is a strong evidence in these results that spelt is a more adapted type of wheat under drought conditions. One more time, the genotypes Sp92, Sp96 and Sp912 are candidates to the more tolerant genotypes under these conditions.
The following table (Table 3.6) presents the remaining macronutrients and micronutrients studied in this experiments as we did before:
Table 3.6 – Mineral composition from all Spelt genotypes studied in the third experiment and Adana99, with respective STD.
With the previous table, we can see that in general spelt is quantitatively richer than Adana99 as it was already mentioned and concluded in this work.
Genotype P S Mg Zn Fe Mn Cu B Al
(%) (mg.kg-1)
C o n tr o l
Sp92 0,422 ± 0.065 0,335 ± 0.042 0,155 ± 0.017 74 ± 9 59 ± 8 106 ± 23 10 ± 1 12 ± 1 9 ± 1
Sp912 0,417 ± 0.037 0,347 ± 0.014 0,162 ± 0.011 81 ± 7 55 ± 1 102 ± 10 10 ± 0 15 ± 2 5 ± 1
Sp563 0,449 ± 0.013 0,366 ± 0.016 0,180 ± 0.012 94 ± 7 55 ± 4 110 ± 4 10 ± 1 13 ± 1 7 ± 1
Sp69 0,449 ± 0.013 0,305 ± 0.008 0,170 ± 0.007 58 ± 3 59 ± 1 98 ± 10 10 ± 1 14 ± 2 12 ± 2
Sp732 0,414 ± 0.034 0,355 ± 0.042 0,174 ± 0.014 91 ± 10 48 ± 6 116 ± 7 12 ± 1 14 ± 3 6 ± 1
Sp67 0,409 ± 0.017 0,307 ± 0.011 0,143 ± 0.006 67 ± 2 64 ± 12 104 ± 13 10 ± 1 14 ± 1 12 ± 1
Sp41 0,375 ± 0.016 0,311 ± 0.006 0,151 ± 0.013 67 ± 5 63 ± 6 104 ± 12 10 ± 1 16 ± 1 14 ± 3
Sp96 0,473 ± 0.036 0,322 ± 0.011 0,153 ± 0.006 68 ± 5 59 ± 3 104 ± 15 10 ± 0 13 ± 1 7 ± 2
Adana99 0,462 ± 0.031 0,359 ± 0.021 0,154 ± 0.006 80 ± 5 50 ± 2 120 ± 5 10 ± 1 15 ± 3 6 ± 1
D ro u g h t S tr e ss
Sp92 0,393 ± 0.012 0,355 ± 0.016 0,152 ± 0.004 68 ± 4 59 ± 1 103 ± 11 9 ± 1 16 ± 3 6 ± 1
Sp912 0,418 ± 0.039 0,369 ± 0.005 0,153 ± 0.004 70 ± 1 59 ± 3 88 ± 8 10 ± 0 17 ± 3 9 ± 1
Sp563 0,397 ± 0.022 0,381 ± 0.012 0,168 ± 0.004 77 ± 3 54 ± 1 106 ± 19 10 ± 1 17 ± 3 4 ± 1
Sp69 0,423 ± 0.059 0,300 ± 0.010 0,149 ± 0.011 50 ± 3 55 ± 3 85 ± 18 9 ± 0 15 ± 2 5 ± 0
Sp9732 0,402 ± 0.029 0,375 ± 0.023 0,174 ± 0.012 82 ± 3 53 ± 2 114 ± 19 12 ± 1 15 ± 2 5 ± 1
Sp67 0,404 ± 0.017 0,321 ± 0.009 0,144 ± 0.005 55 ± 4 58 ± 1 107 ± 7 9 ± 1 15 ± 1 6 ± 1
Sp41 0,357 ± 0.011 0,310 ± 0.006 0,157 ± 0.004 67 ± 6 54 ± 1 119 ± 4 9 ± 0 16 ± 2 7 ± 1
Sp96 0,439 ± 0.013 0,342 ± 0.009 0,141 ± 0.008 60 ± 4 57 ± 2 95 ± 6 10 ± 0 10 ± 1 6 ± 1
Results and Discussions
2013/2014
28
As expected, under drought stress, protein concentration decreases because the decrease in osmotic potential under drought stress reflects the increased hydrolysis of macromolecules such as proteins (Chutia and Borah, 2012). As suggested by earlier workers, protein degradation might be the result of increased activity of protease or other catabolic enzymes, which were activated under drought stress, or due to fragmentation of proteins due to toxic effects of reactive oxygen species resulting in reduced protein content. A decrease in the protein concentration would be a typical symptom of oxidative stress and has frequently been observed in drought stressed plants (Mafakheri et al., 2011). On the other hand, under drought stress, other proteins called dehydrins are also synthesized in response to drought stress. The dehydrin family of proteins accumulates in a wide range of plant species under dehydration stress (Mohammadkhani and Heidari, 2008). Dehydrins, CAT, GR, SOD, APX and other proteins are produced in high quantities under drought stress
Based on this, it is expected that the most tolerant genotypes to drought stress are the ones which had a higher protein concentration under stress compared with control conditions (Table 3.7). For enzymatic activity tests we selected the genotypes Sp41, Sp67, Sp92, Sp96 and Sp912 for being the best/worst genotypes under drought stress:
Table 3.7 – Protein concentration from the 5 selected genotypes studied on the third experiment.
Protein Concentration
(mg g-1 FW)
Condition Genotype Protein Concentration ± STD SE%
Control
Sp41 35.0 ± 4.5 13.0
Sp67 33.2 ± 6.7 20.3
Sp92 29.7 ± 2.1 7.2
Sp96 25.5 ± 1.8 6.9
Sp912 27.5 ± 4.4 16.1
Drought Stress
Sp41 32.3 ± 1.1 3.3
Sp67 34.5 ± 4.3 12.3
Sp92 32.8 ± 2.5 7.6
Sp96 28.0 ± 2.1 7.3
Results and Discussions
2013/2014
29
From the previous table we can see that under drought stress the genotype Sp92 and Sp912 has an increase of about 10% and 23% respectively of protein concentration, which could mean this genotype is more adapted to drought stress, producing high quantities of proteins responsible for drought tolerance and subsequently maintaining normal cell activities. The remaining had a lower increase or even a decrease of protein concentration.Now, if we analyse individuality the activity of the main enzymes involved in drought response, there are an evidence again that the genotypes Sp92 and Sp912 are better adapted to drought conditions (Table 3.8):
Table 3.8 – SOD Activity from the 5 selected genotypes studied on the third experiment.
On the previous table (Table 3.8) we see that under stress SOD activity from all genotypes increases because the plant is under stress and as we said before, SOD is the primary scavenger, which means is the first enzyme to be activated under stress conditions. SOD converts O2- to H2O2 which are eliminated by APX in association with GR, so if there are a high production of this enzyme could mean that plant will remove easily those toxic molecules under stress. The genotype Sp96 and Sp912 are the ones which had a higher increase, on the other hand the genotypes Sp67 and Sp92 had the lower.
The following tables shows the activities of GR, CAT and APX enzymes (Fig. 3.9, Fig. 3.10 and Fig. 3.11):
SOD Activity
(U g-1 FW)
Condition Genotype SOD Activity ± STD SE% Increased Activity%
Control
Sp41 44.0 ± 1.4 3.2 -
Sp67 46.2 ± 1.2 2.6 -
Sp92 45.0 ± 5.0 11.0 -
Sp96 40.8 ± 7.3 17.8 -
Sp912 43.3 ± 3.3 7.7 -
Drought Stress
Sp41 51.0 ± 1.7 3.2 15.9
Sp67 48.8 ± 1.4 2.8 5.6
Sp92 51.6 ± 1.3 2.6 14.7
Sp96 50.9 ± 1.3 2.6 24.8
Results and Discussions
2013/2014
30
Table 3.9 – GR Activity from the 5 selected genotypes studied on the third experiment.
GR Activity
(μmol [NADPH] g-1 FW min-1)
Condition Genotype GR Activity ± STD SE% Increased Activity%
Control
Sp41 22.3 ± 9.2 41.2 -
Sp67 16.3 ± 2.0 12.1 -
Sp92 15.2 ± 2.1 13.6 -
Sp96 11.7 ± 1.6 13.5 -
Sp912 12.9 ± 1.0 7.9 -
Drought Stress
Sp41 11.7 ± 4.1 34.8 - 47.5
Sp67 14.5 ± 3.8 26.2 - 11.0
Sp92 15.9 ± 2.2 14.1 4.6
Sp96 13.5 ± 2.6 19.6 15.4
Sp912 19.2 ± 2.2 11.6 48.8
Table 3.10 – CAT Activity from the 5 selected genotypes studied on the third experiment.
CAT Activity
(μmol H2O2 g-1 FW min-1)
Condition Genotype CAT Activity ± STD SE% Increased Activity%
Control
Sp41 2538 ± 749 30 -
Sp67 2758 ± 506 18 -
Sp92 2474 ± 492 20 -
Sp96 1969 ± 134 7 -
Sp912 1813 ± 142 8 -
Drought Stress
Sp41 2136 ± 337 16 - 15.8
Sp67 2717 ± 499 18 - 1.5
Sp92 2397 ± 435 18 - 3.1
Sp96 2065 ± 106 5 4.9
![Fig. 1.1 – The evolution of wheat from the prehistoric Stone Age grasses to modern macaroni wheat and bread wheat [1]](https://thumb-eu.123doks.com/thumbv2/123dok_br/16635222.740986/19.892.479.799.546.846/evolution-wheat-prehistoric-stone-grasses-modern-macaroni-wheat.webp)