OHL Assessment and Risk Evaluation
Based on Environmental and Inspection Data
Francisco Azevedo1, João Gomes-Mota2, Luís Campos-Pinto3, Nélio Machado4, and Susana de Almeida de Graaff5
1 [email protected] (corresponding author, +351-965149374), Assistant Professor - CENTRIA – Faculdade de Ciências
e Tecnologia – Universidade Nova de Lisboa, Quinta da Torre, 2829-516 CAPARICA, Portugal
2
[email protected] (+351-213473079), MSc, Engineer - Albatroz Engenharia, , Portugal
3 [email protected], Director, Engineer - REN – Rede Eléctrica Nacional, S.A., Portugal
4 [email protected], MSc, Engineer - REN – Rede Eléctrica Nacional, S.A., Portugal
5
[email protected], PhD, Engineer - TenneT TSO B.V., The Netherlands
Abstract
REN – Rede Eléctrica Nacional, S.A., Portuguese Transmission System Operator (TSO), has been using LiDAR technology
in their aerial inspections. The acquired three-dimensional data in this Power Line Maintenance System are automatically
processed, with support of the video inspections and geo-referenced systems. The national transmission grid was fully
characterized at span level with urbanization and vegetation growth rate indices.
The collection of historical data, together with the knowledge of asset characteristics and system operation conditions, is
structured in a generalized relational database, extended with a comprehensive set of different environmental,
meteorological and geographic data over the years.
A methodology to evaluate operational risk was developed, taking into account the probabilistic nature of contingencies and
their severity under specific operating conditions. Risk indices provide an insight to operators of the network state and of
the constraints that operators face. Different optimization tools are also being developed.
1
Introduction
Nowadays, the difficulty to build new assets, the increasing demands for quality of service and system's operation closer
to its security limits, are determining factors since in many countries, assets (such as towers to support power lines
transmission) installed some decades ago are now reaching their end of life. In this context of cost reduction, higher
efficiency and productivity, together with current environmental concerns and the desire to compare operation and
maintenance efficiency with counterpart companies, REN – Rede Eléctrica Nacional, S.A., Portuguese Transmission
System Operator (TSO), has been using LiDAR (Light Detection And Ranging) technology in their aerial inspections since
2007 (André and Gomes-Mota 2009). The acquired three-dimensional data in this Power Line Maintenance System (PLMI)
(Gomes-Mota 2008) are automatically processed, followed by human supervision for confirmation and adjustments, with
support of the video inspections and geo-referenced systems. The national grid was thus fully characterized at span level
with urbanization and vegetation growth rate indexes, following the ITOMS methodology (ITOMS 2011), which were
validated by a comparative analysis of inspections in subsequent years.
The collection of historical data, together with the knowledge of asset characteristics and system operation conditions, is
now structured in a generalized relational database, allowing a multi-purpose, structured and complex data analysis.
Information organization represents a big challenge and an extremely time-consuming task for a TSO, but it allows the
development of methodologies that will improve the system performance in several domains. Data collection and
organization become crucial to obtain better results and represent a major step for a TSO. This forces the TSO to maintain an updated and well structured asset database with all the required information. For example, a ‘number crunching’ analysis
tools and statistical methods to infer valuable information, such as common cause failure and probability of failure under
different conditions, which can be also combined with online operational and meteorological data. Real-time conditions
play a very important role for system operation. Assets lifeline can then be more precisely estimated for several time frames.
Additionally, this model is being extended with a comprehensive set of different environmental, meteorological and
geographic data over the years, including hourly temperatures in Portugal’s main land, all detected lightning strikes, levels
dedicated inspections (with all its associated costs) just to detect and count stork nests in its towers. The authors, also in the
scope of the LIONS (Lines Inspection Optimization System) project, are currently working on a tool to automatically
identify such nests based on the videos produced from regular inspections, together with our geo-referenced data on the
respective towers.
With such a system, more precise risk indices can be calculated based on the probability of failure for each span and
aggregated for a whole overhead line (OHL), taking also into account the operation conditions, the severity of failures, and
its estimated exposition time. Such approach is similar to Condition Based Risk Management (Earp (2005) and Hughes
(2005)), but favours a broader analysis of factors affecting the lines in a shorter time frame. Moreover, the criticality of each
line depends on its risk index, as well as on the grid topology as a complex graph (Azevedo and Gomes-Mota 2010a), with
its power sources, sinks, and available alternative power flow paths. Having such information reliably calculated allows to
develop optimisation tools, as we are currently doing (Azevedo and Gomes-Mota 2010b), to reduce costs or to improve the
quality of service by an appropriate use of resources, such as an intelligent maintenance policy or inspection planning.
Equally important is the ability of more accurate asset life line estimation, to fully exploit its use with less risk, and better
plan future maintenance and investments, reducing uncertainty.
A methodology to evaluate operational risk for a short-period of time was developed internally at REN, taking into
account the probabilistic nature of contingencies and their severity under specific operating conditions. This new
methodology aims to provide control room operators with risk-based security indices for the following period (such as 1
hour). Risk indices provide an insight to operators of the network state and of the constraints that operators face (Almeida et
al. (2010, 2011) and Almeida (2010)). The presented database allows this methodology to survive and succeed.
This paper is organized as follows: in the next section, we start by describing the risk factors that we are considering. In
section 3 we present the information structure used to represent and handle all relevant data, and then, in section 4, we
discuss our risk model. We conclude in section 5.
2
Risk Factors
We are currently considering the following main risk factors for operation of OHLs:
due to its physical conditions;
Vegetation: vegetation (and other objects) in the right-of-way is a major concern for OHLs since its proximity to phase conductors may cause a line tripping, and it has a dynamic nature (vegetation grows, wind blows, sag increases with
temperature, etc.) (Almeida 2010);
Storks: birds (in particular, storks, in Portugal and other countries) may nidify in towers. Collisions with conductors represent danger both to the bird and to system's security, since bird's electrocution may cause an unexpected outage of
the line. In a more time consuming but frequent way, birds droppings (which are highly corrosive) over insulators will
lead to their malfunctioning (Almeida 2010);
Pollution and fog: pollution, especially when associated with fog, also largely affect insulators, in particular non-composite ones (Almeida 2010);
Lightning: one of the major causes of concern with respect to OHLs is lightning, due to its power and unpredictability. A single strike at a line (or nearby) may easily cause it severe damages (Almeida 2010);
Fires: forest fires, also known as wildfires, occurring under a line also represent a risk to OHLs, as they cause forced outages and may require the operator to take the line out of service to allow fire extinction (Almeida 2010).
3
Information Structure
Our architecture (Azevedo and Gomes-Mota 2010b) consists of a server with connections to geographical information
systems (GIS) and asset management systems, running modular applications, with access to relational databases
implemented over PostgreSQL, and with http-based communication.
There are three databases involved: 1) a database containing the electrical grid topology, with all its relevant components and features; 2) a ‘lower-level’ database containing the raw data produced by line inspections, such as
vegetation management, equipment faults, navigation systems data, and so on; 3) environmental database.
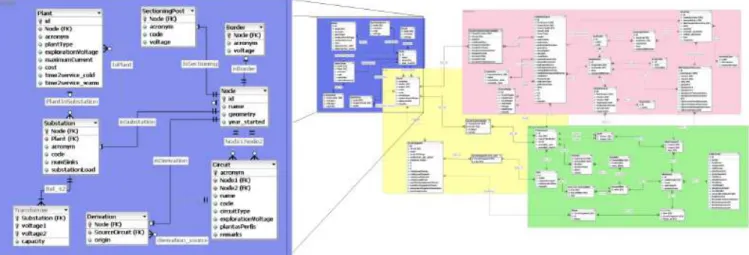
The ‘topology’ database contains information concerning four categories. Without intending to delve into the details, a
general picture of a schema is shown in Fig. 1, where each of the categories corresponds to a different rectangle region.
Some regions overlap and, of course, are related to others:
1. Graph (blue & zoom): the grid topology itself, which defines a graph with nodes such as substations, plants, or
2. Lines (yellow): aerial lines carrying the electrical circuits, with their towers and respective numbers. It includes also
underground circuit segments, and electrical characteristics.
3. Assets (green): towers and wires as grid assets, with their characteristics, their use, and their relations.
4. Inspections (pink): general part of inspections already performed, containing identification, and processed data, such as
identified towers, wires, environment, and anomalies. Historical data lie mainly in this category.
Fig. 1. Database schema (low resolution image, for confidentiality reasons)
On the left of Fig 1, the ‘Graph’ region is magnified, as an illustrative example. Electrical circuits are the graph arcs,
connecting two nodes, with a given operation voltage. Each node has geographical data and can be either a substation, or a
plant (if not part of a substation), or a sectioning post. It can also be a simple derivation from some circuit. Border nodes are
also considered when lines reach a different country to allow for cross border energy trade. Notice that substations are also
modelled with transformation capacities between different voltages, via the Transformer table. This part of the database
allows performing global analyses of the grid (Azevedo and Gomes-Mota 2010a), calculating critical paths, for instance.
Regarding environmental data (Azevedo and Gomes-Mota 2012), for each tower we have registered its number of stork
nests and whether it is located in a frequent thick fogs region, together with a rough estimate on the kind of pollution
(industrial, salt, dust, birds, other) each tower was subject to. Maintenance information concerning washing of dirty
insulators was also available and we registered its towers and dates, thus being able to determine critical areas, inferring
More accurate and complete information was anticipated by referring to available national sensors (of several distinct
pollutants), using historical data gathered since 1995. Unfortunately, the regional dispersion of sensors is very low, with
many being located in the big cities, so it is not so important for transmission operators, since that is not where OHLs lie.
Thus washing data appear to be more useful. Nevertheless, all available data were recorded in the database.
From the Portuguese meteorological institute, we have cloud-to-ground lightning data including date and time of striking,
amplitude (negative or positive), and estimated (by different methods) localization, given by an ellipse. The location
accuracy is given by its 2 value. Data are registered by a network of sensors covering the entire region since 2003. A statistical analysis of such historical data allows calculating lightning density throughout all lines for a better estimation of
probability of incidence along the years.
For wildfires, from the same meteorological source, we have daily values (on a risk scale of 1 to 5) based on fires
forecast, for each municipality, and updated active fire information from the fire-fighters coordination centre. Mainly for
historical value, but also useful to verify, for instance, hotter regions where fires may more easily occur, we register air
temperatures along the territory, thanks to the available data. In fact, the Portuguese meteorological institute provides us
with daily temperatures (minimum, maximum, and average) for district capitals for the last 25 years. In addition, the grid
operator has available temperature measurements registered in substations every 15 minutes, for the last 10 years. We
recorded all these data in the environment database.
Additionally to the described databases, REN has since 2001 an application called GestInc, which has as main purpose to
organize and manage incidents' data, recording all the relevant detailed information (Almeida and Lobo 2005).
4
Risk Evaluation
The total probability of fault in an OHL circuit is determined by the probability of occurrence of each individual cause,
where the probability of causei (except lightning) per OHLkis equal to
,p,u
prob
k i k
i ,OHL cause ,OHL
cause
causei m LR t (1)Where m is the month, p is the day period, u is the voltage level and t is the analysis duration (for short term and online
assessment this is typically 1 hour);
m,p,u
i cause
is the average failure rate and LR is the length at risk of OHLk, both per
The failure rates are calculated every time through an application that gets the information from the databases (described in ‘Information Structure’ section) in order to take into account the last incidents and the recent updates of equipment on the
Portuguese transmission network.
For online and short-time risk calculation, some processes were developed to gather and process the information of
current and forecast conditions to calculate the probability of the causes that are time dependent: (a) Forecast Forest fires risk
(b) Active fires
(c) Forecast lighting
(d) Current lighting conditions (using a lightning monitor application ‘JOBS’)
(e) Temperature (f) Fog
The processes to retrieve this information were developed at REN (Machado 2011) and use different sources of
information including some from the internet. As all of the mentioned forecast information is given for each municipality
region, the correspondent LR term for probability calculation is weighted with the factor for each municipality depending
on the forecast conditions:
, ,
,
, k j j k i j
iOHL municipality municipality OHL cause municipality
cause length
LR (2)
The other causes described in “Risk Conditions” that are not time dependent (as storks, vegetation, equipment, fog
combined with pollution and forest fires) have a constant factor value for each analysis period that will affect the OHL.
For these ones the LR term is calculated for each span.
For long term risk calculation several weather conditions are considered, namely dry, medium and wet seasons. For each
of these 3 scenarios the factors are calculated for each cause except for storks which will be constant or can be assumed
an increasing factor on some municipalities where it could be forecasted a significant increase of this bird population.
As lightning is the primary cause of faults in Portugal, the probability of fault is calculated using the backflash rate (BFR)
methodology for each tower considering the lightning density on the region and the equipment database information for
and the conductor’s diameter. The critical current (the minimum current that causes flashover) and therefore the probability
of flashover is calculated for each tower.
The risk of fault (contingency) can be evaluated by weighting its severity by its probability of occurrence as in equation
3:
Riskk = probabilityk x severityk (3)
where k represents the kth contingency under analysis.
Severity must reflect the consequences of a contingency (fault), namely the loading condition of the network branches
and transformers, the voltage limits violations on busbars, instability index, loss of load, loss of generation, island
processing and cascading analysis. The network is modelled in PSS/E application where the load, generation, equipment
outage, voltage and phase-angle taps are adjusted to the forecast analysis. For online security calculation a snapshot model
is created from the SCADA/EMS real-time system. For long term risk calculation, 3 scenarios of the network model are
considered to be used with the corresponding 3 probability scenarios, dry, medium and wet seasons. For each scenario, the
generation and load profile on the network model is adapted coherently to the weather conditions. These scenarios (network
models) are the ones used by the long term planning department of REN.
The severity for each failure (contingency) is calculated in PSS/E using the Newton-Raphson method. The automation of
severity calculation (Machado 2011) was implemented using python scripts running under PSS/E environment connected to a database performing the contingency analysis of the “must-run list” complemented with the analysis of loss of load, loss
of generation, islanding, voltage instability and cascading evaluation. Additional severity values that not depend of loadflow
calculations (as repair times and costs) are also considered.
The global severity value for each contingency is calculated by weighting all the severity independent results. The
severity functions per type of impact are defined in such a way that their outcome is a normalized value.
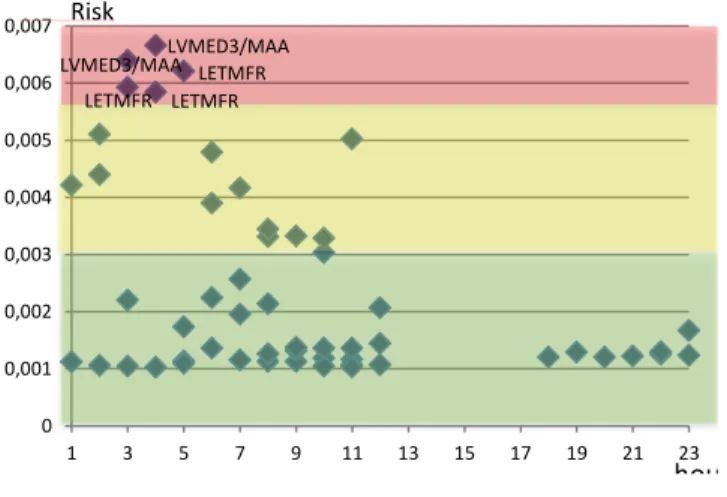
At the end, a risk index will be computed for each contingency based on the probability and severity of each event. A
visual interface was built (Fig. 2) to place this information available in the control room for a parallel run together with the
Fig. 2. Hourly Risk
To handle the large amount of results and information available on the risk evaluation, an automated filter was developed
to show to control room operators only the critical situations to be taken into consideration.
Still under development is the challenging definition of “acceptable risk” to create a secure and risk zone on the visual
interface of results, where several levels of risk can be defined. Local risk policies and management strategies play here a
role. These concepts are expected to be more stable after few years of learning and trial, building up historical data of risk
calculations. The acceptable risk threshold should correspond to the maximum risk value the operator is willing to accept,
under which no additional measures will be taken. This means cost reductions but also possible reliability issues, potentially
affecting quality of service. Thus, the acceptable risk must be defined by the management together with the national energy
regulator.
5
Conclusions
A methodology to evaluate operational and maintenance risk for different time frames was developed, taking into account
the probabilistic nature of contingencies and their severity under specific operating conditions. This methodology uses
several types of information to calculate risk indices, including current conditions. The applicability of the methodology
directly to the TSO needs is of great concern, because of continuous effort involving excellence in the operation, efficient
planning, investment in new assets and in the renewal of existing ones, adequate maintenance strategies, strict coordination
of outages and efficiency of technical and human resources.
0 0,001 0,002 0,003 0,004 0,005 0,006 0,007
1 3 5 7 9 11 13 15 17 19 21 23 Risk
hour LVMED3/MAA
The collection and data organization is a must for this methodology, which requires the TSO to maintain a common asset
database properly organized and promptly updated, with all the required information, to be used as input, as described.
References
S.A.B. de Almeida, R. Pestana, F.P.M. Barbosa, and N. Machado (2010). ”Operational Risk Assessment Methodology for the Portuguese
Transmission System”. ELECTRA, Invited paper.
S.A.B. de Almeida, C.S. Engelbrecht, F.P.M. Barbosa, and R. Pestana (2011). “Prediction of faults caused by Lightning for Transmission
System Operations”.ELECTRA, Invited paper.
S.A.B. de Almeida (2010). Portuguese Transmission Grid Incidents Risk Assessment. PhD thesis, FEUP.
S.A.B. de Almeida, and J. Lobo (2005). ”Gestinc-The Incidents Data Base: Purposes, Contents, Management And Automatic Indicators
Calculation Future Developments”. In 1ere Conférence Internationale sur le Transport de l’ Electricité en Algérie.
A.M. André, and J. Gomes-Mota (2009). “Multi-Challenges and Benefits of Integrated Over-Head Line Inspections”. In CIRED09 - Session 20, paper 0848.
F. Azevedo, and J. Gomes-Mota (2010a). ”Electrical grid modelling for overhead maintenance cycle optimisation”. In T. Hadzic, R.
Marinescu, eds., 1st Workshop on Constraint Reasoning and Graphical Structures (CRaGS 2010), pp. 75-82.
F. Azevedo, and J. Gomes-Mota (2010b). ”A time and space framework for overhead grid maintenance optimization”.Modern Energy Review, 2(1): 95-99.
F. Azevedo, and J. Gomes-Mota (2012). ”Gathering Environmental Data Concerning Very High Voltage Lines. Modern Energy Review, 4(1): 71-73.
G. Earp (2005). ”Condition Based Risk Assessment of Electricity Towers using High Resolution Images from a Helicopter”. In
CIRED2005 - 18th International Conference on Electricity Distribution.
J. Gomes-Mota (2008). “Integrated, Flexible and Real Time Inspection of Overhead Lines”. Power Industry International, 2(1): 67-69. D. Hughes (2005). “Condition Based Risk Management (CBRM) - Enabling Asset Condition Information to be Central to Corporate
Decision Making”. In CIRED, 18th International Conference on Electricity Distribution. ITOMS (2011), available online at http://www.umsgroup.com/ums_static/itoms.asp.