online | memorias.ioc.fiocruz.br Visceral leishmaniasis (VL), or kala-azar, is a
ma-jor public health problem in India that has historically occurred primarily in northeast region of the country (Sanyal 1985, WHO 1990, Joshi et al. 2008). The annual estimates for the incidence and prevalence of kala-azar cases worldwide are 0.5 million and 2.5 million, respec-tively, among which 90% of the confirmed cases occur in India (Bora 1999, Joshi et al. 2008). In 1977, a sample survey conducted in North Bihar (i.e., Vaishali, Muzaf-farpur, Sitamarhi and Samastipur) estimated the number of kala-azar cases to at approximately 70,000, associated with 4,500, deaths whereas in 1991, the number of kala-azar cases reached 250,000, with 75,000 deaths (Thakur 2000). All 11 public health centres (PHCs) in the district of Vaishali were reported to be affected with kala-azar. Ma-hua was reported to be the most affected and Raghopur was the least affected PHC. In 1990, a total of 9,922 cases and 214 deaths were reported in the district. However, more than 20,000 cases have been reported from the dis-trict of Vaishali alone in the last decade and this disdis-trict accounted for more than 5% of the total kala-azar cases recorded in Bihar. In 2011, 1,905 cases were reported, in-cluding 56 deaths between January-September [source: Bihar State Health Society (BSHS), India]. The annual
incidence rate of kala-azar cases is greater than 2.61%, whereas the cause-specific rate is 32.78% per 10,000 in-dividual in this district. The sandfly vector (Phlebotomus argentipes) of this disease is nocturnal and anthropo-philic, exhibiting a short flight range. It reproduces best at temperatures of 25-30ºC and a relative humidity (RH) of 80-85% (Singh et al. 2008, Picado et al. 2010). The re-quirement of such specific environmental conditions for vector propagation make application of remote sensing (RS) and geographic information systems (GIS) ideal for the study of VL (Hay et al. 1996, Thompson et al. 1999, Sudhakar et al. 2006, Bhunia et al. 2010b).
The primary objective of the present paper is to de-velop a geo-environmental risk map for kala-azar us-ing environmental and demographic parameter, based on primary and secondary data with the aid of RS and GIS technologies. The identified risk areas can then be marked as priority zones requiring immediate attention from health agencies as well as community participa-tion to address the risk of kala-azar. High resoluparticipa-tion satellite data provided important detailed information about landscape features, such as land use, vegetation conditions and soil moisture that were not detected from the low resolution imagery used in the study, which re-corded habitat seasonality and the climate. Other recent studies have used different approaches to study the risk of kala-azar in different parts of the world (Thomson et al. 1999, Sudhakar et al. 2006, Bhunia et al. 2010a). However, these studies were based on low resolution sat-ellite data. Additionally in previous studies, the authors have not incorporated the indoor climate, soil moisture or socio-economic factors in kala-azar risk maps for In-dia (Sudhakar et al. 2006, Bhunia et al. 2010b). To our Financial support: ICMR New Delhi under Senior Research Fellowship
+ Corresponding author: drskesari@sify.com Received 5 October 2011
Accepted 12 April 2012
Delimitation of kala-azar risk areas in the district of Vaishali
in Bihar (India) using a geo-environmental approach
Gouri Sankar Bhunia1, Nandini Chatterjee2, Vijay Kumar1,
Niyamat Ali Siddiqui1, Rakesh Mandal1, Pradeep Das1, Shreekant Kesari1/+
1Department of Vector Biology and Control, Rajendra Memorial Research Institute of Medical Sciences,
Agamkuan, Patna 800 007, Bihar, India 2Department of Geography, Presidency University, West Bengal, India
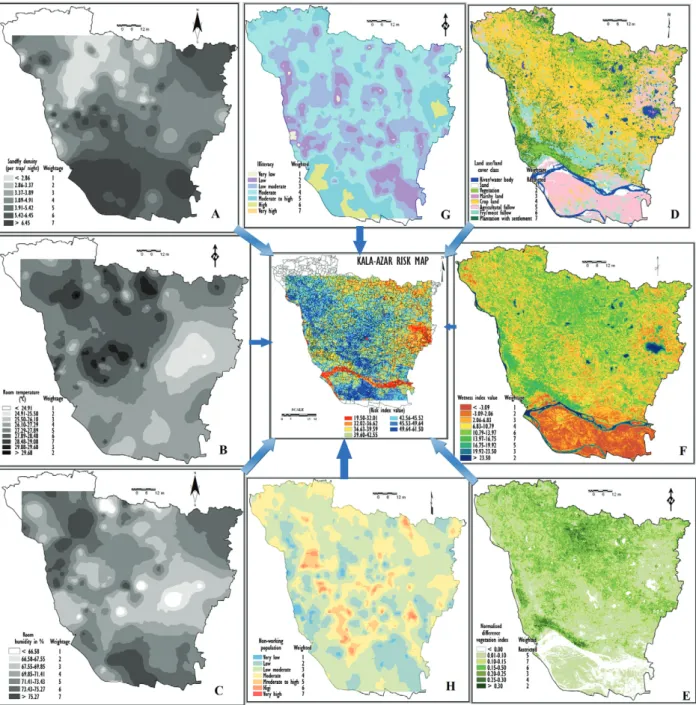
Remote sensing and geographical information technologies were used to discriminate areas of high and low risk for contracting kala-azar or visceral leishmaniasis. Satellite data were digitally processed to generate maps of land cover and spectral indices, such as the normalised difference vegetation index and wetness index. To map estimated vector abundance and indoor climate data, local polynomial interpolations were used based on the weightage values. Attribute layers were prepared based on illiteracy and the unemployed proportion of the population and associated with village boundaries. Pearson’s correlation coefficient was used to estimate the relationship between environmen-tal variables and disease incidence across the study area. The cell values for each input raster in the analysis were assigned values from the evaluation scale. Simple weighting/ratings based on the degree of favourable conditions for kala-azar transmission were used for all the variables, leading to geo-environmental risk model. Variables such as, land use/land cover, vegetation conditions, surface dampness, the indoor climate, illiteracy rates and the size of the unemployed population were considered for inclusion in the geo-environmental kala-azar risk model. The risk model was stratified into areas of “risk” and “non-risk” for the disease, based on calculation of risk indices. The described approach constitutes a promising tool for microlevel kala-azar surveillance and aids in directing control efforts.
knowledge, this combination of geo-environmental pa-rameters is novel. Thus, a combination of RS and GIS technologies will aid the Indian and international the au-thorities in planning and implementing successful pre-ventive programs for mitigating kala-azar infections.
In this study, the parameters associated with kala-azar endemic areas were considered for inclusion in a geo-en-vironmental risk model for predicting probable endemic areas for kala-azar. Our next step will be to validate this model in both endemic and non-endemic areas.
MATERIALS AND METHODS
Study area - The district of Vaishali (Fig. 1) was selected as the study area due to the high incidence of reported cases of kala-azar during the last decade. The district lies between the latitudes 23º38’N 25º26’N and longitudes 88º05’E 90º11’E, encompassing an area of 2.036 sq km. It is characterised by three distinct seasons; summer (March-June), winter (November-February) and the rainy season (July- October). January is the coldest month (< 5ºC) and April-May are the warmest months (44ºC). The rainy season lasts until the end of September, often extending to the middle of October. The average an-nual rainfall is 1.154 mm. The district has a population of 2,146,065 based on 2001 census data and is bounded by the Ganges River and its southern side and by the Gandak River on its western side. The region’s geomorphology takes the form of a flat plain, including perennial, as well as seasonally flowing watercourses. The principle soil or-ders throughout the region are Entisols and Inceptisols.
The district of Vaishali is naturally unforested and exhibits with moist deciduous vegetation. The lands around its villages are irrigated and contain cultivated fruit trees, cereals, bamboo, reeds and grasses. The pri-mary indigenous trees in the region are Musa acumi-nata (known locally as banana), Mangifera indica (mango), Litchi chinensis (litchi), Ficus religiosa (bo trees), Borassus flabellifer (Palmyra palm) and Phoe-nix dactylifera (date palm) and the region is mostly cul-tivated with maize, paddies and vegetables as well as some riverine vegetation consisting of fruit orchards, other trees and bushes.
Entomological data collection - Ground data were from March-June 2007 to acquire the ground data. Data on the vector (P. argentipes) for the summer season (March-June) were collected from 121 locations (vil-lages) that were randomly selected out of 1,572 villages (Fig. 1) within the district using Communicable Disease Centre light traps. For each location, 10 houses were randomly selected, which were separated by a minimum distance of 100 m. The light traps were placed indoors at all 10 (inside both human dwellings and cattle sheds) to collect sandflies and climate data. The numbers of P. argentipes captured by the traps were used to calculate the average number of sandflies captured/trap-night for each location, as a measure of the abundance of the lo-cal vector population. All species were mounted on mi-croslides using Canada balsam as the mounting medium (Remaudière 1992). Species identifications (Lewis 1978) were also performed. Villages where vector abundance is nil were not included in this study.
Epidemiological data - Data on the incidence of VL data for the year 2007 were obtained from the District Health Offices and BSHS. These incidence data aided us in identifying the spatial locations of VL-affected vil-lages within the study area.
Climatological data source - The climatic data in-cluded in our analysis consisted of indoor climate mea-surements [i.e., room temperature (RT) and RH] for the summer season obtained from 140 villages in the district of Vaishali (Fig. 1) using polymeters (BARIGO, Model 305, Germany) at ground level at the time of sandfly collection. For each village, climate data were collected from the 10 houses where the traps were installed and then averaged to represent the local indoor climate of the respective village.
Socio-economic factors - The examined socio-eco-nomic factors consisting of the illiteracy rate and the size of the unemployed population (important variables for the human development index) for the years 1990-2001 were obtained from census records [source: Census of India, 2001 (censusindia.gov.in/].
RS data - Data from the Landsat-5 Thematic Map-per (TM) sensor (P/R: 141/042, date of pass: 15 May 2009) with a spatial resolution of 30 m and seven spec-tral bands with revisit frequency 16 days (98.9 min per orbit) and 8-bit quantisation were used. The examined satellite image registered using Universal Transverse Mercator (UTM) projection system (zone 45N and da-tum_WGS-84) based on a second-order polynomial al-gorithm and nearest-neighbour resampling method. The
TM products used in this study were the normalised difference vegetation index (NDVI), the tasseled-cap transformation technique [wetness index (WI)] and land use/land cover classification. The NDVI, a standardised vegetation index (Tucker 1979), was calculated for this image and, the minimum, maximum, mean and standard deviation of the NDVI values in the kala-azar affected villages were extracted. Villages, where kala-azar cases are absent, were not included in the model because they were considered to have a low probability of occurrence of the disease. The WI was generated from a tasseled-cap transformed TM image (Qui et al. 1998). The trans-formation formula for the TM scene is defined in Crist and Cicone (1984) and was implemented in the model in model builder of Erdas Imagine software (version 9.1, Atlanta, Georgia, USA). A land cover map was obtained by performing a supervised maximum-likelihood clas-sification technique (Belward & de Hoyos 1987, Curran et al. 2000). To confirm accurate classification assess-ments, an error matrix table was derived that expresses the number of sample units (i.e., clusters of pixel) as-signed to a particular category relative to the actual loca-tion of that category, as verified in the field. Kappa sta-tistics were used to measure agreement or map accuracy (Rosenfield & Fitzpatrick 1986, Congalton 1991).
In our analysis, class density was also calculated for each land use/land cover category. A concentric circle of 500 m radius buffer zone was generated for each of 100 villages around the centred on the centre of the vil-lage to estimate the environmental variables. Five hun-dred meters buffer was selected for the buffer zone size based on the estimated flight range of the sandfly. Class densities for land use/land cover were then extracted
from the classified image based on the 500 m buffer zones. The “class density” is the number of times pres-ence of classes within 500 m buffer zone divided by to-tal number of such times considered for calculation (i.e. divided by 100 numbers).
Database creation on GIS platform - The methodol-ogy used to develop a geo-environmental based map of kala-azar risk through an index model is illustrated in Fig. 2. In ArcView version 9.3, the data on the sizes of illiterate and unemployed populations were associated with the digitised village boundaries as attribute data and created as separate layers. This was performed us-ing Model Builder (index model) tool in the Spatial Ana-lyst extension. For the vector abundance (sandflies per trap per night) and indoor climatic (temperature and RH) data, local polynomial interpolations using all points only within the defined neighbourhood were performed based on the weightage value (i.e. recorded from the field). Interpolated indoor climate and vector abundance maps were reclassified by dividing each data type into seven categories based on geometric intervals.
The root-mean-square error (RMSE) represents the prediction error, i.e. the difference between predict and actual difference values. For a model, the root-mean-square standardised prediction error should be close to 1 if the predictions are accurate. Another way to look at this is to divide each prediction error by the estimated standard error for the prediction. If the standardized RMSEs are greater than 1, the result is underestimation the variability in predictions; if the standardised RMSEs are less than 1, the result is overestimation the variability in the predictive model.
Development of the geo-environmental risk model - Information from several published and peer-reviewed studies on epidemiological aspects and population dy-namics of parasites, vectors and human hosts was col-lected and augmented with a range of other previously reported data (Joshi et al. 2008, Bhunia et al. 2010b). Variables such as the temperature, humidity, vegeta-tion, soil moisture, land use/land cover and the sizes of the illiterate and impoverished populations either individually or in combination are known to be associ-ated with the occurrence of kala-azar. According to the degree of favourable conditions for kala-azar transmis-sion, simple weightings/ratings were calculated for all of the input variables, leading to a geo-environmental risk model. We utilized rating systems based on values from 1-7, where ‘7’ mean very highly suitable, ‘6’ high-ly suitable, ‘5’ highhigh-ly to moderatehigh-ly suitable, ‘4’ mod-erately suitable, ‘3’ as modmod-erately suitable to somewhat unsuitable, ‘2’ less suitable, ‘1’ very less unsuitable and ‘0’ a kala-azar restricted area (no transmission occurred in this area). The model customised the environmental and socio-economic factors encompassing the ranges of different variables associated with the transmission of kala-azar, including indoor temperature (23-32ºC), in-door humidity (55-83%), the NDVI (-0.21-0.38), the WI (-70.56-31.04) and vector abundance (2.35-6.96) in addi-tion to the sizes of the illiterate and unemployed popula-tions to derivine a kala-azar risk index (equation 1). This technique of assigning each value of the input risk vari-ables a score (using the ranges/characteristics provided above) to generate patterns over different geographical areas is usually used to apply a common measurement scale of values to diverse and dissimilar input data to create an integrated analysis (Brooker & Michael 2000, Sabesan et al. 2006). The scores and weights of the eight variables were assigned according to the incidence of VL associated with each category, calculated through overlay analysis and using threshold obtained from the leishmaniasis related literature (Sudhakar et al. 2006, Werneck et al. 2007, Bhunia et al. 2010b, de Almeida et al. 2011) (equation 2). The cell values for each input ras-ter in the analysis are assigned values from the evalua-tion scale. This makes it possible to perform arithmetic operations on the input rasters, which originally had dissimilar types of values. Each input raster is weighted or assigned a per cent influence based on its impor-tance to the model. The total influence for all rasters equals 100%. The cell values of each input raster are then multiplied by the raster’s weight. The influence of the most important raster is 20%, the second most im-portant is 10%, the third-sixth rasters 15% for each and the seventh and eighth rasters 5% each. The cell val-ues are multiplied by their percentages of influence and then added to create the output raster. In this weighted overlay, sandfly density has a 20% influence, RT a 10% influence, room humidity a 15% influence, land use/ land cover a 15% influence, NDVI a 15% influence, WI a 15% influence, population illiteracy a 5% influence and the unemployed population a 5% influence. When the weighted overlay is calculated, the result is a raster of overall suitability is created. Setting the scale value
to “restricted” assigns a value to that cell in the output weighted overlay result that is the minimum value of the evaluation scale set, which means that the correspond-ing area is unacceptable or cannot be used. Restricted areas are excluded from the analysis. In the land-use raster, for example, river/water bodies are restricted for disease transmission. Before running the final model all the layers (e.g., the indoor climate and the attribute layers for illiterate and unemployed populations) were resampled to the 30 m grid of the Landsat-based map using nearest neighbour resampling to match the reso-lution. The overall relative risks linked to each variable are summarized in Table I. The scores of the risk vari-ables were summed mathematically as follows:
VL risk for an area = Σ8 Y
i (1)
i = 1
where ∑Yi = Y1 + Y2 + Y3 + …+ Y8 are the scores for
temperature, humidity, vegetation, soil moisture, land use/land cover and the sizes of the illiterate population and poor living people respectively.
To indicate the VL risk for a locality as a stan-dardised quantity it is represented in terms of a per-centage as follows:
8
VL of locality = ∑i = 1 Yi of a locality x 100 (2) maximum value of ∑i = 1 Yi
in the study area
This approach was used to identify and assess po-tential risk areas for VL transmission in the district of Vaishali. Each risk index was expressed as an percentage of the highest value possible to compare the risk levels. However, true validation of the model can only be per-formed by comparing model predictions to the disease in-cidence report of 2008. The spatial distribution of the case incidence was overlaid on the “risk index value”, layer and the number of cases for each zone was counted manually.
Statistical analysis - Univariate analysis was per-formed to estimate the significance level of the correla-tions between the input environmental variables and the disease incidence. The statistical relationships between environmental variables and the incidence of kala-azar cases were assessed based on Pearson correlation coef-ficients. A simple linear regression analysis was used to investigate the association between the indoor climate and sandfly abundance. The results were considered to be significant if p < 0.05.
RESULTS
TABLE I
Building a raster-based index model by calculating index values and summing up weighted cell values for kala-azar transmission
Data type Input theme Operator Multiplier Label Weightage
Ground data Sandfly density (summer month)
+ 20 < 2.86
2.86-3.37 3.37-3.89 3.89-4.91 4.91-5.42 5.42-6.45 > 6.45
1 2 3 4 5 6 7
Room temperature + 10 < 24.91
24.91-25.50 25.50-26.10 26.10 -27.29 27.29-27.89 27.89-28.48 28.48-29.08 29.08-29.68
> 29.68
1 2 3 4 5 6 7 3 2
Room humidity + 15 < 66.58
66.58-67.55 67.55-69.85 69.85-71.41 71.41-73.43 73.34-75.27 > 75.27
1 2 3 4 5 6 7
Land use/land cover + 15 River/water body
Sand Vegetation Marshy land
Crop land Agricultural fallow
Dry/moist fallow Plantation with settlement
Restricted 1 2 4 6 5 3 7 Normalised difference
vegetation index
+ 15 -0.21-0.00
0.01-0.10 0.101-0.15 0.151-0.20 0.201-0.25 0.251-0.30 > 0.301
Restricted 5 7 6 3 4 2
Remote sensing data Wetness index + 15 < -3.09
-3.09-2.06 2.06-6.83 6.83-10.79 10.79-13.97 13.97-16.75 16.75-19.92 19.92-23.50 23.50-31.04
1 2 3 4 6 7 5 3 2
Population illiteracy + 5 No data
Very low Low Less moderate
Moderate High Very high
0 1 2 3 4 5 6
Census data Non-working population + 5 No data
Very low Low Less moderate
Moderate High Very high
only the P. argentipes density was considered the devel-opment of the model (Fig. 3A). The regression function for local polynomial interpolation was 0.219* x +3.347 with a RMSE of 0.008 units per trap/per night. The entire region was classified into seven categories. The highest values indicate higher risk of disease transmission.
Environmental parameters - A land use map was generated from the Landsat TM (30 m resolution) satel-lite data to obtain detailed information about land use and their percent coverages within the study site (Fig. 3D, Table II). For the initial classification, the following land use classes were considered: (1) river, (2) other water body, (3) sand, (4) vegetation, (5) marshy land, (6) crop
land, (7) agricultural fallow, (8) dry fallow, (9) moist fal-low land and (10) plantation with settlement. An accuracy assessment of the result, showed an overall classification accuracy of 89.89%. The values of kappa ranges showed almost perfect agreement (> 0.82) between these land cover classes for the study site. Based on class density a weightage score was assigned to each land cover class, as shown in Table I, II. The highest class density was found for the “plantation with settlement”, class which was given the highest score, while the lowest score was given to the “sand” class. In this analysis, the river/water body classes were removed from the model as restricted because transmission could not occur in these areas.
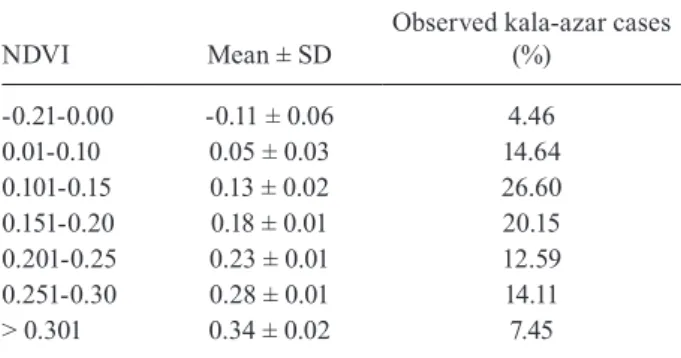
An NDVI map was generated to differentiate between vegetated and non-vegetated areas (Fig. 3E). The high-est NDVI values (0.38) were observed around the study area during the dry season, whereas the minimum NDVI value was -0.21. Based on the density of vegetation, the areas were divided into seven categories related to the percent coverage within the study area, as follows (1) -0.21-0.00 (48.03%), (2) 0.01-0.10 (8.96%), (3) 0.101-0.15 (11.68%), (4) 0.151-0.20 (11.26%), (5) 0.201-0.25 (8.84%), (6) 0.251-0.30 (7.22%) and (7) > 0.301 (3.11%). Classes 1 and 2 represent absent or very low-density vegetation and the vegetation density increases from class 3-7. Pearson correlation co-efficient showed a strong negative rela-tionship (r = -0.69; p < 0.05) between the case incidence and maximum NDVI values. A significant relationship (r = 0.48; p < 0.05) was also detected between the aver-age NDVI and the incidence of cases. However, in this analysis, the minimum NDVI had no significant effect (r = 0.10; p > 0.05). When we overlaid all of the reported cases on the NDVI map, the result showed that most of the cases occurred in non-vegetated areas (Table III).
A WI map was prepared to estimate the dampness of the surface of the study area (Fig. 3F). The WI values for the study area varied from -70.56-31.04. The WI values were divided into nine categories (Table IV). The mini-mum value of WI indicates the driest areas (i.e., sandy areas), whereas the maximum value indicates wetness
(i.e., a water body/river) within the study site. The WI map was then overlaid with the records of kala-azar case incidence for the locality. The distribution of areas with a high recorded incidence of cases is concordant with the distribution of WI values in the range of 13.97-16.75. Average WI values were strongly associated with the occurrence of disease (r = 0.78; p < 0.05), whereas no such significant relationship was established with the minimum and maximum WI value (r = 0.28; p < 0.094 - r = 0.19; p < 0.18, respectively). The results also illustrated that the percentage of cases decreases with the proxim-ity to higher WI values as well as greater distance from the lower WI values.
Climatic parameters - The RT in the summer months within the study sites ranged from 23.97-31.50ºC (Fig. 3B). The summer RT values were categorised into nine classes (Table I). The largest number of potential vectors was observed within the RT range of 28.48-29.08ºC. A simple linear regression analysis showed a moderately sig-nificant relationship (R2 = 0.47; p < 0.05) between RT and
sandfly abundance. The regression function for RT by lo-cal polynomial interpolation was -0.032* x +29.586, with an RMSE of 0.836. However, when the monthly number of VL cases and the temperatures recorded during the study period were compared, a weak, but significant negative correlation, was detected (r = -0.29; p < 0.003).
TABLE II
Characteristics of various land use/land cover categories and their area covered in kala-azar endemic region
Land use/land cover classes Description
Area covered (%)
Classes densitya
(%)
River The perennial river
(Ganga and its tributary, Gandak).
2.08 0.69
Sand Naturally occurring unconsolidated granular
material on the river bed.
2.11 1.32
Vegetation Area characterized with weed/grass and sparsely distributed hard stem plant.
23.82 7.15
Bare surfaces/dry fallow Area characterized with no green vegetation, unusable and unsaturated land.
10.21 7.23
Marshy land Land covered with shallow bodies of water consisting of grass, weeds etc.
7.60 13.91
Surface water body Natural inland water bodies characterized by chaurs, paleo-levees, mender belts, cut-off loops, pond etc.
1.37 2.88
Plantation with settlement Residential land as well as land used for transportation. Areas dominated by planted trees (small size fruit garden e.g., banana,
mango, lichhi etc.) surrounding the houses.
5.28 22.78
Crop land Characterized by seasonal crops, intensively managed for production of paddy, wheat and vegetables.
16.50 18.86
Agricultural fallow Areas consisting of shurbland, pasture, not used for cultivation during last four-five years.
20.45 14.99
Moist fallow Land saturated with water; periphery of the river bank and permanent water body.
10.58 10.19
The indoor RH in the summer months at the study sites varied from 61.09-80.60% (Fig. 3C). The room humidity values for the summer months were divided into seven categories (Table I). The results of a simple linear regression analysis showed that RH has signifi-cant influence (R2 = 0.68; p < 0.05) on vector abundance
for the study sites. The results also illustrated that adult P. argentipes prefer room humidity values exceeding 75.27%. The regression function for local polynomial in-terpolation of room humidity was 0.024* x +69.417 with an RMSE of 0.207. RH showed a significant and positive relationship with VL (r = 0.48; p < 0.020).
Socio-economic characteristics - Data on the illit-eracy rates and unemployed populations in the villages of the district of Vaishali were obtained from census records from the Government of India for 2001. The il-literacy rate in the district ranges from 6.25-98.59 (Fig. 3G). A simple correlation drawn between the illiteracy rate in each village and the incidence of kala-azar
cas-TABLE III
Normalised difference vegetation index (NDVI) derived from a Landsat-5 TM data of district of Vaishali, Bihar, India
NDVI Mean ± SD
Observed kala-azar cases (%)
-0.21-0.00 -0.11 ± 0.06 4.46
0.01-0.10 0.05 ± 0.03 14.64
0.101-0.15 0.13 ± 0.02 26.60
0.151-0.20 0.18 ± 0.01 20.15
0.201-0.25 0.23 ± 0.01 12.59
0.251-0.30 0.28 ± 0.01 14.11
> 0.301 0.34 ± 0.02 7.45
SD: standard deviation.
TABLE IV
Wetness index (WI) derived from a Landsat-5 Thematic Mapper image of the district of Vaishali, Bihar, India
WI Mean ± SD
Observed kala-azar cases (%)
< -3.09 -36.84 ± 19.47 0.77
-3.09-2.06 -0.52 ± 1.48 2.97
2.06-6.83 4.44 ± 1.38 6.44
6.83-10.79 8.80 ± 1.14 13.16
10.79-13.97 12.38 ± 0.92 21.09
13.97-16.75 15.36 ± 0.80 29.11
16.75-19.92 18.33 ± 0.92 12.86
19.92-23.50 21.71 ± 1.03 10.05
23.50-31.04 27.27 ± 2.18 3.55
SD: standard deviation.
TABLE V
Village wise case incidence verification
of kala-azar risk model in the district of Vaishali, Bihar, India
Risk index
Cases observed (%)
19.50-32.01 0.50
32.02-36.62 6.06
36.63-39.59 17.52
39.60-42.55 18.19
42.56-45.52 19.85
45.53-49.64 15.95
49.65-61.50 21.93
es showed a positive relationship (r = 0.43; p < 0.03). The unemployed population percentage of the popula-tion varied from 33.05-87.67 in the district of Vaishali (Fig. 3H). A positive significant relationship (r = 0.32; p < 0.009) was found between the incidence of disease and the unemployed percentage of the population. Both of the above variables were categorised into six classes (Table I). Villages with higher illiteracy rates (greater than 60%) and unemployed percentage of the popula-tions (more than 70%) were marked as having a high risk of disease transmission.
Geo-environmental risk model - Depending on the obtained risk values (Fig. 3), the geo-environmental kala-azar risk map (Fig. 3) was stratified into different spatial entities, ranging from “high risk” (blue) to “low risk” (red) units. The values for the calculated risk in-dex varied from 19.5-61.5% (the observed maximum, this is the maximum value for the kala-azar risk index map) according to the localities. It is quite clear that this approach works well, as the resulting map of high, moderate, low or no risk of VL corresponded with the actual disease incidence records from BSHS. Impor-tantly, all of the high prevalence points were predicted to be high-risk areas (risk index values > 45.53). All of the intermediate incidence points fell into the high or moderate risk-areas (risk index values 39.60-45.52) and risk index values < 32.02 were predicted as low-risk area. At sites presenting risk index values < 32.02, no cases were found, although some cases migrated from nearby endemic villages. After several discussions with the migratory patients, it was established that actually belonged to the areas of district of Vaishali where index value was greater than 32.20.
DISCUSSION
Risk models have been developed by different re-searchers and scientists to investigate disease transmis-sion (Werneck et al. 2007, de Almeida et al. 2011). Cross et al. (1996) developed a model of the P. papatasi distri-bution in southwest Asia based on weather and the NDVI, although this model was not validated. No study has been conducted in India to delineate kala-azar “risk” and “non-risk” areas at a microlevel. In a previous reported by our group (Bhunia et al. 2010a), we presented kala-azar risk map at a macro-level based on meteorological variables and land use/land cover data. Here, we considered the village level and socio-economic data for risk predic-tion. It should be noted that the field data included in the analysis were collected over a short period of time that included no extreme weather events and the number of sandflies collected is known to depend heavily on local circumstances, including the weather, while sandfly trap-ping results show considerable variation seasonally and between years (Dinesh et al. 2001, Singh & Singh 2009, Picado et al. 2010). Sandfly abundance shows seasonal variation, being higher during the pre-monsoon and post-monsoon periods and lower in the winter months. How-ever, this study was performed during the pre-monsoon season and the model was developed only for the study period, whereas it has been reported that the incidence of kala-azar cases is higher in the summer months than in the other months (Sanyal et al. 1979). Additionally, the entire district addressed in this study has been highly affected by kala-azar over the last 30 years and we con-sidered only the villages reporting a high incidence of azar in 2007. Nevertheless, the transmission of kala-azar is continuing unabatedly (simmering transmission) in the entire area. Therefore, the results of our analysis of environmental variables may be considered in the kala-azar risk model. Consequently, a quantitative longitudi-nal study is currently being conducted by our team.
Kala-azar transmission, similar to that of other vec-tor-borne infectious diseases, is dependent on microlevel environmental (physiographic and climatic) and demo-graphic variables. Physiodemo-graphic factors primarily con-tribute to vector abundance, whereas climatic factors influence extrinsic incubation (of parasites) directly, as well as via vector survival. In the present study, the results showed that the indoor abundance of P. argen-tipes was positively associated with RT (28.48-29.08ºC) and RH (> 75.27%). Epidemics can occur when vector abundance increases due to environmentally favourable conditions or the presence of alternative host species that amplify vector abundance. In contrast, in areas of high vector density, the vector-to-host ratio is high and the dis-ease may become endemic at a high level of prevalence. It has also been also reported that higher sandfly densities suggest a higher probability of successful transmission, subject to the presence of an infective host and positive eco-environmental conditions (Campbell-Lendrum et al. 2001, Sudhakar et al. 2006, Sánchez-García et al. 2010).
It is evident from the findings of the present study that environmental factors are major contributors to the distribution pattern of kala-azar incidence as previous-ly stated by others (Victora et al. 1997, Bucheton et al.
2002, Kishore et al. 2006, Sudhakar et al. 2006, Kesari et al. 2011). Our results showed that environmental factors can be used to model and identify potential risk areas susceptible to kala-azar. This study also confirms that the general abundance of P. argentipes in the district is positively associated with RT and RH. It has been shown that climatic variability in general affects sandfly abun-dance vis-à-vis disease occurrence. Previous reports (Ranjan et al. 2005, Sharma & Singh 2008, Bhunia et al. 2010a, Kesari et al. 2011) also support these findings, as these researchers found that adult P. argentipes in In-dia “preferred” relatively moderate to high temperatures and very high humidity.
Kala-azar is linked to the environment through the ecology of the vectors. As the conditions under which the vectors can thrive are limited, human VL appears to be a disease that is very sensitive to landscape charac-teristics (Sudhakar et al. 2006, Kesari et al. 2011). Land-scape features, including land cover, land use and their patterns influence the availability of suitable habitat and thus, the abundance of vectors. The primary goal of the present study was to determine whether the environ-mental conditions that are observable via Landsat 5-TM imagery were correlated with the local abundance of P. argentipes and thus with the level of transmission of Leishmania donovani and consequent incidence of VL. In this study, plantations associated with settlements, crop land, agricultural fallow, marshy land and moist land were considered at greater risk due to their large ar-eal extent in endemic villages based on the class density within 500 m buffer zones around the centres of endemic villages. The mapping of land cover characteristics with considerable emphasis on variables associated with crop land, agricultural fallow areas, marshy land and moist land using RS satellite data were performed meticulous-ly. The distance of these variables from settlements cal-culated through GIS analysis with discrete criteria and proximity analysis helped in prioritising the village that are prone to high sandfly populations. The present ob-servations indicated that crop land, agricultural fallow lands with human settlements were indicators of risk-prone areas for kala-azar disease. These variables may support large adult populations of sandflies by providing food and suitable moisture condition.
a relatively constant humidity is of decisive importance for establishing the correct microclimate burrows for the successful habitation of not only of sandflies, but also their vertebrate hosts. A recent investigation (Elyes et al. 2007) showed that the development of irrigation for agri-culture in central Tunisia may offer create a new suitable ecological niche for sandfly species and, subsequently, the emergence of a new fear of leishmaniasis.
It is also obvious from the NDVI results that low den-sity vegetation (minimum NDVI) was associated with a high incidence rate of VL according to the level of veg-etation cover in village neighbourhoods (Thompson et al. 2004, Bavia et al. 2005, Bhunia et al. 2010b), which should reflect the densities of trees because most grasses in the area are highly seasonal, flourishing only after rains. However, sandflies require a sugar meal, obtained from plant material (El Said et al. 1986, Schlein & Jacob-son 1999). Therefore, sandflies would be expected to be less abundant in areas with little or only soft stem vegeta-tion. These results are in agreement with the findings of Cross et al. (1996) and are also supported by Bavia et al. (2005), who investigated the influence of the minimum NDVI on the distributions of P. papatasi and Lutzomyia longipalpis in southeast Asia and Brazil, respectively. In the non-endemic villages, the NDVI values do not vary considerably over space.
The presence of surface dampness and high moisture has proven to be a potential environmental factor in the successful breeding of sandflies and the possibility of kala-azar transmission in tropical countries (Kadaro et al. 1993, López et al. 1996, Feliciangeli 2004, Sharma & Singh 2008). Unlike most other biting flies, the immature stages of sandfly species avoid open water (WHO 1991). The role of water bodies in the demarcation of kala-azar endemicity may be due to their effect on the prevailing moisture regime through flooding during the rainy sea-son. Living in proximity to water bodies has been found to be a risk factor for kala-azar (D’Oliveira et al. 1997, Saha et al. 2009). In the present study, kala-azar cases were more likely to occur in regions showing a certain range of WI value, providing evidence that a certain threshold value of WI represents areas that are likely to include P. argentipes breeding habitats (i.e., areas far from the permanent water bodies). Alternatively, the re-gion, close proximity to water bodies (e.g., rivers, low ly-ing land, marshy land, chaurs) may detrimental to larval developmental stages (Mukhopadhyayet al. 1990, Bhunia et al. 2011) and/or may be have been cleared of organic remnants that compromise the resting or breeding places of sandfly larvae (ISPAN 1993). Prior investigation have demonstrated that proximity to water bodies may increase kala-azar risk, suggesting the importance of identifying wet areas showing the potential for vector breeding (Boaz 2006, Sudhakar et al. 2006, Kesari et al. 2011). Thus it appears like that proximity to an area of the certain value showing a certain range of WI values represents a more accurate predictor of sandfly breeding than proximity to swamps and/or other permanent water bodies in general.
The influence of human factors, such as literacy levels, economic status and occupations on the occur-rence of VL at the microlevel has been described by
oth-ers (Ranjan et al. 2005, Joshi et al. 2008, Adhikari et al. 2010). Previous studies in south Asia demonstrated an association between kala-azar and poverty (Bern et al. 2000, Thakur 2000). In this study, areas with low income levels and high illiteracy rates are considered high-risk areas for kala-azar transmission. Information, education and communication (IEC) or behavioural communication change (BCC) is an important component in the control and prevention of the disease. Kala-azar is a disease af-fecting the poorest among the poor. The affected popula-tion belongs to the lowest socio-economic group, whose per capita income is very low (Adhikari & Maskay 2003, Sharma et al. 2006). Thee individuals do not have knowl-edge of the symptoms of the disease, such as recurrent, intermittent or remittent fever, often a double rise, loss of appetite, splenomegaly, anaemia, liver enlargement. In the absence of IEC/BCC, they remain without medicinal treatment, which also negatively impacts the community. Furthermore, these populations are unaware of disease prevention techniques, such as spraying insecticides (DDT) in living rooms, sleeping on beds and the use of nets to avoid sandfly bites. A higher unemployed percent-age of the population reflects a lower standard of living, which leads to an increased risk of transmission of the dis-ease. These finding can be attributed to the life style and house-building materials of the impoverished which have the effect of increasing the transmission of the disease. Poorly constructed house are easily invaded by sandflies and represent preferred sites for breeding and thus this variable is an important risk factor (Schaefer et al. 1995). The lack of significance of socioeconomic factors may reflect the relative homogeneity of our study population and the fact that at the village level, more proximate fac-tors determine the risk of kala-azar.
In the present study, the individual environmental and socio-economic characteristics were not evaluated as separate entities. Rather, they all considered together in a composite index, as a combination of factors responsible for transmission (Brooker & Michael 2000, Sabesan et al. 2006). Our model does not aim to estimate the prevalence of cases, but only to identify at the microlevel, the areas showing a high risk potential regarding VL transmission. At present, the control strategy of the kala-azar elimina-tion programme is target areas based on their history of kala-azar transmission. However, this strategy is unlikely to yield considerable dividends because VL is well estab-lished in this area. The range of the vector P. argentipes is shifting and this species becomes quickly established in new areas. Therefore, the present study will very helpful in identifying probable areas of kala-azar transmission and strengthen the kala-azar control strategy. However, it may not be possible to identify positive cases based on the potential “risk” areas (at the microlevel) in this model with any of the existing tools. It may also be concluded that all people living with a risk of infection need not be “infective” because other factors may be involved, such as natural resistance. Nevertheless, a relatively high risk of kala-azar transmission can be reliably expected with increasing values of “risk” as identified by this model.
socio-economic factors obtained from RS data and ground surveys) shows promising potential for identifying areas associated a high risk of kala-azar transmission. This kala-azar risk map may be of value to health agencies and local authorities, who may use this value to deter-mine and plan kala-azar surveillance activities as well as to require mitigation programs in the identified areas. Information from the kala-azar risk map can be further used as a management guide to continuously monitor the status of the kala-azar intensity level.
ACKNOWLEDGEMENTS
To NK Sinha, SA Khan and AK Mondal, for their assis-tance to collect the vector from the study site, and to the GLCF community, for free access of satellite data.
REFERENCES
Adhikari SR, Maskay NM 2003. The economic burden of kalaazar in households of the Danusha and Mahottari districts of Nepal. Acta Tropica88: 1-2.
Adhikari SR, Supakankunti S, Khan MM 2010. Kala-azar in Nepal: estimating the effects of socioeconomic factors on disease inci-dence. Kathmandu Univ Med J8: 73-79.
Bavia ME, Carneiro DD, Gurgel HC, Madureira FC, Barbosa MG 2005. Remote sensing and geographic information systems and risk of American visceral leishmaniasis in Bahia, Brazil. Par-assitologia (Rome) 47: 165-169.
Belward AS, de Hoyos AA 1987. Comparison of supervised maxi-mum likelihood and decision tree classification for crop cover estimation from multi-temporal LANDSAT MSS data. Int J Re-mote Sens8: 229-235.
Bhunia GS, Kesari S, Chatterjee N, Pal DK, Kumar V, Ranjan A, Das P 2011. Incidence of visceral leishmaniasis in the Vaishali district of Bihar, India: spatial patterns and role of inland surface water bodies. Geospatial Health 5: 205-215.
Bhunia GS, Kesari S, Jeyaram A, Kumar V, Das P 2010a. Influence of topography on the endemicity of kala-azar: a study based on remote sensing (RS) and geographic information systems (GIS).
Geospatial Health 4: 155-165.
Bhunia GS, Kumar V, Kumar AJ, Das P, Kesari S 2010b. The use of remote sensing in the identification of the eco-environmental factors associated with the risk of human visceral leishmania-sis (kala-azar) on the Gangetic plain, in north-eastern India. Ann Trop Med Parasitol104: 35-53.
Boaz Y 2006. Mating systems of blood-feeding flies. Ann Rev Ento-mol51: 413-440.
Bora D 1999. Epidemiology of visceral leishmaniasis in India. Natl Med J India12: 62-68.
Bern C, Joshi AB, Jha SN, Das ML, Hightower A, Thakur GD, Bista MB 2000. Factors associated with visceral leishmaniasis in Nepal: bed-net use is strongly protective. Am J Trop Med Hyg63: 184-188.
Brooker S, Michael E 2000. The potential of geographical information systems and remote sensing in the epidemiology and control of human healminth infections. Advances in Parasitol47: 246-288.
Bucheton B, Kheir MM, El-Safi SH, Hammad A, Mergani A, Mary C, Abel L, Dessein A 2002. The interplay between environmental and host factors during an outbreak of visceral leishmaniasis in eastern Sudan. Microbes Infect4: 1449-1457.
Campbell-Lendrum D, Dujardin J-P, Martinez E, Feliciangeli MD, Perez JE, de Silans LNMP, Desjeux P 2001. Domestic and peri-Domestic and
peri-domestic transmission of American cutaneous leishmaniasis: changing epidemiological patterns present new control opportu-nities. Mem Inst Oswaldo Cruz96: 159-162.
Congalton RG 1991. A review of assessing the accuracy of classifica-tions of remote sensed data. Remote Sens Environ 37: 35-46.
Crist EP, Cicone RC 1984. Application of tasseled cap concept to simu-lated Thematic Mapper data. Photogramm Eng Rem S50: 343-352.
Cross ER, Newcomb WW, Tucker CJ 1996. Use of weather data and remote sensing to predict the seasonal distribution of Phlebotomus papatasi in southwestern Asia. Am J Trop Med Hyg54: 530-536.
Curran PJ, Atkinson PM, Foody GM, Milton EJ 2000. Linking remote sensing, land cover and disease. Adv Parasitol47: 37-80.
de Almeida AS, de Andrade Medronho R, Werneck GL 2011. Identi- Identi-fication of risk areas for visceral leishmaniasis in Teresina, Piauí State, Brazil. Am J Trop Med Hyg 84: 681-687.
Dinesh DS, Ranjan A, Palit A, Kishore K, Kar SK 2001. Seasonal and nocturnal landing/biting behaviour of Phlebotomus argentipes
(Diptera: Psychodidae). Ann Trop Med Parasitol95: 197-202.
D’Oliveira Jr A, Costa SRM, Barbosa AB, Orge MGO, Carvalho EM 1997. Asymptomatic Leishmania chagasi infection in relatives and neighbors of patients with visceral leishmaniasis. Mem Inst Oswaldo Cruz92: 15-20.
El Said S, Beier JC, El Sawaf BM, Doha S, El Kordy E 1986. Sand flies (Diptera: Psychodidae) associated with visceral leishmania-sis in El Agamy, Alexandria Governorate, Egypt II. Field behav-iour. J Med Entomol23: 609-615.
Elyes Z, Belhassen K, If hem C 2007. Entomological investigations following the spread of visceral leishmaniasis in Tunisia. J Vector Ecol 32: 371-374.
Feliciangeli MD 2004. Natural breeding places of phlebotomine sand-flies. Med Vet Entomol18: 71-80.
Hay SI, Tucker CJ, Rogers DJ, Packer MJ 1996. Remotely sensed sur-rogates of meteorological data for the study of the distribution and abundance of arthropod vectors of disease. Ann Trop Med Parasitol90: 1-19.
ISPAN - Irrigation Support Project for Asia and the Near East 1993. The kala-azar epidemic in Bangladesh and its relationship to flood control embankments. USAID Environmental study. Avail-able from: pdf.usaid.gov/pdf_docs/PNABY132.pdf.
Joshi A, Narain JP, Prasittisuk C, Bhatia R, Hashim G, Jorge A, Ban-jara M, Kroeger A 2008. Can visceral leishmaniasis be elimi-Can visceral leishmaniasis be elimi-nated from Asia? J Vector Borne Dis 45: 105-111.
Kadaro AY, Ghalib HW, Ali MS, Eltoum I, Ismail A, Gaafar A, Kemp M, Kordofani AAY, Reed SG, El-Hassan AM, Kharazmi A, Hag-Ali M, Mustafa MD 1993. Prevalence of cutaneous leishmaniasis along the Nile River north of Khartoum (Sudan) in the aftermath of an epidemic in 1985. Am J Trop Med Hyg48: 44-49.
Kendrick RK 1986. Preliminary field observations on the flight speed of a phlebotomine sandfly. Trans R Soc Trop Med Hyg80: 138-142.
Kesari S, Bhunia GS, Kumar V, Jeyaram A, Ranjan A, Das P 2011. A comparative evaluation of endemic and non-endemic region of visceral leishmaniasis (kala-azar) in India with ground survey and space technology. Mem Inst Oswaldo Cruz106: 515-523.
Kishore K, Kumar V, Kesari S, Dinesh D, Kumar AJ, Das P, Bhat-tacharya SK 2006. Vector control in leishmaniasis. Indian J Med Res123: 467-472.
López Y, Osorio L, Alvarez G, Rojas J, Jiménez F, Gómez C, Ferro C 1996. Sandfly Lutzomyia longipalpis in a cutaneous leishmaniasis focus in central Colombia. Mem Inst Oswaldo Cruz 91: 415-419.
Mukhopadhyay AK, Rahman SJ, Chakravarty AK 1990. Effects of flood control on immature stages of sandflies in flood prone kala-azar endemic villages of north Bihar, India. WHO/VBC90: 986.
Picado A, Murari LD, Vijay K, Diwakar SD, Suman R, Shri PS, Pra-deep D, Marc C, Marleen B, Clive D 2010. Phlebotomus argentipes seasonal patterns in India and Nepal. J Med Entomol47: 283-286.
Qiu ZY, Li J, Guo HJ 1998. Application of remote sensing technique, Wuhan University Press, Wuhan,p. 97- 98.
Ranjan A, Sur D, Singh VP, Siddique NA, Manna B, Lal CS, Sinha PK, Kishore K, Bhattacharya SK 2005. Risk factors for Indian kala-azar. Am J Trop Med Hyg73: 74-78.
Remaudière G 1992. A simplified method for mounting aphids and oth-er small insects in Canada balsam. Rev Fr Entomol 14: 185-186.
Rosenfield GH, Fitzpatrick L 1986. Kappa coefficient of agreement as a measure of thematic classification accuracy. Photogramm Eng Rem S 52: 223-227.
Sabesan S, Raju HKK, Srividya A, Das PK 2006. Delimitation of lymphatic filariasis transmission risk areas: a geo-environmental approach. Filaria J5: 12.
Saha S, Ramachandran R, Hutin YJF, Gupte MD 2009. Visceral leish-maniasis is preventable in a highly endemic village in west Ben-gal, India. Trans R Soc Trop Med Hyg103: 737-742.
Sánchez-García L, Berzunza-Cruz M, Becker-Fauser I, Rebollar-Téllez EA 2010. Sandflies naturally infected by Leishmania (L.) mexicana in the periurban area of Chetumal city, Quintana Roo, México. Trans R Soc Trop Med Hyg104: 406-411.
Sanyal RK 1985. Leishmaniasis in the Indian subcontinent. In KP Chang, RS Bray (eds.), Leishmaniasis, Elsevier, Amsterdam, p. 443-467.
Sanyal RK, Banerjee DP, Ghosh TK, Ghose JN, Misra BN 1979. A longitudinal review of kala-azar in Bihar. Comm Dis 11: 149-169.
Schaefer KU, Kurtzhalz JA, Gachihi GS, Muller AS, Kager PA 1995. A prospective sero-epidemiological study of visceral leishmania-sis in Baringo district, Rift Valley Province, Kenya. Trans Roy Soc Trop Med Hyg89: 471-475.
Schlein Y, Jacobson RL 1999. Sugar meals and longevity of the sand-fly Phlebotomus papatasi in an arid focus of Leishmania major
in the Jordan Valley. Med Vet Entomol13: 65-71.
Sharma U, Singh S 2008. Insect vectors of Leishmania: distribution, physiology and their control. J Vector Borne Dis45: 255-272.
Sharma A, Bern C, Varghese B, Chowdhury R, Haque R, Ali M, Amann J, Ahluwalia IB, Wagatsuma Y, Breiman RF, Maguire JH, McFarland DA 2006. The economic impact of visceral leish-maniasis on households in Bangladesh. Trop Med Int Health11: 757-764.
Singh A, Roy SP, Kumar R, Nath A 2008. Temperature and humidity play a crucial role in the development of P. argentipes. J Eco-physiol Occup Health 8: 47-52.
Singh NS, Singh DP 2009. Seasonal occurrence of Phlebotominae sandflies (Phlebotominae: Diptera) and it’s correlation with kala-azar in eastern Uttar Pradesh, India. SoutheastAsian J Trop Med Public Health40: 458-462.
Sudhakar S, Srinivas T, Palit A, Kar SK, Bhattacharya SK 2006. Mapping of risk prone areas of kala-azar (visceral leishmaniasis) in parts of Bihar state, India: an RS and GIS approach. J Vect Borne Dis43: 115-122.
Thakur CP 2000. Socio-economics of visceral leishmaniasis in Bihar (India). Trans R Soc Trop Med Hyg94: 156-157.
Thompson MC, Elnaiem DA, Ashford RW, Connor SJ 1999. Toward a kala-azar risk map for Sudan: mapping the potential distribution of Phlebotomus orientalis using digital data of environmental variables. Trop Med Int Healt4: 105-113.
Thompson RA, Maguire JH, de Oliveira Lima JW, Scholl DT, Braud DH 2004. Association of remotely sensed environmental indices with visceral leishmaniasis in Brazil. GISVET’04, 2nd Interna-tional Conference on the Applications of GIS and Spatial Analy-sis to Veterinary Science, Held at the University of Guelph, On-tario Canada 23th-25th June 2004, p. 12-14.
Tucker CJ 1979. Red and photographic infrared linear combinations for monitoring vegetation. Remote Sens Environ 8: 127-150.
Victora CG, Huttly SR, Fuchs SC, Olinto MT 1997. The role of con-ceptual frameworks in epidemiological analysis: a hierarchical approach. Int J Epidemiol26: 224-227.
Werneck GL, Costa CHN, Walker AM, David JR, Wand M, Maguire JH 2007. Multilevel modelling of the incidence of visceral leish-maniasis in Teresina, Brazil. Epidemiol Infect135: 195-201.
WHO - World Health Organization 1990. Control of the leishmania-sis. Tech Rep Ser 793: 1-158.