HYDRODYNAMIC MODEL INTERCOMPARISON FOR THE PATOS
LAGOON (BRAZIL)
Flávio Martins1, Elisa H.L. Fernandes2
1Escola Superior de Tecnologia, Universidade do Algarve, Campus da Penha, 8005-332 Faro, Portugal. [email protected] 2Fundação Universidade Federal do Rio Grande, Depto. de Física, Laboratório de Oceanografia Física, CP 474,
CEP 96201-900, Brazil. [email protected]
ABSTRACT
An intercomparison study is carried out between two models with different formulations and spatial discretizations in order to overcome the limitations posed by the standard calibration and validation procedures and improve confidence in the hydrodynamic results for the Patos Lagoon. Numerical simulations were carried out applying the TELEMAC and MOHID models, based on the same boundary conditions and identical calibration coefficients so differences in calculated flow conditions result from the formulations and parameterizations of each model. Results from both models are compared with measurements from three stations inside the lagoon. Preliminary results indicate that both models compare well with the measurements and with each other. These results increase the confidence on hydrodynamic results for the Patos Lagoon and provide the first step towards water quality studies for the area.
KEY WORDS
Numerical modelling, hydrodynamics, coastal lagoon, wind.
1. Introduction
The basic steps towards the development of a reliable numerical study are based on the calibration and validation of the selected model for a specific application [1]. Even when these tasks are successfully completed, there is no procedure to assure the accuracy of the solution in the entire domain. A common procedure to access model performance is to compare results from different models in the same domain and with the same boundary conditions [2]. Differences between model performances arise from several different sources. Physical processes considered, numerical formulation, grid arrangement, spatial discretization and boundary implementation are just a few examples. Thus, a comparison between different numerical models must be planned to consider only the processes and methods of interests as variables. The bathymetric construction is a good example of this. If the comparison aims to evaluate the effect of geometry definition on the hydrodynamics,
the bathymetries (meshes) must be constructed separately from scratch for the two models. The same can be assumed for the data used to impose the boundary conditions. The comparison procedure must start with the calibration and validation of the two models using the same data set. At this stage, the quality of model results can be compared and balanced with model characteristics such as spatial discretization, computational time and operationality. The comparison, however, should not end at this point. Results can also be compared for locations where measurements are not available, and this is one of the major advantages of this methodology. Although it is not possible to establish which model produces the best results in these points, similar results from both models improve the confidence in the solution, as it is unlikely that different models produce exactly the same wrong result in the same point. Points with different results are also very important since they point out problems in one or on both models.
In this paper two models with different formulations and spatial discretizations were calibrated and applied to the Patos Lagoon (Brazil). The primary objective of this work is to establish the best approach to future water quality and ecological studies in Patos lagoon.
In the next sections a description of the lagoon and of the models is given, the rationale beyond the comparisons is proposed, the simulation conditions are set and the results are presented and analysed.
2. The Patos Lagoon
The Patos Lagoon is located in the southern Brazilian coastline between 30-32 oS and 50-52 oW, and is considered the largest choked coastal lagoon in the world [3]. With a length of 250 km and average width of 40 km, the lagoon has a surface area of 10,360 km2.
Similar to the majority of choked coastal lagoon systems, the Patos Lagoon is wind forced rather than tidal driven. The wind drives the lagoon subtidal circulation in time intervals of 3 -16 days coincident with the passage of frontal systems over the area. The local wind produces a water level set-up (set-down) in the southern part of the lagoon and a depression (rise) in elevation in the northern part during NE (SW) wind events, and the long period
oscillations generated offshore by non-local winds are attenuated as they propagate into the lagoon [4]. Subtidal exchanges between the lagoon and the coastal ocean are driven by the pressure gradient resulting from combined local and non-local forcing effects with NE/SW winds driving seaward/landward flows [5], although fluvial discharge may also generate seasonal pressure gradients [6]. The mean annual freshwater discharge at the head of the lagoon is 2000 m3 s-1, although peaks of 8,000 and 12,000 m3 s-1 can be observed during El Niño events [5]. During this period, the lagoon can remain fresh for several months.
3. Model Description
Two different models were the focus of this study: TELEMAC and MOHID. They employ completely different approaches: TELEMAC is a commercial code using finite elements in a triangular mesh. MOHID is an academic code using finite volumes in a rectangular Cartesian grid. In the next section the models characteristics are overviewed.
3.1 TELEMAC
TELEMAC is a flow model based on the finite element technique developed by the Laboratoire National d´Hydraulique (EDF, France) to simulate the flow in estuaries and coastal zones [7], [8]. The TELEMAC-2D code solves the second order partial differential equations for depth-averaged fluid flows derived from the full three-dimensional Navier-Stokes equations. This gives a system consisting of an equation for mass continuity and two force-momentum equations, where the only assumption is that the fluid should be Newtonian. The equations at constant density are averaged over the vertical by integrating from the bottom to the surface. The source terms of the momentum equations include friction, Coriollis and wind force, with the bed friction being represented as a quadratic function of velocity and the parameterized friction coefficient being chosen by the user.
In order to solve the equations TELEMAC-2D considers for the solid boundaries that no mass flux of water occurs through the bottom and closed lateral faces and there is a free slip condition at the wall for all vectors tangent to it. The water surface height is free and the surface boundary condition is a stress calculated from the components of the wind velocity and the coefficient of wind influence. For the liquid boundaries the user can define, for each of the principal variables, if there is a prescribed or a free value at each point of the mesh. The model solves the equations on non-structured grids, with triangular finite elements. The nature of finite element mesh allows the fitting of various sized elements within a specified boundary, which allows high resolution in areas of increased bed slope or narrow channels and low resolution in areas where detail is not required. Fernandes
et al [9], present the calibration and validation of the TELEMAC model for the Patos Lagoon.
3.2 MOHID
MOHID water modelling system is a modular system that comprises models for hydrodynamics, transport, water quality and sediment (www.mohid.com). The system architecture is object oriented [10]. The velocity fields are computed in the hydrodynamic module, using a 3D formulation with hydrostatic and Boussinesq approximations. The equations are solved using the finite volume method with an ADI (Alternate Direction Implicit) discretization. The resulting equations are obtained by integration of the Navier-Stokes equations over the cells, as indicated in equation 1.
( )
( )
dA g z n dA n dA n dV t A xy A T A V ⋅ − − ∂ ∂ + ⋅ − = ∂ ∂∫
∫
∫
∫
v vv υ v (η ) dA n dz g xy A z ⋅ − −∫ ∫
η ρ ρ ρ 0 0 p n dA xy A atm∫
− dV V∫
× Ω + 2 v (1)Where v is the velocity vector, V the cell volume, n the normal to the cell and Ω the Earth rotation. The horizontal grid is the orthogonal Arakawa C type staggered grid. In the vertical direction a generic vertical geometry is implemented [11]. At the open boundaries both imposed values and radiative conditions can be set [12]. In tidal flats a moving boundary condition is implemented enabling the drying and flooding of cells as a function of the water level. The bottom stress is implemented implicitly using a quadratic law. The wind stress is imposed explicitly. The Cartesian horizontal mesh can be refined in two different manners: using a variable spatial step and nesting high resolution submodels. The first approach has the advantage of imposing a smooth variation from high to low resolution regions. It has the disadvantage, however, of requiring more memory. The submodel approach requires less memory but boundary problems can arise. Independently of the method, an important advantage of Cartesian mesh is the possibility of developing a new domain. In this example the project started from scratch and was ready for the first run in only three days.
4. Simulation Setup
Since water quality simulations are typically very time consuming, a comparison between model results must include the performance as an issue. Another characteristic of these simulations is that they use a lower spatial resolution to improve speed. Thus, the mesh type and resolution is also an issue.
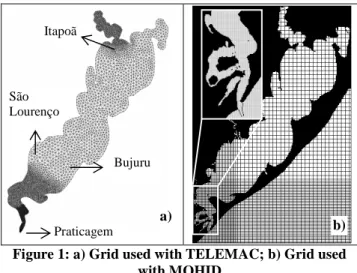
The mesh construction was developed independently for the two models using raw bathymetric data digitised from Brazilian Navy nautical charts (2140, 2101, 2102, 2103, 2106 and 2112). The TELEMAC finite element grid (Figure 1A) is composed by 7995 triangular elements
with spatial steps ranging from 145 to 4612 m. The MOHID finite volume grid, is composed by 436X298 cells with spatial steps ranging from 300 to 850 meters (Figure 1B). The grid lines in this case are showed with a step of five cells for clarity and a zoom with a step of one grid cell is appended to show the higher resolution in the estuary.
Figure 1: a) Grid used with TELEMAC; b) Grid used with MOHID
The boundary conditions were the same for the two models: a dynamic sea surface elevation was imposed at the ocean open boundary, and the wind was considered dynamic in time and constant in space (data from Rio Grande Pilots – Praticagem station). The values were corrected in phase for the boundary location. Monthly mean fresh water discharges from Brazilian National Water Agency (ANA) were imposed at the top of the lagoon. The calibration parameters from [9] were used in both models (nmanning = 0.02 and aWind = 1.5E-6).
5. Model Results
Measurements of water elevation were available for three stations along the lagoon: Itapuã, S. Lourenço and Bujuru (Figure 1). A five-month long time series of sea surface elevation was used to compare with results from both models (Figure 2).
Results from the two models are similar for most of the time, except for the Bujuru station, where the error is 4 cm higher with MOHID. The root mean square of the absolute error was computed for the two models as shown in Table 1. The higher differences occur during episodes of wind blowing transversally to the lagoon, especially from the NW quadrant. This is likely to explain the difference in results, since in this situation the poorer resolution of the Cartesian mesh in this region may not be able to reproduce properly the local forcing.
Itapuã 0.6 0.8 1.0 1.2 1.4 1.6 1.8 2.0 1 8 15 22 29 36 43 50 57 64 71 78 85 92 99 106 113 120 127 134 141 148 Days E levat io n ( m ) Measurements Telemac Mohid São Lourenço 0.6 0.8 1.0 1.2 1.4 1.6 1.8 2.0 1 8 15 22 29 36 43 50 57 64 71 78 85 92 99 106 113 120 127 134 141 148 Days E levat io n ( m ) Measurements Telemac Mohid Bujuru 0.2 0.4 0.6 0.8 1.0 1.2 1 8 15 22 29 36 43 50 57 64 71 78 85 92 99 106 113 120 127 134 141 148 Days E levat io n ( m ) Measurements Telemac Mohid
Figure 2: Comparison between measured and calculated sea surface elevation for three stations inside the lagoon.
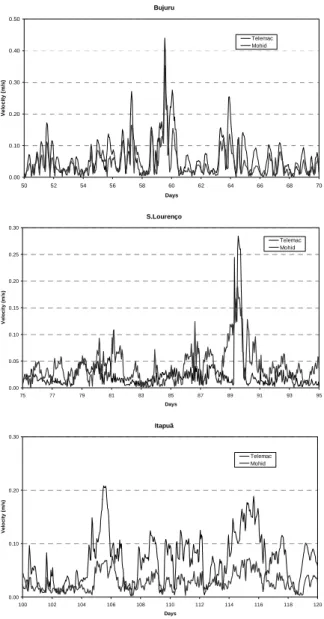
Velocities for the three points are compared in Figure 3. In these points velocity measurements were not available but the agreement between the models increase the confidence in the results.
Table 1: Root mean square of the absolute error for the two models (m).
Location Telemac Mohid Itapuã 0.1146 0.1165 S. Lourenço 0.0948 0.1051 Bujuru 0.0870 0.1261 b) a) Praticagem São Lourenço Bujuru Itapoã
Bujuru 0.00 0.10 0.20 0.30 0.40 0.50 50 52 54 56 58 60 62 64 66 68 70 Days V e lo c it y ( m /s ) Telemac Mohid S.Lourenço 0.00 0.05 0.10 0.15 0.20 0.25 0.30 75 77 79 81 83 85 87 89 91 93 95 Days V e lo cit y ( m /s) Telemac Mohid Itapuã 0.00 0.10 0.20 0.30 100 102 104 106 108 110 112 114 116 118 120 Days Velo cit y ( m /s) Telemac Mohid
Figure 3: Comparison between simulated water velocities for three stations inside the lagoon.
6. Conclusions
The preliminary results presented in this study show that both models reproduce well the water level measurements from stations inside the lagoon. Comparisons of velocities calculated by both models also show reasonable agreement. Thus, these results increase the confidence in the two models for the Patos Lagoon. Future steps of this study include implementing a water quality model for the lagoon. For this type of simulation the computational time is an important limiting factor. The MOHID model has spent about half the time of the TELEMAC for an equivalent computer setup. Though the TELEMAC simulations are slightly more accurate, the MOHID model seems to be a good candidate for application in ecological studies.
References:
[1] R.T. Cheng, V. Casulli, & J.W. Gartner, Tidal, Residual, Intertidal Mudflat (TRIM) model and its applications to San Francisco Bay, California. Estuarine Coastal and Shelf Science, 36, 1993, 235-280.
[2] S.Barnard, B. Barnier, A. Beckman, C. Boening, M. Coulibaty, D. DeCuevas, J. Dengg, C. Dieterich, U. Ernst, P. Herrmann, Y. Jia, P. Killworth, J. Kroeger, M. Lee, C. LeProvost, J-M. Molines, A. New, A. Oschlies, T. Reynauld, L. West & J. Willebrand, DYNAMO: Dynamics of North Atlantic Models: Simulation and assimilation with high resolution models (Berichte aus dem Institut fuer Meereskunde an der Christian-Albrechts-Universitat Kiel, 1997 nº 294 334 pp. ISSN 0341-8561).
[3] B. Kjerfve, Comparative oceanography of coastal lagoons In: Estuarine variability. Eds. D.A. Wolfe. Academic Press, Orlando, Florida, 1986, 63-81.
[4] E.H.L. Fernandes, I. Mariño-Tapia, K.R. Dyer & O.O. Moller (in press). The attenuation of tidal and subtidal oscillations in the Patos Lagoon estuary. Ocean Dynamics.
[5] E.H.L. Fernandes, K.R. Dyer, O.O. Moller & L.F.H. Niencheski, The Patos Lagoon hydrodynamics during an El Niño event (1998), Continental Shelf Research 22, 2002,1699-1713.
[6] O.O. Moller, J.A. Lorenzzetti, J.L. Stech & M.M. Mata, The Patos Lagoon summertime circulation and dynamics Continental Shelf Research 16, 1996, 335-351. [7] J.M.Hervouet & Van Haren, TELEMAC-2D Principle Note (Electricité de France, 1994, Technical Report HE-43/94/051/B).
[8] J.M.Hervouet & Van Haren, Recent advances in numerical methods for fluid flows In: Floodplain Processes. Eds. M.G. Anderson, D.E. Walling & P.D. Bates, 1996, 183-214.
[9] E.H.L. Fernandes, K.R. Dyer, & L.F.H. Niencheski, TELEMAC-2D calibration and validation to the hydrodynamics of the Patos Lagoon (Brazil), Journal of Coastal Research SI 34, 2001, 470-488.
[10] R. Miranda, F. Braunschweig, P. Leitão, R. Neves, F. Martins & A. Santos, MOHID 2000 - A coastal integrated object oriented model, Proc. Hydraulic Engineering Software VIII, Lisbon, 2000, 393-401, Ed. W.R. Blain & C.A. Brebbia, WITpress.
[11] F. Martins, R. Neves, P. Leitão & A. Silva, 3D modeling in the Sado estuary using a new generic coordinate approach, Oceanologica Acta, 24, 2001, S51-S62.
[12] H. Coelho, R. Neves, M. White, P. Leitão & A. Santos, A Model for Ocean Circulation on the Iberian Coast, Journal of Marine Systems, 32(1-3), 2002, 153-179.