F
F
i
i
n
n
a
a
n
n
c
c
i
i
a
a
l
l
i
i
s
s
a
a
t
t
i
i
o
o
n
n
a
a
n
n
d
d
t
t
h
h
e
e
P
P
o
o
r
r
t
t
u
u
g
g
u
u
e
e
s
s
e
e
r
r
e
e
a
a
l
l
i
i
n
n
v
v
e
e
s
s
t
t
m
m
e
e
n
n
t
t
:
:
a
a
s
s
u
u
p
p
p
p
o
o
r
r
t
t
i
i
v
v
e
e
o
o
r
r
a
a
d
d
i
i
s
s
r
r
u
u
p
p
t
t
i
i
v
v
e
e
r
r
e
e
l
l
a
a
t
t
i
i
o
o
n
n
s
s
h
h
i
i
p
p
?
?
R
Ri
i
ca
c
ar
rd
do
o
B
Ba
a
rr
r
ra
ad
da
as
s
S
Sé
ér
rg
gi
io
o
L
La
ag
go
oa
a
V
Ve
er
rs
sã
ão
o
r
re
ev
vi
is
st
ta
a
-
-
S
Se
e
te
t
e
mb
m
br
ro
o
d
de
e
2
20
01
15
5
W
W
P
P
n
n
.
.
º
º
2
2
0
0
1
1
4
4
/
/
0
0
6
6
DOCUMENTO DE TRABALHO WORKING PAPERFinancialisation and the Portuguese real investment:
A supportive or disruptive relationship?
1Ricardo Barradas
*
Sérgio Lagoa* *
WP n.º 2014/06
DOI: 10.7749/dinamiacet-iul.wp.2014.06
1. INTRODUCTION ... 3
2. THE RELATIONSHIP BETWEEN FINANCIALISATION AND REAL INVESTMENT ... 4
3. FINANCIALISATION AND REAL INVESTMENT: AN ECONOMIC MODELISATION ... 9
4. DATA AND METHODOLOGY: THE ECONOMETRIC FRAMEWORK ... 12
4.1 DATA ... 12
4.2 METHODOLOGY ... 14
5. EMPIRICAL RESULTS AND DISCUSSION ... 15
6. CONCLUSION... 24
7. REFERENCES ... 25
8. APPENDIX ... 31
1 Versão revista: Setembro 2015. Primeira versão: Outubro de 2014.
*
DINÂMIA’CET– IUL and ISCTE – University Institute of Lisbon, Higher School of Communication and Media Studies (Polytechnic Institute of Lisbon), Higher Institute of Accounting and Administration of Lisbon (Polytechnic Institute of Lisbon). Corresponding author rbarradas@escs.ipl.pt / rpbarradas@iscal.ipl.pt.**
DINÂMIA’CET–IUL and ISCTE – University Institute of Lisbon. Corresponding author sergio.lagoa@iscte.pt._____________________________________________________________________________
DINÂMIA’CET – IUL, Centro de Estudos sobre a Mudança Socioeconómica e o Território ISCTE-IUL – Av. das Forças Armadas, 1649-026 Lisboa, PORTUGAL
Tel. 210464031 - Extensão 293100 E-mail: dinamia@iscte.pt www.dinamiacet.iscte.pt
2
Financialisation and the Portuguese real investment:
A supportive or disruptive relationship?
2ABSTRACT
This paper makes an empirical analysis of the relationship between financialisation and real investment by Portuguese non-financial corporations from 1977 to 2013. In theory, while financialisation leads to a rise in financial investments by non-financial corporations and thus deviates funds from real investment, it also intensifies the pressure for financial payments and therefore restricts the funds available for real investment. We estimate an aggregate investment function including standard variables (profitability, debt, cost of capital, savings rate and output growth) and two measures of financialisation (financial receipts and financial payments). The paper concludes that there is a long-term investment equation, and finds evidence that the process of financialisation has hampered real investment largely as a result of financial payments. The paper also identifies that debt is detrimental to real investment.
KEYWORDS
Financialisation, Investment, Vector Error Correction Model.
JEL CLASSIFICATION
C22, D20, E22 and E44.
2 The authors are grateful for the helpful comments and suggestions from an anonymous referee, Ana
Costa, Ana Santos, Martin Siddiqui, Nuno Teles, Ricardo Paes Mamede, the participants in the INFER International Workshop on European Economic Integration: Present and Future Challenges (ISEG – University of Lisbon, June 2014), the participants in the Research Seminar for PhD in Economics (ISCTE – University Institute of Lisbon, June 2014), the participants in 5th Annual Conference in Political Economy
(University of Naples “L’Orientale”, September 2014) and the participants in INFER Workshop on Heterodox Economics (Faculty of Economics – University of Coimbra, April 2015). The usual disclaimer applies.
_____________________________________________________________________________
DINÂMIA’CET – IUL, Centro de Estudos sobre a Mudança Socioeconómica e o Território ISCTE-IUL – Av. das Forças Armadas, 1649-026 Lisboa, PORTUGAL
Tel. 210464031 - Extensão 293100 E-mail: dinamia@iscte.pt www.dinamiacet.iscte.pt
3
1. INTRODUCTION
Mainstream economics advocates that the financial sector plays a crucial role in boosting the real investment of non-financial corporations (e.g. Palley, 2007; Orhangazi, 2008a; Demir, 2009). Nonetheless, the literature on financialisation (Orhangazi, 2008a and 2008b; Hein and van Treeck, 2010; Hein, 2012; Hein and Dodig, 2015; among others) stresses two channels through which the development of finance impair real investment. Firstly, non-financial corporations are now more engaged in financial activities due to the incentives and pressures to generate short-term profits. This diverts funds from productive activities (“crowding out” effect). Secondly, financial markets increasingly require payments to be made by non-financial corporations, thus using up funds that could have been used to put long-term productive projects in place.
In light of this, over recent years a small body of literature has emerged testing the hypothesis that financialisation has negative effects on non-financial corporations' investments. Most of them derive and estimate behavioural equations for investment, finding statistical evidence that this phenomenon has hampered real investment (e.g. Stockhammer, 2004; Orhangazi, 2008a and 2008b; van Treeck, 2008; and Onaran et al., 2011).
This paper aims to evaluate the impact of financialisation on the real investment of Portuguese non-financial corporations between 1977 and 2013, and contributes to the literature in two ways. First, it focuses on the behaviour of Portuguese non-financial corporations, whereas most studies focus on the USA or the UK. The Portuguese economy is considered to be less financialised than the USA or UK economies and its main agents of financialisation are banks as opposed to financial markets. To use the terminology of Orsi and Solari (2010) and Sawyer (2013), the Portugal has a “bank-based” financial system in which banks are the economy's main financing agents. Second, the paper uses a Vector Error Correction Model (VECM) to assess the relationship between financialisation and real investment, which allows a distinction to be made between the short-term and the long-term effects of financialisation.
Accordingly, we estimate an equation that describes the investment of non-financial corporations; it includes traditional variables (profitability, debt, cost of capital, savings rate and output growth) and two proxies to capture the two channels of financialisation (financial receipts and financial payments of non-financial firms). We study an aggregate investment function to study the macroeconomic relevance of financialisation.
We identify a disruptive relationship between financialisation and real investment. The statistical evidence of the financial payment channel is more vigorous than that of the financial
_____________________________________________________________________________
DINÂMIA’CET – IUL, Centro de Estudos sobre a Mudança Socioeconómica e o Território ISCTE-IUL – Av. das Forças Armadas, 1649-026 Lisboa, PORTUGAL
Tel. 210464031 - Extensão 293100 E-mail: dinamia@iscte.pt www.dinamiacet.iscte.pt
4 receipt channel, and this may be explained by the structure of the Portuguese productive system.
A disruptive relationship is also identified between debt and real investment.
The remainder of the paper is organised as follows. Section 2 reviews the literature on the relationship between the financialisation and investment of non-financial corporations. An investment equation is presented in Section 3 before describing the data and the econometric methodology in Section 4. Section 5 provides the main results and discussion. Finally, Section 6 concludes.
2. THE RELATIONSHIP BETWEEN FINANCIALISATION AND REAL
INVESTMENT
It is widely acknowledged that economic growth and employment depend on the capacity to accumulate physical capital. Mainstream economics claims that financial institutions and financial markets play a crucial role in promoting the real investment of non-financial corporations. It is argued that the financial sector and financial markets facilitate the provision of funding (by channelling savings to borrowers through credit and other forms), increase the efficiency in resources allocation by screening and monitoring investments, reduce market imperfections, reduce transaction costs, and provide risk management services (Orhangazi, 2008a).
Palley (2007) presents several reasons why conventional economic theory supports the growing importance of finance. Firstly, finance enhances economic efficiency since financial markets help foresee future economic outcomes and allow economic agents to assemble portfolios with better combinations of returns and risk. Secondly, he refers to Friedman’s (1953) argument that financial speculation or bubbles are stabilising phenomena, insofar as asset prices tend towards their fundamental levels. Thirdly, the financial market’s outcomes improve as finance grows because the rise in traded volumes increases liquidity and minimises the manipulation of market prices. Finally, the development of finance allows firms to better identify signs from the market about when to invest: when the market price of capital is larger than its replacement cost (q Tobin larger than one), it indicates that capital is scarce and profitable investment opportunities are available.
In the same vein, Demir (2009) stresses that financial liberalisation can generate a deepening of capital markets, a reduction of agency costs, a decrease in the asymmetry of information and increased efficiency. This process could feed a transfer of domestic and foreign
_____________________________________________________________________________
DINÂMIA’CET – IUL, Centro de Estudos sobre a Mudança Socioeconómica e o Território ISCTE-IUL – Av. das Forças Armadas, 1649-026 Lisboa, PORTUGAL
Tel. 210464031 - Extensão 293100 E-mail: dinamia@iscte.pt www.dinamiacet.iscte.pt
5 savings to more efficient investment projects at lower costs, contributing significantly to the dynamism of investment and economic growth.
Nevertheless, the literature on financialisation typically argues that this phenomenon has hampered the real investment of non-financial corporations through two ways. Firstly, it is argued that financialisation implies a rise in non-financial corporations' investment in financial assets and thus diverts funds from real activities. Secondly, strong pressures are exerted on non-financial corporations to increase their payments to the non-financial markets in the form of interest, dividends and stock buybacks.
Regarding the first channel, Krippner (2005) shows that non-financial corporations have become more engaged in financial activities, as demonstrated by the growing importance of both financial revenues and profits in proportion of revenues and profits from productive activities, respectively. Lagoa et al. (2014) note that this behaviour is also shared by Portuguese non-financial corporations, which have increased their financial revenues as a percentage of gross operating surplus. Cingolani (2012) argues that this trend reveals a greater accumulation of financial rents to the detriment of productive accumulation.
In general, corporations use available funds either to invest in real activities or to acquire financial assets. Indeed, Tobin (1965) has already noted that financial investments and real investments could be perfect substitutes. So if non-financial corporations increase investments in financial assets, they will have fewer funds available to invest in productive projects; this gives rise to the “crowding out” of real investment since both external and internal funds are limited. It is therefore a “management’s preference channel”, as labelled by Hein (2012) and Hein and Dodig (2015).
A number of explanations can be provided for why the financial revenues of financial firms have increased. Firstly, Crotty (2005) suggested that the increase in non-financial corporations' non-financial investments (which also take the form of buying or expanding financial subsidiaries) was caused by pressure from shareholders to raise current profitability and thus a focus on shorter planning horizons. The short-termism of non-financial corporations reflects the tendency to sacrifice long-term investments in order to improve short-term profits (Hein 2012; Aspara et al., 2014; and Hein and Dodig, 2015). Samuel (2000) defines this focus by managers on short-term profits at the expense of long-term expansion as “managerial myopia”. This attitude is encouraged by the evaluation of managers and their salaries based on short-term profitability and stock price gains (Tomaskovic-Devey et al., 2015).
On the other hand, Crotty (2005) and Orhangazi (2008a and 2008b) argue that corporations may be trying to circumvent both the decrease in profits from real sector activities and the increase in the cost of external funds since the 1980s. Firms were forced to engage in
_____________________________________________________________________________
DINÂMIA’CET – IUL, Centro de Estudos sobre a Mudança Socioeconómica e o Território ISCTE-IUL – Av. das Forças Armadas, 1649-026 Lisboa, PORTUGAL
Tel. 210464031 - Extensão 293100 E-mail: dinamia@iscte.pt www.dinamiacet.iscte.pt
6 financial activities to remain economically viable (Soener, 2015). For example, in their analysis of the behaviour of US retailers, Baud and Durand (2012) conclude that their involvement in financial activities arose from the decline in profits from real activities due to the maturation of markets, stricter regulations, sluggish demand growth and increasing competition. According to Crotty, this behaviour is commonly referred as the “neoliberal paradox” because non-financial corporations are forced (by their shareholders) to remain competitive and profitable while lacking the conditions for growth through productive investments. Financial activities of non-financial corporations could be said to be a means to “grow fast in a slow-growth economy” (Lin and Tomaskovic-Devey, 2013).
Concurrently, Akkemik and Özen (2014) find that the rise in financial investments in Turkish firms is a response to macroeconomic uncertainty and increased risk. Soener (2015) adds that non-financial corporations use financial instruments to mitigate risk. Baud and Durand (2012) highlight that the preference for financial liquid assets tends to increase in periods of uncertainty, whereby financial investments seem to follow a kind of “wait-and-see” strategy (invest in these assets until uncertainty dissipates).
Finally and following a neo-institutionalism perspective, Soener (2015) presents two further reasons that could explain non-financial corporations' greater involvement in financial activities. The first is related with a process of organisational learning, according to which managers have a mimetic behaviour and are imitating competitors when they engage in financial activities. The second explanation is associated with an institutional transmission of knowledge and practices between some specific actors (namely financial executives and independent consultants) and managers. The former actors have a strong know how of corporate finance and are able to persuade managers to engage more in financial activities.
However, some authors (e.g. Fazzari et al., 1988; Gertler and Gilchrist, 1994; and Ndikumana, 1999) claim that higher investment in financial assets could be positive and important for productive investments, especially if non-financial corporations use the returns from financial investments to finance real investments. As referred by Orhangazi (2008a and 2008b), this could be quite relevant in the case of small corporations that face greater financial constraints. Nevertheless, the literature on financialisation generally excludes this hypothesis on the grounds that there is no guarantee that non-financial corporations use financial incomes to fund real investments. On the contrary, those incomes will probably be re-invested in financial assets or distributed as dividends to shareholders.
The second channel through which financialisation depresses non-financial corporations' real investment is related with the “profit without investment” assumption (Cordonnier and Van de Velde, 2014), according to which lower retention ratios restrict funds
_____________________________________________________________________________
DINÂMIA’CET – IUL, Centro de Estudos sobre a Mudança Socioeconómica e o Território ISCTE-IUL – Av. das Forças Armadas, 1649-026 Lisboa, PORTUGAL
Tel. 210464031 - Extensão 293100 E-mail: dinamia@iscte.pt www.dinamiacet.iscte.pt
7 available for real investments; this hampers long-term investment projects, including innovation, research and development (Aglietta and Breton, 2001; Duménil and Lévy, 2004). This is referred to by Hein (2012) and Hein and Dodig (2015) as the “internal means of finance channel”. Besides the large dividends payments, the high levels of indebtedness of non-financial corporations in the financialisation era have also implied an upward trend in interest payments in recent years (Orhangazi, 2008a and 2008b).
Managers of non-financial corporations raise short-term payout ratios not only out of personal interests, but also due to shareholder pressure. Moreover, Orhangazi (2008a and 2008b) emphasises that there is an incentive for managers to increase share prices in the short-term (distributing a high level of dividends) because their remuneration schemes are based on the short-term evolution of those prices. He further argues that the growing importance of institutional investors (who seek constant appreciation in share prices) in the financial markets also presses corporations to practice high pay-out ratios. A failure by non-financial corporations to realise the expected financial payments leads to institutional investors walking out, a fall in share prices and probably a takeover.
Lazonick and O’Sullivan (2000) and Stockhammer (2010) emphasise that the substantial rise in financial payments made by non-financial corporations over the last three decades has been caused by a new design of corporate governance that favours shareholder value, commonly referred to as a “shareholder value orientation”. Aglietta (2000) and van der Zwan (2014) note that, largely under the influence of institutional investors (Orhangazi, 2008b), this has been emerging as “the norm of the transformation of capitalism”, and contributes to the dissemination of new policies and practices favouring shareholders rather than other constituents of corporations (e.g. managers, employees, the State, clients, etc.). Lazonick and O’Sullivan (2000) state that the orientation has changed from one based on profit retention and reinvestment to one of downsizing the labour forces and distributing profits to shareholders; they refer to this as a shift from a “retain and reinvest” strategy to a “downsize and distribute” strategy. In this context, Levy-Orlik (2012) admit that production decisions dominated by the maximisation of shareholder value seek to reduce production costs and increase share prices without regard for employment, income equality, technological innovation or the industrial side of the business.
Some authors emphasise that the rise in financial payments could foster an increase in real investment (e.g. Orhangazi 2008a and 2008b). It is argued that higher levels of financial payments signal that corporations have higher levels of profitability and solvency. They are therefore likely to have easier access to funding at lower costs, which could be decisive for the realisation of new real investments.
_____________________________________________________________________________
DINÂMIA’CET – IUL, Centro de Estudos sobre a Mudança Socioeconómica e o Território ISCTE-IUL – Av. das Forças Armadas, 1649-026 Lisboa, PORTUGAL
Tel. 210464031 - Extensão 293100 E-mail: dinamia@iscte.pt www.dinamiacet.iscte.pt
8 Despite the increasing amount of theoretical work on the effects of financialisation on investment, empirical studies are limited (Onaran et al., 2011). Nevertheless, a relatively small body of empirical literature has emerged in recent years that estimates investment equations to make an econometric assessment of the impact of financialisation on real investment. Most of these studies find statistical evidence supporting the theoretical claim that financialisation has a negative impact on real investment of non-financial corporations.
Accordingly, Stockhammer (2004) estimates an investment equation for four countries (Germany, France, UK and USA) using the rentier income of non-financial corporations (interest and dividend incomes) as a proxy for financialisation. He finds strong support for financialisation causing a slowdown of capital accumulation in the USA and France, some support in the UK and none in Germany. Orhangazi (2008a and 2008b) also finds negative effects of financialisation in the USA; he uses not only aggregate data for non-financial corporations but also firm level data to breakdown the analysis by sector (manufacturing versus non-manufacturing corporations), industry (durables versus non-durables producers) and dimension (small versus large corporations). He uses two different proxies for financialisation, the financial profits (i.e. the income in the form of interest and dividends) and financial payments (interest and dividends payments and stock buybacks), in order to test the statistical significance of the two channels of financialisation on real investment. Van Treeck (2008) and Onaran et al (2011) also conclude that interest and dividend payments had a negative effect on non-financial investment in the USA from the 1960s to the 2000s.
We learn from the literature that we must measure the impact of financialisation using two channels: financial receipts and financial payments of non-financial corporations. We should also include variables that control for the eventual overall positive effect of the growth of finance, e.g. the reduction of credit constraints.
The literature has focused almost exclusively on large and highly developed economies, but the negative effect of financialisation on investment can be questioned even in these countries. In what follows, we make an empirical analysis of the role of financialisation in a smaller, less developed and more peripheral economy: the Portuguese economy. Financial markets are less relevant in Portugal, and many corporations are not quoted in the stock market. But even for unquoted corporations, financialisation affects real investment through the two abovementioned channels. Corporations' tendency to prefer financial investment rather than real investment is probably due to the decline in the profitability of real activities and the increased uncertainty from macroeconomic and other sources (e.g. increasing competition from emerging economies). The increase in financial payments may also be linked to a fall in corporations’ profitability, leading them to distribute more funds so that shareholders obtain higher returns in
_____________________________________________________________________________
DINÂMIA’CET – IUL, Centro de Estudos sobre a Mudança Socioeconómica e o Território ISCTE-IUL – Av. das Forças Armadas, 1649-026 Lisboa, PORTUGAL
Tel. 210464031 - Extensão 293100 E-mail: dinamia@iscte.pt www.dinamiacet.iscte.pt
9 the financial markets. In addition, more indebted corporations have to pay higher interest to banks and financial markets. Finally, even though many corporations are not quoted in the stock market, they are owned by business groups led by quoted companies and so suffer indirectly from the same type of pressure from financial investors. Other shareholders of non-quoted corporations may also be influenced by an economic culture oriented to short-term financial gains and thus demand high dividends from corporations. Namely, corporate shareholders tend to imitate competitors and follow the advice of their financial executives and consultants who are of growing importance to corporate decision-making (Soener, 2015).
3. FINANCIALISATION AND REAL INVESTMENT: AN ECONOMIC
MODELISATION
Eisner (1974) recognises that the empirical analysis of real investment is not a simple task. Davidson (2000) reaffirms this and stresses that investment decisions are essentially affected by the exogenous “animal spirits” of entrepreneurs and, therefore, hardly follow a stable functional expression.
Nevertheless, there are several studies in the literature on the main determinants of investment by corporations. In his survey of the literature, Stockhammer (2004) concludes that the main determinants of investment are capacity utilisation, profitability and the relative cost of capital. Orhangazi (2008a and 2008b) notes three additional key real and financial determinants of investment in the literature: output (or sales), level of debt and cash-flow (or internal funds). In the same vein, van Treeck (2008) and Onaran et al. (2011) point to profitability and output growth (the latter capturing the accelerator effect) as the main influencers of investment. Some authors also note the importance of savings to finance investment (e.g. Levine, 2005).
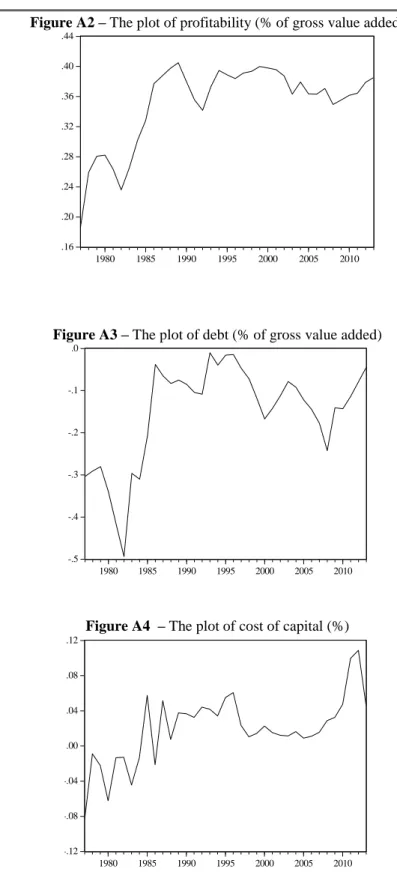
In what follows, we estimate an equation in which the investment of non-financial corporations is a function of the standard variables: profitability, level of debt, cost of capital, savings rate and output growth. In addition, we introduce two measures of financialisation in order to isolate the effects of financialisation: financial receipts and financial payments of non-financial corporations. These two variables allow us to assess the relevance of the two channels that are expected to hamper real investment, as described in the previous section.
Our investment function takes the following form:
(1) t t 7 t 6 t 5 t 4 t 3 t 2 t 1 0 t P D CC SR OG FR FP I
_____________________________________________________________________________
DINÂMIA’CET – IUL, Centro de Estudos sobre a Mudança Socioeconómica e o Território ISCTE-IUL – Av. das Forças Armadas, 1649-026 Lisboa, PORTUGAL
Tel. 210464031 - Extensão 293100 E-mail: dinamia@iscte.pt www.dinamiacet.iscte.pt
10 , where I is investment of non-financial corporations, P is profitability, D is the corporate
debt, CC is the cost of capital, SR is households' savings rate,
OG
is output growth, FR arefinancial receipts, FP are financial payments and t represents an exogenous investment shock
in period t , which is an independent and identically distributed (white noise) disturbance term with null average and constant variance (homoscedastic).
All variables pertaining to non-financial corporations (investment, profitability, debt, financial receipts and financial payments) are expressed as ratios of the respective gross value added. We choose this way instead of using the variables in volume because it better expresses the relative importance of the financialisation phenomenon. The use of ratios also allows the interpretation of the impact of coefficients in percentage points (p.p.).
It is worth noting that we are proposing to estimate an aggregate investment function, similarly to Stockhammer (2004), Orhangazi (2008a), van Treeck (2008) and Onaran et al. (2011). Since the theory of the behaviour of non-financial corporations is microeconomic in nature and we wish to explain a macroeconomic phenomenon, implicitly we have to assume the existence of a representative corporation. In addition, the use of an aggregate investment function introduces some limitations on the analysis, namely it overlooks both different levels of financialisation among corporations and heterogeneity in the behaviour of corporations by sector, industry, dimension or ownership. The advantage of the macro perspective is that it allows us to study whether the phenomenon has a macroeconomic impact. However, if we find an effect of the financialisation variables we are unable to say if this is due only to the impact of large corporations or if it is a more generalised phenomenon across all corporations. If we do not find any macroeconomic effect of the financialisation variables, we cannot rule out that they affect a subset of corporations, which however is not enough to generate a macroeconomic effect.
Turning now to the expected impact of the variables, profitability, savings rate and output growth are expected to have a positive influence on investment, unlike cost of capital and the two variables of financialisation which are expected to have a negative effect. The level of debt has an undetermined effect on investment. Therefore, the coefficients of these variables are expected to have the following signs:
(2)
Explaining now the reasons behind each beta sign, we start with the effect of profitability. It could affect investment positively by determining the level of internal funds
_____________________________________________________________________________
DINÂMIA’CET – IUL, Centro de Estudos sobre a Mudança Socioeconómica e o Território ISCTE-IUL – Av. das Forças Armadas, 1649-026 Lisboa, PORTUGAL
Tel. 210464031 - Extensão 293100 E-mail: dinamia@iscte.pt www.dinamiacet.iscte.pt
11 available for the realisation of new investments (Stockhammer, 2004). Secondly, expectations about future economic conditions are one of the most significant determinants of investment (Kopcke and Brauman, 2001); but given the uncertainty about the future, they are largely formed on the basis of past performance. Accordingly and as emphasised by Kuh and Meyer (1955) and Minsky (1975), past rather than expected profitability is the major determinant of investment.
The level of debt may have a positive or negative impact on investment. On one hand, high levels of debt can be a symptom of financial fragility and this limits new investments due to the increased difficulty of obtaining additional financing (either new debt or new equity). If the debt level is perceived unsafe, the rise in debt has a negative effect on investment because future profits may be insufficient to repay existing debt, and this raises the possibility of
bankruptcy. On the other hand, if the debt level is considered to be safe (by managers, banks
and financial markets), the rise in debt may have no effect on investment, or it may even be positive as it signals increased available funds (Orhangazi, 2008a and 2008b).
Investment also depends negatively on the cost of capital (traditionally measured by the level of real long-term interest rates) on the grounds that investment ultimately depends on the funding or opportunity costs.
Additionally, the savings rate is expected to be positively related with investment given that a higher savings rate will increase the available funds to banks and financial markets, facilitating their intermediation function and the provision of funding through credit and other forms of financing.
Output growth is also expected to be positively related with investment due to the Keynesian acceleration principle. This principle postulates that a rise in the economic activity accelerates capital accumulation (investment) in a higher magnitude, whilst a decrease in economic activity exacerbates capital depletion (disinvestment). Indeed, it is widely recognised that most corporations are more willing to invest in periods of rapid growth than during downturns. Bonfim and Neves (2001) confirm that aggregate investment in Portugal is strongly procyclical, despite demonstrating a higher level of volatility than output; this corroborates the stylised facts on investment identified by Sørensen and Whitta-Jacobsen (2005).
Finally, the rise in financial receipts can restrict real investment insofar as non-financial corporations will probably use this income to make further investments in financial assets rather than investing in real activities (the “crowding out” effect). Moreover, the rise in financial payments also constrains real investment by non-financial corporations as it reduces the funds available for financing.
_____________________________________________________________________________
DINÂMIA’CET – IUL, Centro de Estudos sobre a Mudança Socioeconómica e o Território ISCTE-IUL – Av. das Forças Armadas, 1649-026 Lisboa, PORTUGAL
Tel. 210464031 - Extensão 293100 E-mail: dinamia@iscte.pt www.dinamiacet.iscte.pt
12
4. DATA AND METHODOLOGY: THE ECONOMETRIC FRAMEWORK
4.1 DATA
We collect annual data from 1977 to 2013 in order to analyse the relationship between financialisation and real investment in Portugal. Data on all variables are available for this period and frequency and are suitable for the study for two reasons. The financialisation phenomenon became more preponderant in Portugal during the 1990s (Lagoa et al., 2013) and we therefore cover periods of both stable and increasing financialisation; and annual data is a suitable frequency to capture the determinants of investment as it is a medium- to long-term decision.
Turning now to the definition of variables. We used the gross fixed capital formation of non-financial corporations divided by the respective gross value added, also known as
investment rate. We use the gross operating surplus3 of non-financial corporations divided by
the respective gross value added (usually referred to as profit share) as a proxy of profitability.
In order to measure the level of current debt, we use the net lending/net borrowing4 of
non-financial corporations divided by gross value added.
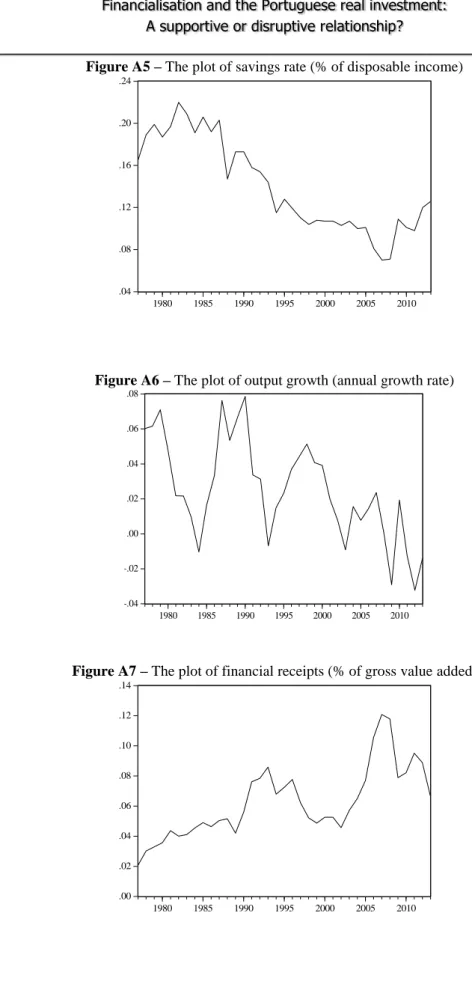
Financial receipts correspond to the sum of corporations' interest and distributed
income5 (where dividends are included) received by non-financial corporations divided by the
gross value added of those corporations. Financial payments correspond to the sum of corporations' interest and distributed income (where dividends are included) paid by non-financial corporations divided by their gross value added.
The variables of gross fixed capital formation, gross value added, gross operating surplus, net lending / net borrowing, financial receipts and financial payments of non-financial corporations were collected from the Portuguese National Accounts (at current prices and in millions of euros) of Instituto Nacional de Estatística.
3 According to the Eurostat, “gross operating surplus can be defined in the context of national accounts as
a balancing item in the generation of income account representing the excess amount of money generated by incorporated enterprises' operating activities after paying labour input costs. In other words, it is the capital available to financial and non-financial corporations which allows them to repay their creditors, to pay taxes and eventually to finance all or part of their investment”.
4 The net lending/ net borrowing of non-financial corporations is the difference between current savings
(plus capital transfers) and the respective investment. According to the OECD, “it reflects the amount of financial assets that are available for lending or needed for borrowing to finance all expenditures – current, gross capital formation, non-produced non-financial assets, and capital transfers – in excess of disposable income”. As such, a country’s non-financial corporations are net lender /net borrowers when they exhibit positive /negative values of the net lending / net borrowing.
5 The distributed income of corporations includes dividends and withdrawals from the income of
quasi-corporations (amounts that entrepreneurs withdraw for their own use from the profits earned by the quasi-corporations belonging to them).
_____________________________________________________________________________
DINÂMIA’CET – IUL, Centro de Estudos sobre a Mudança Socioeconómica e o Território ISCTE-IUL – Av. das Forças Armadas, 1649-026 Lisboa, PORTUGAL
Tel. 210464031 - Extensão 293100 E-mail: dinamia@iscte.pt www.dinamiacet.iscte.pt
13 We use the real interest rate (deflated by the GDP deflator) from AMECO database in order to measure the cost of capital of non-financial corporations. The short-term real interest rate is used between 1977 and 1984 and the long-term real interest rate, which only became available
in 19856, is used in the following years. We opt in favour of this strategy instead of using only
the short-term real interest rate since investment is a long-term decision and is therefore more affected by long-term interest rates.
The savings rate corresponds to the gross savings of households as a percentage of their
disposable income from PORDATA database7. As usual, we use the annual growth rate of gross
domestic product to describe the evolution of output growth. This variable was collected from the PORDATA database (at current prices and in million of euros) and it was deflated using the GDP deflator (2006=100), also available on the same database.
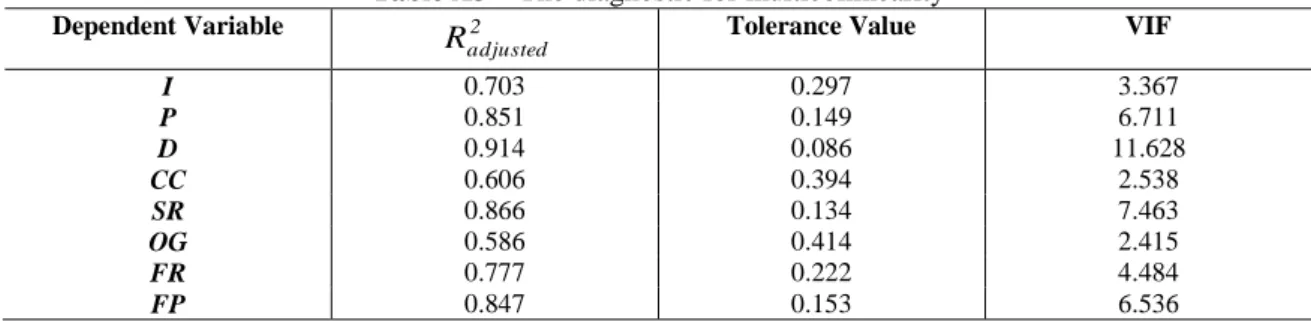
Table A1 and Table A2 in the Appendix contain descriptive statistics of the data and present the corresponding correlation matrix between variables, respectively. As preliminary evidence on the hypotheses under study, note that financial receipts and financial payments are negatively related with investment. Additionally, it should be noted that the absolute values of all correlation coefficients are lower than 0.8, which is crucial to exclude the existence of severe multicollinearity between the variables (Studenmund, 2005). The only exception for the correlation between profitability and debt, but the existence of severe multicollinearity can be rejected for all variables since the Variance Inflation Factors (VIF) for each variable is lower than less than the traditional ceiling of 10 (Table A3) - Kutner et al., 2004. Although debt is an exception to this, the respective VIF is only slightly higher than 10.
6 According to the AMECO database, the real interest rates are obtained from the difference between the
nominal interest rates and the inflation rate measured by the GDP deflator. The short-term interest rates correspond to the interest rates on 6-month deposits and the long-term interest rates correspond to the weight average of public and private bonds over five years.
_____________________________________________________________________________
DINÂMIA’CET – IUL, Centro de Estudos sobre a Mudança Socioeconómica e o Território ISCTE-IUL – Av. das Forças Armadas, 1649-026 Lisboa, PORTUGAL
Tel. 210464031 - Extensão 293100 E-mail: dinamia@iscte.pt www.dinamiacet.iscte.pt
14 4.2 METHODOLOGY
The previous papers studying the impact of financialisation on investment use
Partial Adjustment and the Autoregressive Distributed Lag Models (Stockhammer, 2004), Ordinary Least Squares (Orhangazi, 2008a), or Error Correction Models (van Treeck, 2008; and Onaranet al., 2011). We use a VAR/VECM methodology because it assumes that all variables are
endogenous, which is appropriate for the set of variables under study, and it enables us to examine the dynamic reaction of all variables to shocks. If the variables are cointegrated, we can use a VECM to distinguish the short term and long term effects of financialisation.
Our methodology involves six stages. First, we carry out unit root tests applying the conventional augmented Dickey and Fuller (1979) (ADF) test and the Phillips and Perron (1998) (PP) test. If all variables are non-stationary in levels and stationary in first differences, i.e. integrated of order one, we use the Johansen (1991 and 1995) test to ascertain whether they have cointegration relationships.
Thirdly, we estimate the model using either a Vector Autoregressive Model (VAR) if variables are stationary in levels or integrated of order one but not cointegrated; or a Vector Error Correction Model (VECM) if variables proved to be integrated of order one and
cointegrated8. A VAR model treats all variables as endogenous and as a function of the lagged
values of all variables in the system. Mathematically, a VAR model with k variables can be represented by:
(3)
, where yt is a k vector of variables, Ai is a matrix of coefficients to be estimated, p is the
number of lags, is a vector of k constants and ut is a vector of k innovations that may be
contemporaneously correlated but are uncorrelated with all of the right-hand side variables (ut
is a independent and identically distributed disturbance term - white-noise). A VECM is a restricted VAR for cointegrated non-stationary variables, which can be written as
(4)
8 Note that if variables are non-stationary but not cointegrated, we should also use VAR models by
differentiating all variables.
t p t p 1 t 1 t A y ... A y u y t i t 1 p 1 i i 1 t t y y u y
_____________________________________________________________________________
DINÂMIA’CET – IUL, Centro de Estudos sobre a Mudança Socioeconómica e o Território ISCTE-IUL – Av. das Forças Armadas, 1649-026 Lisboa, PORTUGAL
Tel. 210464031 - Extensão 293100 E-mail: dinamia@iscte.pt www.dinamiacet.iscte.pt
15 This allows the dynamic relationship between variables to be modelled using their differences
but imposes an adjustment to the long-term equilibrium. Here, and are the matrices
containing the long and short-term information, respectively, such that:
(5)
(6)
The long-term matrix can also be written as ', where measures the speed of
adjustments of the variables towards the equilibrium and is the matrix of long-term
coefficients or the cointegration matrix.
Some diagnostic tests are conducted in the fourth stage to assess the adequacy of our results. We employ the autocorrelation LM test, the Ramsey RESET test, the normality test of residuals, the heteroscedasticity test and the stability test. We also perform the cumulative sum of recursive residuals (CUSUM) and the cumulative sum of squares of recursive residuals (CUSUMSQ) tests to assess the possible existence of structural breaks.
We then run Granger (1969) causality tests, which allow us to determine whether the current value of a certain variable y can be predicted by its past values and the past values of the other variables in the VAR.
Finally, we analyse impulse response functions (IRFs) in order to determine the short and long-term effect of an isolated shock on each variable. These functions identify the short and long-term effects in the endogenous variables of an isolated shock on one of them, and complement the findings obtained with Granger causality analysis.
5. EMPIRICAL RESULTS AND DISCUSSION
We start by analysing the presence of unit roots by looking at the plots of variables (Figure A1 to Figure A8 in the Appendix), which indicate that all variables are non-stationary in levels.
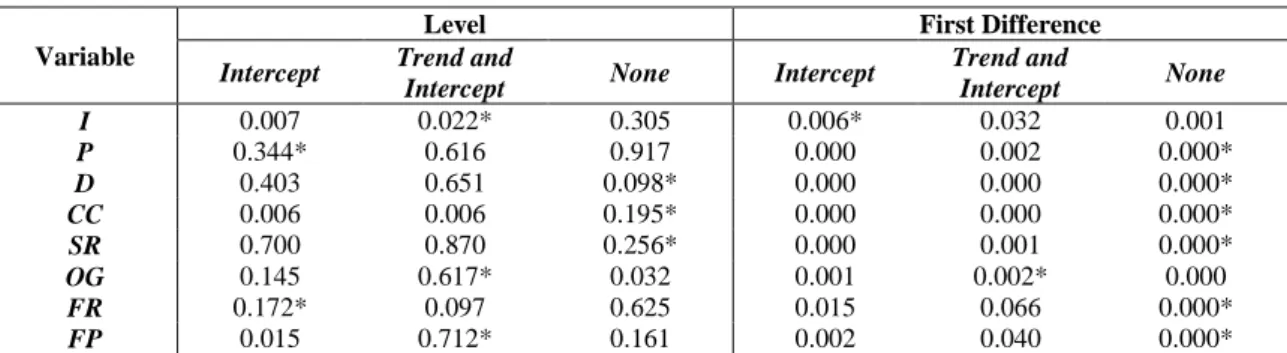
Employing the ADF and the PP tests (Table 1), 9 We conclude that for all seven variables the
null hypothesis of a unit root cannot be rejected at the traditional significance levels10. The only
exception is the cost of capital, for which the null hypothesis of non-stationarity is rejected by the PP test. However, the null hypothesis is not rejected by the ADF test, which is more suitable
9 PP test’ results are available upon request.
10 Unless otherwise stated, empirical results were obtained with Eviews software.
p 1 i i A
p 1 i j j i A _____________________________________________________________________________
DINÂMIA’CET – IUL, Centro de Estudos sobre a Mudança Socioeconómica e o Território ISCTE-IUL – Av. das Forças Armadas, 1649-026 Lisboa, PORTUGAL
Tel. 210464031 - Extensão 293100 E-mail: dinamia@iscte.pt www.dinamiacet.iscte.pt
16 than the PP test for finite samples (Davidson and MacKinnon, 1999); we therefore assume cost of capital has a unit root. We then carried out the same two types of unit root test for the first differences of the variables, and we conclude they are all stationary. Our variables are therefore non-stationary in levels but stationary in first differences, i.e. they are all integrated of order one.
Table 1 – P-values of the ADF unit root test
Variable
Level First Difference
Intercept Trend and
Intercept None Intercept
Trend and Intercept None I 0.007 0.022* 0.305 0.006* 0.032 0.001 P 0.344* 0.616 0.917 0.000 0.002 0.000* D 0.403 0.651 0.098* 0.000 0.000 0.000* CC 0.006 0.006 0.195* 0.000 0.000 0.000* SR 0.700 0.870 0.256* 0.000 0.001 0.000* OG 0.145 0.617* 0.032 0.001 0.002* 0.000 FR 0.172* 0.097 0.625 0.015 0.066 0.000* FP 0.015 0.712* 0.161 0.002 0.040 0.000*
Note: The lag lengths were selected automatically based on the AIC criteria and * indicates the exogenous variables included in the test according to the AIC criteria.
The next step is to determine the optimal lag length according to information criteria and considering an unrestricted VAR in levels. Table 2 contains the optimal number of lags suggested by each information criteria. The search was made with the number of lags varying between zero and two; the VAR does not satisfy the stability condition when there is a higher number of lags since at least one root of the characteristic polynomial is outside the unit circle
(Lütkepohl, 1991.11 Furthermore, we do not need more than two lags given that we are using
annual data. Although there is no concordance between the information criteria, we choose two lags given that FPE and AIC criteria are preferable in the case of small samples (sixty observations and below) – Liew, 2004.
Table 2 – Values of the information criteria by lag
Lag LR FPE AIC SC HQ
0 n. a. 1.3e-25 -34.6 -34.3 -34.5 1 261.1* 2.4e-28 -41.0 -37.8* -39.9* 2 77.5 2.3e-28* -41.6* -35.6 -39.6
Note: * indicates the optimal lag order selected by the respective criteria.
Then, we apply the Johansen (1991 and 1995) methodology to determine the existence of cointegration between our variables, using both the Trace and the Maximum Eigenvalue tests. This requires us to select the deterministic trend for inclusion in the cointegration equation.
_____________________________________________________________________________
DINÂMIA’CET – IUL, Centro de Estudos sobre a Mudança Socioeconómica e o Território ISCTE-IUL – Av. das Forças Armadas, 1649-026 Lisboa, PORTUGAL
Tel. 210464031 - Extensão 293100 E-mail: dinamia@iscte.pt www.dinamiacet.iscte.pt
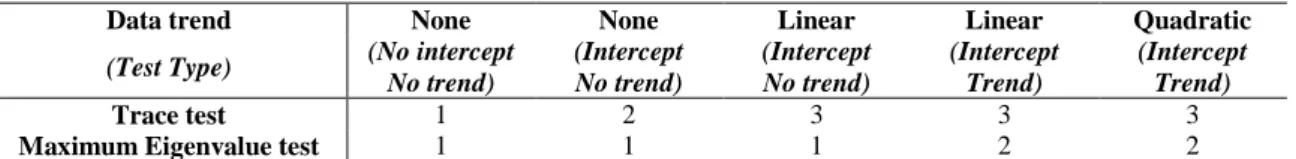
17 Thus, we conduct the Johansen test considering all five standard assumptions and make our decision based on information criteria (Table 3).
Table 3 – Number of cointegration relations by type of model specification (at 5% significance level)
Data trend None None Linear Linear Quadratic
(Test Type) (No intercept No trend) (Intercept No trend) (Intercept No trend) (Intercept Trend) (Intercept Trend) Trace test 1 2 3 3 3
Maximum Eigenvalue test 1 1 1 2 2
Note: We use only one lag to run this test, because the test is done using the first differences of the variables.
The results are contradictory not only in relation to the optimal number of lags, but also regarding the deterministic trend specification; this may be due to the small sample size (Brooks, 2009). Nonetheless, they at least suggest that our seven variables are cointegrated, irrespective of the model specification used. Indeed, the number of cointegration relations is always higher than zero and lower than the number of variables for any model specification, either by the Trace test or by the Maximum Eigenvalue test.
When determining the number of lags, the deterministic trend specification and the number of cointegration relations, the AIC criterion selects the fourth model (the level data and the cointegrating equations have linear trends) and suggests a VECM with three lags, but SC selects the second model (the level data have no deterministic trends and the cointegrating equations have intercepts) and confirms a VECM with one lag. We choose to use the SC criteria (which selects the second model) because as there is no significant trend in levels for some of our variables (Figure A1 to Figure A8 in the Appendix). Under these circumstances, the Trace test reveals three cointegration relationships, whilst the Maximum Eigenvalue test indicates only one. We consider one cointegrating vector because some authors warn that when these two tests have conflicting results for small samples, the Maximum Eigenvalue test should prevail for inferences because it is more reliable (e.g. Johansen and Juselius, 1991; Gregory, 1994; Dutta and Ahmed, 1999; among others).
Table 4 – Diagnostic tests for VECM estimations
Test F-statistic P-value
Autocorrelation test (up to one lag) 60.510 0.601
Ramsey’s RESET test 1.558 0.224
Normality test (Jarque-Bera) 27.395 0.037 Heteroscedasticity test 0.059 0.810 Stability (AR root) test n. a. Seven eigenvalues
_____________________________________________________________________________
DINÂMIA’CET – IUL, Centro de Estudos sobre a Mudança Socioeconómica e o Território ISCTE-IUL – Av. das Forças Armadas, 1649-026 Lisboa, PORTUGAL
Tel. 210464031 - Extensão 293100 E-mail: dinamia@iscte.pt www.dinamiacet.iscte.pt
18 Hence, we run a VECM considering one cointegrating vector, the second specification model, and one lag, and after conducting five usual diagnostic tests (Table 4). For the autocorrelation LM test, we cannot reject the null hypothesis of no serial correlation of residuals up to one lag, and this also holds for a higher number of lags. Regarding the Ramsey RESET test, we cannot reject the null hypothesis of no misspecification, thus confirming the adequate functional form of our model. For the normality test, we do not reject the null hypothesis that the residuals are normally distributed using a significance level of 1%, but we reject it for higher significance levels. This is not considered very serious because the central limit theorem guarantees the normality of residuals as our sample has more than thirty observations. Indeed, Hendry and Juselius (2000) recognise that the normality assumption is seldom satisfied in economic applications, which does not invalidate the global robustness of our estimations or the statistical inference. In relation to the heteroscedasticity test, we cannot reject the null hypothesis of homocedasticity. Regarding the model’s stability, we conclude that there are seven eigenvalues or unit roots, which means the estimated VECM is stable as the difference between our eight
variables and the seven eigenvalues is equal to one (Lütkpohl and Krätzig, 2004). 12 Finally, the
plots of the CUSUM and CUSUMSQ tests (Figure A9 the Appendix) suggest that our coefficients are generally stable over time and confirm the absence of significant structural breaks because the recursive residuals lie between the straight lines at 5% significance levels. In short, the estimated VECM is well specified according to the econometrics tests performed.
We choose to normalise on investment in the long term equation given our interest in estimating an investment equation. The long-term relationship is shown in Table 5 and the short-term relationship is presented in Table 7.
Table 5 – The long-term estimations of investment
Variable Pt Dt CCt SRt OGt FRt FPt β0 It 1.490*** (0.135) [-11.019] -0.442*** (0.061) [7.213] -1.066*** (0.101) [10.542] 0.528*** (0.154) [-3.432] 0.499*** (0.131) [-3.816] 1.140*** (0.206) [-5.547] -0.221*** (0.073) [3.022] -0.425*** (0.069) [6.204]
Note: Standard errors in ( ), t-statistics in [] and *** indicate statistical significance at 1% level.
In the long-term, all variables are statistically significant and all coefficients have the expected signs, with the exception of financial receipts. Surprisingly, these receipts are a positive determinant of investment in the long-term: when they increase 1 p.p., investment increases by around 1.1 p.p. This seems to demonstrate that investment in financial activities does not
_____________________________________________________________________________
DINÂMIA’CET – IUL, Centro de Estudos sobre a Mudança Socioeconómica e o Território ISCTE-IUL – Av. das Forças Armadas, 1649-026 Lisboa, PORTUGAL
Tel. 210464031 - Extensão 293100 E-mail: dinamia@iscte.pt www.dinamiacet.iscte.pt
19 significantly divert funds from real activities, excluding the hypothesis of “crowding out”. Alternatively, it could mean that returns on financial investments are used to finance real investments rather than to fund further financial activities. Nonetheless, this apparent contradiction with the literature on financialisation may be explained by the large proportion of small and medium enterprises in Portugal facing financial constraints and therefore more dependent on any income to make new investments. Simultaneously, the explanation may also lie in the small number of Portuguese corporations quoted in the stock market since they ultimately have fewer funding sources. In turn, financial payments have a negative impact on real investment: a rise of 1 p.p. in these payments decreases investment by about 0.2 p.p, which supports the above hypothesis.
Turning now to the control variables, profitability positively influences investment in the long-term: a 1 p.p. increase in profitability raises investment by about 1.5 p.p. This suggests that either profits are used to finance investment or new investment is being made in the expectation of a large profit rate. Debt negatively influences investment; a 1 p.p. rise in this variable reduces investment by around 0.4 p.p. This indicates that indebtedness could be limiting the capacity of non-financial corporations to obtain further funding, or that debt is being used to repay existing debts rather than to make investment. Also as expected, the cost of capital exerts a negative impact on real investment: a 1 p.p. increase in this cost reduces investment by about 1.1 p.p.
In contrast, the household savings rate is a positive determinant of investment: a 1 p.p. increase in the savings rate leads to a 0.5 p.p. rise in investment. Likewise, output growth positively affects firms’ investment: a 1 p.p. increase in economic activity raises investment by around 0.5 p.p., which shows that investors are more willing to invest when economic growth increases and confirms that investment is procyclical. However, this is not in line with the acceleration principle as the coefficient of output growth is less than one.
Table 6 – Error correction term estimations
Variable ∆It ∆Pt ∆Dt ∆CCt ∆SRt ∆OGt ∆FRt ∆FPt
Error Correction Term -0.287** (0.168) [1.700] 0.275* (0.168) [1.635] 0.963* (0.607) [1.586] -0.053 (0.295) [-0.180] 0.207* (0.161) [1.290] -0.118 (0.209) [-0.566] 0.041 (0.130) [0.314] 0.542* (0.401) [1.350]
Note: ∆ is the operator of the first differences, standard errors in ( ), t-statistics in [], ** indicates statistical significance at 5% level and * indicates statistical significance at 10% level.
Table 6 presents the estimates for the error correction terms, which measure the adjustment of variables to the long-term equilibrium. The most important finding is that the coefficient of investment is the only one that is statistically significant at a 5% level and exhibits a negative
_____________________________________________________________________________
DINÂMIA’CET – IUL, Centro de Estudos sobre a Mudança Socioeconómica e o Território ISCTE-IUL – Av. das Forças Armadas, 1649-026 Lisboa, PORTUGAL
Tel. 210464031 - Extensão 293100 E-mail: dinamia@iscte.pt www.dinamiacet.iscte.pt
20 value; it confirms that this variable contributes to the convergence to the long-term equilibrium and it is therefore reasonable to be the endogenous variable. The coefficient of investment indicates that 28.7% of the deviation from the long-term equilibrium in one period is automatically corrected in the next period. Moreover, using a 10% level of significance, only the error correction terms of profitability, debt, savings rate and financial payments are statistically significant. At the same time, it is interesting to note that the adjustment of profitability and savings rate to the long-term relationship helps correct a possible disequilibrium, given the positive values of their error correction terms. Furthermore, the error correction terms of cost of capital and financial receipts indicate that these two variables also contribute to the correction of disequilibrium in the long-term relationship, although they are not statistically significant.
There are only four variables which are statistically significant in explaining real investment in the short-term: lagged investment, profitability, the level of debt and savings rate. Lagged investment is a relevant determinant of the contemporaneous investment, which demonstrates the level of persistence and inertia of this macroeconomic variable. As expected, profitability and savings rate continue to have a positive influence on investment in the short-term, and debt also maintains a negative effect on investment. The remaining variables are not statistically significant but have the expected signs with the exception of financial receipts. Note that all signals of the short-term estimates are equal to the signals of the long-term estimates; this shows real investment has a similar reaction to these variables either in the long-term or short-term.
Table 7 – The short-term dynamic
Variable ∆It-1 ∆Pt-1 ∆Dt-1 ∆CCt-1 ∆SRt-1 ∆OGt-1 ∆FRt-1 ∆FPt-1
∆It 0.193* (0.137) [1.404] 0.283** (0.161) [1.751] -0.145* (0.099) [-1.456] -0.042 (0.131) [-0.317] 0.370* (0.236) [1.567] 0.068 (0.158) [0.432] 0.423 (0.347) [1.219] -0.182 (0.162) [-1.118]
Note: ∆ is the operator of the first differences, standard errors in ( ), t-statistics in [], ** indicates statistical significance at 5% level and * indicates statistical significance at 10% level.
We then conduct Granger causality tests to gauge how past changes in one variable (with all other variables constant) affect investment in the short-term. Profitability (at a 10% significance
level) is the only variable that causes investment(Table 8). For the remaining variables, the null
hypothesis of non-causality is not rejected. In light of this, we can state that the contemporaneous investment of non-financial corporations is only affected by the past values of profitability.
_____________________________________________________________________________
DINÂMIA’CET – IUL, Centro de Estudos sobre a Mudança Socioeconómica e o Território ISCTE-IUL – Av. das Forças Armadas, 1649-026 Lisboa, PORTUGAL
Tel. 210464031 - Extensão 293100 E-mail: dinamia@iscte.pt www.dinamiacet.iscte.pt
21
Table 8 – Granger causality tests
Null hypothesis Chi-square P-value
∆Pt → ∆It 3.066 0.080 ∆Dt→ ∆It 2.119 0.145 ∆CCt→ ∆It 0.100 0.751 ∆SRt→ ∆It 2.458 0.117 ∆OGt→ ∆It 0.187 0.666 ∆FRt→ ∆It 1.485 0.223 ∆FPt→ ∆It 1.249 0.264
Note: The sign “→” means that the variable on the left of the sign does not Granger cause the variable on the left, and ∆ is the operator of the first differences.
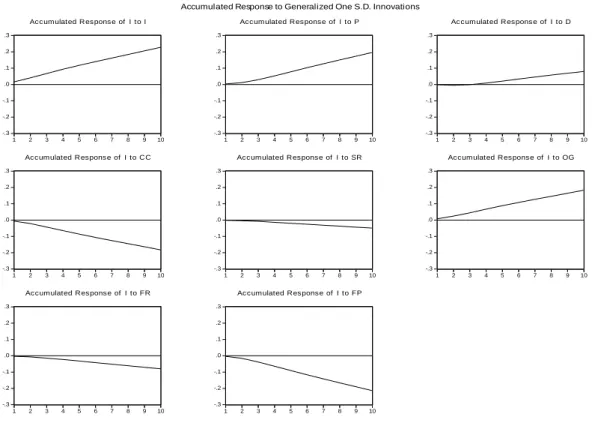
Thus far we have made a ceteris paribus analysis, but we now have to resort to impulse response functions to measure how an unanticipated shock in one variable affects dynamically investment. These functions allow all the variables to change and they simulate how the economy will react to a contemporaneous shock in one variable (with the short-term and long-term relations operating).
It is important to refer that the ordering of variables could change the profile of the IRFs (Enders, 2003; and Lütkpohl and Krätzig, 2004). Two approaches can be taken to identify the IRFs. First, we can use the generalised IRFs proposed by Koop et al. (1996) and Pesaran and Shin (1998); this does not require the ordering of variables, i.e., the choice of variables that react in the same year to shocks in other variables. The second approach is to apply a Cholesly decomposition in which variables must be ordered from the most exogenous to the most endogenous from a contemporaneous point of view. We adopt the generalised IRF in order to avoid ambiguity in the ordering of variables. This function identifies the innovation to the
th
y variable by applying a variable specific Cholesky factor computed with the yth
variable at the top of the Cholesky ordering.
Results show that investment responds negatively to a shock in financial receipts, confirming the initial hypothesis regarding this variable. This reveals that corporations do not use financial incomes to finance productive investments, but probably use them to increase their engagement with financial activities. Note that the IRFs show that a positive shock in financial receipts reduces economic growth and firms’ profitability in the long term; this explains their negative dynamic effect on investment, despite the identified positive effect of financial receipts
on the long-term and short-term investment equations13.
On the other hand, the response of investment to a shock in financial payments is relatively pronounced and negative, thus reinforcing the argument that pressures for financial payments decrease investment. Therefore, both channels of financialisation have a disruptive
_____________________________________________________________________________
DINÂMIA’CET – IUL, Centro de Estudos sobre a Mudança Socioeconómica e o Território ISCTE-IUL – Av. das Forças Armadas, 1649-026 Lisboa, PORTUGAL
Tel. 210464031 - Extensão 293100 E-mail: dinamia@iscte.pt www.dinamiacet.iscte.pt
22 effect on investment in a dynamic way, but the negative effect of the channel of financial payments is more vigorous.
The level of debt has a small positive dynamic effect on investment, probably because it allows corporations without enough equity and internal means of finance to undertake
investment. A shock in debt produces a positive effect on profitability and on output growth14,
thus leading to an increase in investment. The unanticipated changes in the remaining variables have the expected impacts on investment, with the exception of the savings rate. In fact, the response of investment to a shock in the savings rate is slightly negative in a dynamic way, which is contrary to the long-term and short-term estimates. This signals that a higher level of savings involves less consumption by households, which implies a deceleration of the economic activity and profitability that hampers new investments by non-financial corporations – this is
confirmed by the IRFs15.
Figure 1 – Generalised impulse response functions (accumulated responses to one s.d. innovations)
We now move on to check robustness. It is worth noting that the results would not have changed considerably if we had chosen the fourth model (the level data and the cointegration
14 These IRF are available upon request. 15 These IRF are available upon request.
-.3 -.2 -.1 .0 .1 .2 .3 1 2 3 4 5 6 7 8 9 10 Accumulated R esponse of I to I -.3 -.2 -.1 .0 .1 .2 .3 1 2 3 4 5 6 7 8 9 10 Accumulated R esponse of I to P -.3 -.2 -.1 .0 .1 .2 .3 1 2 3 4 5 6 7 8 9 10 Accumulated R esponse of I to D -.3 -.2 -.1 .0 .1 .2 .3 1 2 3 4 5 6 7 8 9 10 Accumulated Response of I to CC -.3 -.2 -.1 .0 .1 .2 .3 1 2 3 4 5 6 7 8 9 10 Accumulated Response of I to SR -.3 -.2 -.1 .0 .1 .2 .3 1 2 3 4 5 6 7 8 9 10 Accumulated Response of I to OG -.3 -.2 -.1 .0 .1 .2 .3 1 2 3 4 5 6 7 8 9 10 Accumulated Response of I to FR -.3 -.2 -.1 .0 .1 .2 .3 1 2 3 4 5 6 7 8 9 10 Accumulated R esponse of I to FP