Investment in the Brazilian economy during the crisis
ROBERTO MEURER*
In this short article, it is analyzed as to whether inancial lows and credit con-cessions explain the behavior of investment in the Brazilian economy during the 2008 crisis. Beyond the importance of demand, changes in expectations seem to be an important source of instability in investment and, as a consequence, in the economy.
Keywords: foreign portfolio investment; investment, expectations; 2008 crisis. JEL Classiication: E22; E27; F32.
Despite the initial thoughts that the financial crisis of 2008 could show a de-coupling of emerging markets from the crisis hitting developed economies, it soon became evident that this would not happen. In this short article, the primary origins of the crisis will not be assessed, but it is worth noting the theoretical explanations based on regulation failure, the credit crunch after the housing bubble due to lax monetary policy, and transformations in the financial system (Bresser-Pereira, 2010; Brunnermeier, 2009; Crotty, 2009). These structural factors’ transmission channels led to less output.
According to Keynes (1936), the dynamics of the economy is given by invest-ment, as consumption is more stable. Expectations play a major role in the behav-ior of investment. Investment is difficult to forecast, and the instability of the economy derives from the uncertainty on expected returns. In this sense, there is a similarity between financial variables and investment, both reacting fast to chang-es in the economic environment and expectations, unlike consumption. It is impor-tant to highlight that Keynes portrays differences between entrepreneurs and pro-fessional investors, as behavior on expectations is different between the two groups.
Brazilian Journal of Political Economy, vol 32, nº 2 (127), pp 205-212, April-June/2012
Since it is difficult to measure expectations, financial flows can be seen as a proxy variable for the expectations, which include risk aversion changes. Foreign portfolio investment can account for expectations in the world economy, whereas credit concessions may reflect the state of expectations in the domestic financial system. It is not only expected returns but also the uncertainty about these returns that influences flows.
Given the strong fall in investment in the Brazilian economy during the 2008 crisis, this short article tests the relation between investment and real and financial variables, namely Gross Domestic Product (GDP), foreign portfolio investment, interest rate, and credit concession by the financial system. As shown in Figure 1, investment fell by 9.7% in the last quarter of 2008 and by another 12% in the first quarter of 2009. The investment level of the third quarter of 2008 was reached again only in the first quarter of 2010. The GDP suffered a drop of 3.2% in the last quarter of 2008 and another 1.6% in the first quarter of 2009.
Anecdotal evidence from the time of the crisis puts a strong weight for the fall in demand, and in output as a consequence, on a credit crunch, especially from the private banking system. Total credit concession in the financial system fell by 13.4% percent between the third quarter of 2008 and the first quarter of 2009. Recovery of credit concession began in the second quarter of 2009, and reached pre-crisis level by middle of 2010 (Figure 1). Since public and private credit does not react the same way to changes in expectations, using the aggregate value does not capture the whole impact of expectations. On the other hand, it allows taking into account the coun-tercyclical behavior of the public banking system1. In the case of Foreign Portfolio
Investment (FPI), the outflows and reversal to inflows are also observable. For inter-est rates, the crisis meant a strong fall in real rates from the beginning of 2009.
Figure 1: Variables of interest – 2000Q3 to 2010Q2
80 100 120 140 160 180
01 02 03 04 05 06 07 08 09
120 130 140 150 160
01 02 03 04 05 06 07 08 09
-8 -4 0 4 8 12 16 20
01 02 03 04 05 06 07 08 09
-5 0 5 10 15 20
01 02 03 04 05 06 07 08 09
100 120 140 160 180
01 02 03 04 05 06 07 08 09 INVESTMENT
(1995 =100)
GROSS DOMESTIC PRODUCT (1995 = 100)
FOREIGN PORTFOLIO INVESTMENT (bilions of dollar)
CREDIT CONCESSIONS (bilions of reais) REAL INTEREST RATE
(%)
The fall in investment and output at the end of 2008 and beginning of 2009 was too fast to be explained by the working of the restrictive monetary policy that was in course at the time. This means that expectations must have strongly changed, reacting to uncertainty in the world economy and also affecting Brazilian investors and the financial system. To test this hypothesis, Granger causality tests and regres-sion analysis will be employed, using quarterly data from 2000Q3 to 2010Q2. The model to be estimated is theoretically and empirically in line with Oreiro, Naka-bashi and Souza (2010), which emphasizes the role of demand for growth and in-vestment.
The series for gross fixed capital formation (INV) and GDP are seasonally adjusted series obtained from Ipeadata, expressed in index number equaling the average of 1995 to 100. The real interest rate (R) is the real ex post quarterly aver-age of the monthly SELIC interest rate using IPCA as the inflation rate, expressed in percentage per annum, calculated from data of the Brazilian Central Bank. Cred-it concessions in the financial system (CRCO) are the quarterly average of month-ly concessions, expressed in billions of reais of June 2010, employing the IPCA as inflation rate, also obtained from the Brazilian Central Bank. Foreign portfolio investment traded in the country (FPI) is the quarterly flow expressed in billions of dollars, as published by the Brazilian Central Bank, transformed to constant values of the second quarter of 2010, using the U.S. consumer price index (CPI) as infla-tion rate. The FPI is the sum of net foreign portfolio investment in equity and fixed income traded in the country. The advantage of using flows due to securities trad-ed in the country is that they include secondary market transactions, whereas the flows traded outside the country are mainly primary market operations. Since there is freedom to buy or withdraw securities in the country without relying on decisions of the issuer of the securities, the flows related to trade in the country are more capable of capturing changes in expectations by foreign decision makers. Foreign portfolio investment in equity and fixed income does not behave in exactly the same way, but it was chosen to work with the aggregate value instead of keeping them separated in order to get a single measure of market sentiment. This is also conve-nient, because the relative participation of each flow changed over time. Fixed in-come flows are more important since 2006, due to a change in inin-come tax on foreign investors. The INV and GDP series are seasonally adjusted by IBGE, which calculates Brazilian national accounts. From the other series, CRCO was the only one to show the presence of seasonality, which was removed through the Census Arima X12 software. INV, GDP, FPI, and CRCO are employed in natural loga-rithms, indicated by the L in the name of the variables LINV, LGDP, LFPI, and LCRCO. In order to get positive values in all periods and use logarithms, the arbi-trary value of 15 was added to the original FPI series.
invest-ment (results not shown but available on request). These results mean that it is necessary to work with the first differences of LINV, LGDP, and LCRCO, respec-tively, DLINV, DLGDP, and DLCRCO, in order to avoid spurious results in the regressions.
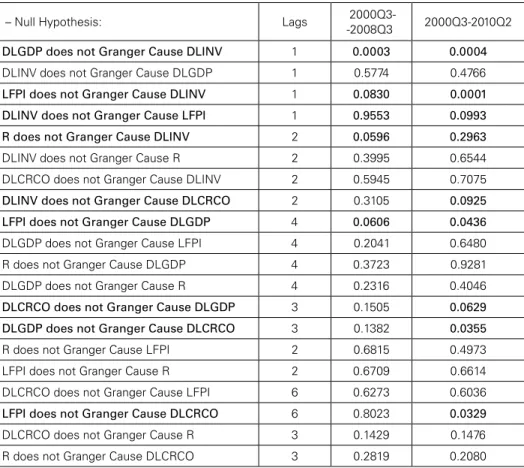
Table 1 shows the results of Granger causality tests. Results significant at the 10% level are highlighted in bold. The rejection of the null hypothesis of no causal-ity means that the explanatory variable helps explain the behavior of the explained variable. Causality, in this sense, means precedence in time. The tests were carried out for the subsample 2000Q3-2008Q3 and the whole sample 2000Q3-2010Q2 in order to detect changes in the relationships between the variables due to the crisis. The maximum lag tested was for six quarters, coherent with the maximum lagged effect of the monetary policy on output and inflation according to the Bra-zilian Central Bank (Banco Central do Brasil, 2009). The optimal lag was chosen as the longest of Schwarz, Akaike, and HQ optimal lag criteria and the Wald test for lag exclusion.
The importance of demand, detected in Oreiro, Nakabashi and Souza (2010) is confirmed by DLGDP preceding DLINV, but not the other way around. There is evidence of the role of expectations, as LFPI anticipates the behavior of DLINV in the pre-crisis subsample and the whole sample. This role seems to be even stronger when the crisis period is included in the sample, when DLINV also anticipates LFPI. This means that when investment fell at the beginning of the crisis, then the financial outflows began even before the crisis, but after the crisis investment rein-forced the FPI inflows. A main role for expectations can be seen as the link between interest rates and investment vanishes when the whole sample is considered. Up to the crisis, there is no causality between DLINV and DLCRCO, but for the whole sample, DLINV anticipates DLCRCO. This result could mean that investment not only reacts even faster than credit concessions when the crisis period is considered, but it also is influenced by the reaction of credit concessions since the beginning of 2009, mainly via the public banks system, which allowed for a faster recovery of investments. The relevance of the financial system is highlighted by the relation between DLGDP and DLCRCO, significant when the crisis period is included in the sample, but not before. Influence of expectations also appears in the fact that LFPI anticipates the behavior of DLGDP before and after the crisis. The expecta-tions that influence foreign investors as well as the local financial system seem to turn more coordinated with the crisis, thus turning significant the anticipation of DLCRCO by LFPI2.
2 The Granger causality tests were also carried out with the FPI flows disaggregated in equity and fixed
Table 1: Granger Causality Tests–Probabilities of the F-test of rejecting the null hypothesis
– Null hypothesis: Lags
2000Q3--2008Q3 2000Q3-2010Q2
DLGDP does not Granger Cause DLINV 1 0.0003 0.0004
DLiNV does not Granger Cause DLGDP 1 0.5774 0.4766
LFPI does not Granger Cause DLINV 1 0.0830 0.0001 DLINV does not Granger Cause LFPI 1 0.9553 0.0993 R does not Granger Cause DLINV 2 0.0596 0.2963
DLiNV does not Granger Cause R 2 0.3995 0.6544 DLCRCo does not Granger Cause DLiNV 2 0.5945 0.7075
DLINV does not Granger Cause DLCRCO 2 0.3105 0.0925 LFPI does not Granger Cause DLGDP 4 0.0606 0.0436
DLGDP does not Granger Cause LFPi 4 0.2041 0.6480 R does not Granger Cause DLGDP 4 0.3723 0.9281 DLGDP does not Granger Cause R 4 0.2316 0.4046
DLCRCO does not Granger Cause DLGDP 3 0.1505 0.0629 DLGDP does not Granger Cause DLCRCO 3 0.1382 0.0355
R does not Granger Cause LFPi 2 0.6815 0.4973 LFPi does not Granger Cause R 2 0.6709 0.6614 DLCRCo does not Granger Cause LFPi 6 0.6273 0.6036
LFPI does not Granger Cause DLCRCO 6 0.8023 0.0329
DLCRCo does not Granger Cause R 3 0.1429 0.1476 R does not Granger Cause DLCRCo 3 0.2819 0.2080
Note: optimal lag chosen according to the longest lag between Schwartz, Akaike, and hannan-Quinn criteria and Wald lag exclusion test.
conces-sions have a strong positive relation with investment in both specifications. In this case, it can be seen that expectations which influence the financial institutions also influence investment. This channel does not show relevant changes between the two samples. This helps explain the fall in investment when financial institutions withdraw from credit concessions. On the other hand, the effort of the Brazilian government to keep the credit market working by stimulating credit from official banks was correct, and it eased the investment downturn according to these results.
Table 2: Regression results – Dependent variable: DLiNV
2001Q4-2008Q3
Coeficient (t-stat)
2001Q4-2010Q2
Coeficient (t-stat)
CoNSTANT -0.1811 (-3.56)
-0.2103 (-3,68)
DLGDP(-1) 0.9988 (1.95)
1.3736 (3.04)
DLGDP(-4) -0.8716
(-2.38)
LFPi 0.0378
(3.27)
LFPi(-1) 0.0599
(4.05)
LFPi(-2) -0.0572
(-3.92)
LFPi(-3) 0.0613 (3.50)
LFPi(-4) 0.0356
(2.76)
R(-2) 0.0022
(2.72)
0.0019 (2.21)
R(-3) -0.0013
(-1.71)
-0.0026 (-3.30)
DLCRCo 0.6382
(3,67)
0.5102 (3.00)
DLCRCo(-2) 0.3525
(2.16)
DLCRCo(-3) -0.6052 (-4.07)
-0.5024 (-3.59)
DLCRCo(-4) 0.3136 (2.09)
0.2737 (1.99)
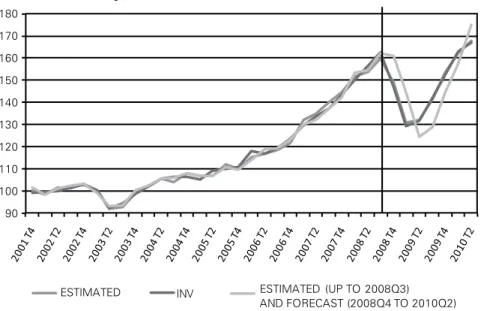
Regression results show the important role played by expectations with regard to investment, which remained in place during the crisis, and helps explain the downturn and recovery of the Brazilian economy. Observed and estimated values for investment based on the regression results of Table 2, along with out-of-sample forecasts based on the 2001Q4-2008Q3 results, are shown in Figure 2. The out-of-sample forecasts were calculated with the observed explanatory variables. The forecasted values were transformed back to the original index. As expected, the disruption in the economy caused by the crisis led to poor out-of-sample forecasts, but the in-sample fit was very good. The MAPE (mean absolute percentage error) for the out-of-sample forecast is 7.1%, whereas for the same period, it is only 0.7% based on the whole sample estimation. This means that the poor forecasts are due to big changes in the value of the explanatory variables, which are taken into ac-count for the whole sample estimation. The high level of uncertainty about the future of the Brazilian economy, reflected in portfolio investment and credit conces-sions, is in line with the expectations that also affect entrepreneurial investment and helps explain the good fit of the estimated model even when the crisis and recovery period is included in the estimation sample.
Figure 2: Observed and estimated values of Investment
90 100 110 120 130 140 150 160 170 180
ESTIMATED INV ESTIMATED (UP TO 2008Q3)
AND FORECAST (2008Q4 TO 2010Q2)
2009, similar to the expectations that explain investment. Monetary and credit policies were important to the recovery of the Brazilian economy.
REFERENCES
ARAUJO, Victor Leonardo; CINTRA, Marcos Antonio Macedo (2011). “O papel dos bancos públicos federais na economia brasileira”. IPEA, Texto para discussão 1604.
BANCO CENTRAL DO BRASIL (2009). “A defasagem da transmissão da política monetária para preços”. In: Relatório de Inlação, 11(2): 125-128.
BRESSER-PEREIRA, Luiz Carlos (2010). “The 2008 inancial crisis and neoclassical economics. Revis-ta de Economia Política, 30(1): 3-26.
BRUNNERMEIER, Markus K. (2009).” Deciphering the liquidity and credit crunch 2007-2008”. Jour-nal of Economic Perspectives, 23(1): 77-100.
CROTTy, James. (2009). “Structural causes of the global inancial crisis: a critical assessment of the ‘new inancial architecture’”. Cambridge Journal of Economics, 33(4): 563-580.
KEyNES, John Maynard (1936 [1991]). The General Theory of Employment, Interest and Money. New york, Harcourt Brace.