José Ricardo Mantovani1, José Antônio Lima2, Ciro Pozzi Garcia3, Tiago Teruel Rezende4 (Received: August 07, 2019; accepted: September 09, 2019)
ABSTRACT: In soil sampling, the collection site and the tool used may induce errors that can compromise the results of the chemical analysis and, consequently, the definition of corrective and fertilizer doses. The objective in this study was to evaluate soil sampling sites and tools in a coffee growing area. The experiment was carried out in a field in the municipality of Alfenas-MG, in a 35-year coffee field. A randomized block design was used in a 3 x 5 factorial scheme and 4 replications, totaling 60 experimental units. The treatments consisted of 3 sampling sites: in the fertilizer strip (located in the projection of the plant canopy); between rows; and in the total area, with 1/3 of the samples collected under the canopy and close to the plant stem, 1/3 in the canopy projection and 1/3 collected between rows; and 5 sampling tools: Dutch auger; screw auger; probe; hoe and drill. Soil samples were collected at a depth of 0 to 0.2 m, and each composite sample was obtained by assembling and mixing 20 single samples. At each sampling point, an area of 2m2 was delimited, in which simple samples were collected in all the evaluated places and with all the tools used. The following parameters were determined in the soil samples: pH in CaCl2; potential acidity (H+Al); organic matter; P, extracted by Mehlich; K+, Ca2+, Mg2+ and base saturation. In a coffee-growing area, the fertilizer strip (canopy projection) has topsoil with higher acidity and lower contents of organic matter and nutrients P, K+, Ca2+ and Mg2+ than between rows. The tools used for soil sampling do not influence the results of soil chemical analysis in the coffee-growing area.
Index terms: Coffea arabica L., soil analysis, nutrient, auger.
LOCAIS E FERRAMENTAS DE AMOSTRAGEM NA AVALIAÇÃO DA FERTILIDADE DO SOLO EM CAFEEIRO EM PRODUÇÃO
RESUMO: Na amostragem de solo o local de coleta e a ferramenta utilizada podem induzir a erros, que podem comprometer os resultados da análise química, e consequentemente a definição das doses de corretivos e fertilizantes. Objetivou-se avaliar locais e ferramentas de amostragem de solo, em área de cafeeiro em produção. O experimento foi conduzido a campo, no município de Alfenas-MG, em talhão de cafeeiro com 35 anos de idade. Foi empregado delineamento em blocos ao acaso, em esquema fatorial 3 x 5 e 4 repetições, totalizando 60 unidades experimentais. Os tratamentos foram constituídos por 3 locais de amostragem: na faixa de adubação, localizada na projeção da copa das plantas; na entrelinha; e, em área total, com 1/3 das amostras coletadas sob a copa e próxima ao caule das plantas, 1/3 na projeção da copa e 1/3 coletadas na entrelinha; e 5 ferramentas de amostragem: trado holandês; trado de rosca; sonda; enxadão e furadeira com rosca helicoidal. As amostras de solo foram coletadas na profundidade de 0 a 0,2 m, e cada amostra composta foi obtida pela reunião e mistura de 20 amostras simples. Em cada ponto amostral foi delimitado uma área de 2m2, em que foram coletadas amostras simples em todos os locais avaliados e com todas as ferramentas empregadas. Nas amostras de solo foram determinados pH em CaCl2; acidez potencial (H+Al); matéria orgânica; P, extraído por Mehlich; K+, Ca2+, Mg2+ e saturação por bases. Em cafeeiro em produção, a faixa de adubação (projeção da copa) possui a camada superficial do solo com acidez mais elevada e com menores teores de matéria orgânica e nutrientes P, K+, Ca2+ e Mg2+ do que a entrelinha. As ferramentas utilizadas para amostragem de solo não influenciam os resultados da análise química do solo, em área de cafeeiro em produção.
Termos para indexação: Coffea arabica L., análise de solo, nutriente, trado.
1 INTRODUCTION
In the evaluation of soil fertility, sampling is an extremely important step and very subject to errors (ROZANE et al., 2011; HERNANDES et al., 2011; SANTOS et al., 2013). The results of soil analysis and, consequently, the definition of corrective and fertilizer doses to be applied in an area, depend on the procedures adopted and the tools used in soil sampling (ACQUA et al., 2013).
For soil sampling to be performed correctly, some factors must be considered such as the number of simple samples to be collected, the
1,2,3,4Universidade José do Rosário Vellano/Unifenas - Faculdade de Agronomia - Cx. P. 23 - 37.130-000 - Alfenas - MG - [email protected], [email protected], [email protected], [email protected]
location of sample collection, the tool used and the sampling depth (GUARÇONI et al., 2007; SANTOS et al., 2009; ROSOLEM et al., 2010).
In Brazil, the most widely used soil sampling tools are the screw auger, Dutch auger, probe and shovel (ACQUA et al., 2013). However, easy-to-handle augers make operation easier and faster, and allow the same amount of soil to be collected at all points, besides sample removal at the same depth (ROSOLEM et al., 2010).
One tool that is currently being used very frequently in soil sampling in coffee areas is the drill, as it increases yield and facilitates on
Soil samples were collected in September, five days after a 20 mm rainfall, at a depth of 0 to 0.2 m, covering the zigzag field area. Each composite sample was obtained by assembling and mixing 20 individual samples in a clean and properly identified bucket. The simple samples were collected at twenty replication sampling points and at eighty experimentally defined points in the experimental area. An area of 2m2 was delimited at each sampling point, where simple samples were collected at all evaluated locations and with all the tools used.
After obtaining the composite samples of each tool, they were weighed on a precision balance, and a subsample of about 300 cm3 of each composite sample was obtained. In the laboratory, the subsamples were air-dried and shaded, untied, passed through a 2-mm mesh screen, homogenized and subjected to chemical analysis to determine pH in CaCl2; potential acidity (H+Al); organic matter; P, extracted by Mehlich; K+, Ca2+, Mg2+ and base saturation (V%), according to Silva (2009).
The results were submitted to analysis of variance and Tukey test for comparison of means (p < 0.05), using the AgroEstat statistical software (BARBOSA; MALDONADO JÚNIOR, 2015).
3 RESULTS AND DISCUSSION
There was no interaction of the studied factors (sites and soil sampling tools) in the evaluated parameters (p > 0.05), which indicates that the factors acted independently.
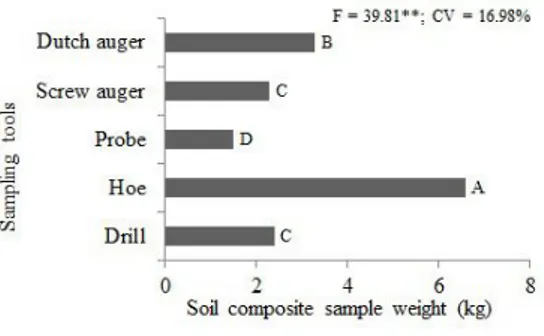
There was a difference in the soil mass of composite samples as a function of the tool used for sampling (Figure 1). It was found that the largest amounts of soil were collected by the hoe, followed by the Dutch auger. The screw auger and the drill collected similar amounts of soil, and smaller than the hoe and the Dutch auger. The probe was the tool that yielded the lowest soil mass of the composite sample.
In the coffee crop, there are several studies related to soil sampling in precision agriculture (OLIVEIRA et al., 2008; BURAK et al., 2012; FERRAZ et al., 2015). However, for traditional sampling, still widely used by small and medium farmers, there are few studies that evaluate soil sampling methods, especially for coffee.
Given the above, this study aimed to evaluate soil sampling sites and tools in a coffee-growing area.
2 MATERIAL AND METHODS
The experiment was carried out in a commercial coffee plantation, located in Alfenas-MG, in a 4.61 ha of coffee (Coffea arabica L.) ‘Mundo Novo’, 35 years old, spaced 3.8 x 0.7 m, and the crop is rainfed. The soil of the site is classified as Red Latosol distrophic cleyey texture (EMBRAPA, 2018), with 465 g kg-1 sand, 115 g kg-1 silt and 420 g kg-1 clay in the 0-0.2m layer, and the property uses high technology management.
In the area the liming and last fertilization were applied, respectively, 12 and 6 months before the execution of the experiment. The fertilization was performed according to CFSEMG (1999), in the projection of the plant canopy, and was applied 340 kg N ha-1 and 120 kg K
2O ha-1, split in three times, and the fertilizer sources used were the formula 30-0-20 and urea. It was also applied 12 t ha-1 of coffee husk, in the projection of the plant canopy, 10 months before the soil samples collection of the experiment.
The experimental design was in randomized blocks in a 3 x 5 factorial scheme (3 sampling sites and 5 collection tools) with 4 replicates, totaling 60 experimental units. The treatments consisted of 3 sampling points: in the fertilization range (located in the coffee line), in the projection of the plant canopy; between lines; and in the total area, with 1/3 of the samples collected under the canopy and near the plant stem, 1/3 in the canopy projection and 1/3 collected between rows; and 5 sampling tools: Dutch auger; screw auger; probe; hoe and drill.
The amount of soil collected by the probe, on average 1.5 kg per composite sample, was 4.4 and 2.2 times lower than that obtained by the hoe and the Dutch auger, respectively, but was not limiting for soil sampling. Raij et al. (1997) mentioned that the composite soil sample to be sent to the laboratory for chemical analysis should be about 0.3 kg.
Rosolem et al. (2010), in an experiment using different soil sampling tools in fifteen areas with different soils and management, also found that the amount of soil collected varied with the tool used for sampling. According to the authors, the largest amount of soil was collected with the shovel, and the smallest was obtained with the probe and screw auger. The cup and Dutch augers made it possible to collect larger amounts of soil compared to the probe and screw auger.
The amount of soil collected at each sampling point is an important step in soil fertility assessment procedures (ROSOLEM et al., 2010). For these authors, some tools may be unsuitable for sampling due to the small amount of soil collected or, to circumvent this problem, it may be necessary to increase the number of simple samples to form the composite sample. However, it is also a disadvantage to use tools that allow the collection of large amounts of soil at each time in this case, there is an increase in the volume of soil to be discarded, which can be a source of sampling error.
Guarçoni et al. (2007) found, in both no-till and conventional tillage areas, that the increase in soil volume of single samples, for the same collection depth, decreased the variability of fertility attributes. Thus, the authors recommended the use of augers with a diameter of approximately 5.4 cm to collect soil samples.
** Significant by the F test (p <0.01). Same letters do not differ by the Tukey test, at 5% de probability. FIGURE 1 -Mean mass of soil composite sample, in kg, as a function of the sampling tools used.
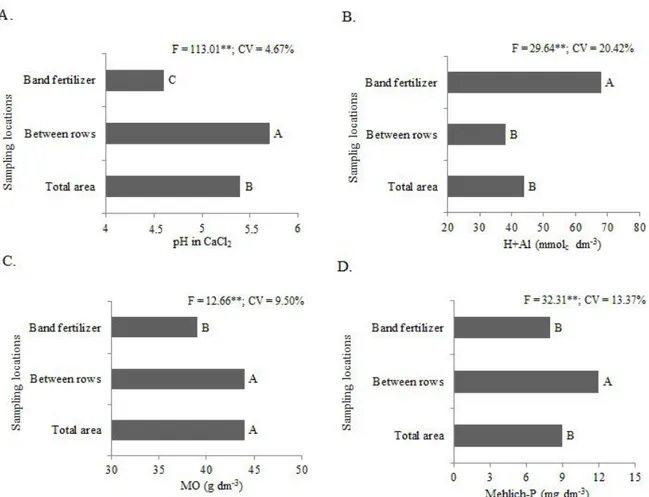
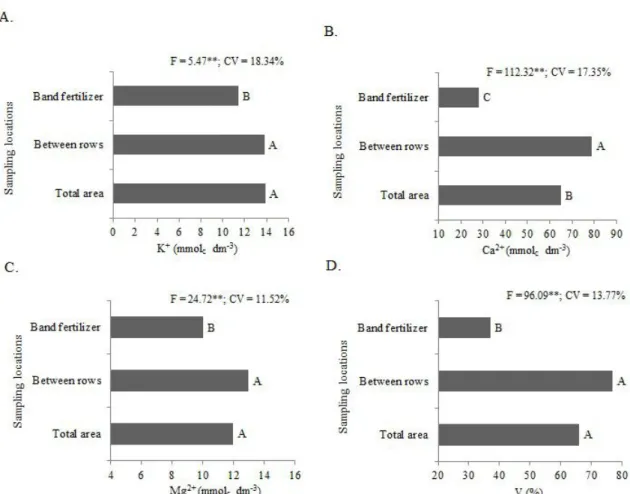
There were significant differences (p<0.05) in soil chemical attributes, considering the sampling sites evaluated (Figures 2 and 3). It was found that the best soil fertility condition occurred in the coffee row, while in the fertilizer strip (canopy projection), the worst results were obtained in relation to the chemical attributes of the soil. Potential acidity and contents of organic matter, K+ and Mg2+ of soil samples collected in the total area were similar (p>0.05) to those obtained between rows.
Between coffee rows, the values of pH, organic matter, P, K+, Ca2+, Mg2+ and base saturation (V) were, respectively, 24; 13; 21; 182; 30 and 108% higher than those obtained in the fertilizer strip. Thus, a variation in the interpretation classes of soil fertility was found, which would lead to changes in the definition of the quantities of acidity correctives and fertilizers, depending on the sampling site. Between coffee rows, acidity can be classified as low and the other values correspond to good, good, very good, very good, good and good, respectively. In contrast, in the fertilizer strip, acidity was high and the other values are equivalent to medium, medium, very good, good, good and low, respectively, considering the classes presented by Raij et al. (1997) for pH, and by CFSEMG (1999) for the other chemical attributes mentioned.
The high K contents in the three sampling sites (fertilizer strip, row and total area) is possibly due to the application of coffee husk even pruning remains in the experimental area. The coffee husk is an organic waste generated in large quantities in coffee processing, which has a high concentration of K+ and rapid nutrient release (MANTOVANI et al., 2018). In addition, in coffee plantations, high levels of K in the soil are frequent due to high nutrient application, without taking into account soil analysis results and pending charge (FIGUEIREDO et al., 2013).
** Significant by the F test (p <0.01). Same letters do not differ by the Tukey test, at 5% de probability.
FIGURE 2 - pH values in CaCl2 (A), potential acidity (H+Al) (B), and contents of organic matter (MO) (C), and P- Mehlich (D) of the soil, at a depth of 0-0.2m, in a coffee-growing area, as a function of sampling site.
In the fertilizer strip, the potential soil acidity was 79% higher than between rows (Figure 2B). The higher soil acidity in the fertilizer strip, where lower pH values and higher H+Al values were obtained in relation to between rows, can be explained by the localized application of nitrogen fertilizers, which has the characteristic of soil acidification, due to the nitrification process, in which bacteria oxidize NH4+ to NO
3- and H + ions are generated (DELBEM et al., 2011; ROSADO et al., 2014). Consideration should also be given to higher soil acidification in the fertilizer strip, as a result of the action of plant roots that absorb Ca2+ e Mg2+ and exudate H+, as well as the application of organic fertilizers and the accumulation of plant residues (NATALE et al., 2012). Similar results were obtained by Natale et al. (2007) in a guava orchard, and by Natale et al. (2008) in a star fruit crop, who also found greater soil acidification in the fertilizer strip than between rows.
The worst soil fertility condition in the fertilizer strip in relation to the coffee row can be explained by the practice of sweeping, carried out over the years in the experimental area, before coffee harvest. This practice consists in the removal of plant residues and, consequently, of the superficial layer of the soil, which is around the plants concentrating them between rows, with the objective of facilitating the sweeping of coffee fruits that fall with harvest, to increase harvest yield and remove fallen coffee with less impurities. According to Raij et al. (1996), sweeping provides greater accumulation of bases in the soil between coffee rows.
Similar results were obtained by Maluf et al. (2015) and by Flori and Resende (2016). Maluf et al. (2015) found in the coffee area, both at 0-0.1m and 0.1-0.2m soil layers, higher values of pH, organic matter, Ca2+, Mg2+ and row saturation than in the transplant line, in the fertilizer strip.
Flori and Resende (2016) obtained, at 0-0.2m soil layer, higher levels of organic matter, P and Ca2+ between rows in relation to the banana plantation row. According to these authors, these results were due to the lower nutrient absorption by the banana between rows, due to the smaller root volume at the site and the greater distance from the rhizome.
Given the results, it is found that the practice of sweeping provides that the layer of 0-0.2 m of soil next to coffee plants has lower nutrient contents than between rows, which can lead to lower nutrient utilization by plants, as a function of the root system distribution in the crop. Covre et al. (2015) found, in a 5.5-year non-irrigated coffee tree, higher concentrations of roots up to approximately 70 cm away from the stem. The authors found that the coffee tree surface area and root volume were up to 4 times larger near the stem, up to 50 cm apart, than 1.5 m away from the stem towards the rows.
** Significant by the F test (p <0.01). Same letters do not differ by the Tukey test, at 5% de probability.
FIGURE 3 - Contents of K+ (A), Ca2+ (B), Mg2+ (C), and base saturation (D) of the soil, at a depth of 0-0.2m, in a coffee-growing area, as a function of sampling site.
It was found that soil sampling in the total area, with samples collected near the stem, in the canopy projection and between the rows provided, in general, intermediate results in relation to those obtained with sampling carried out in other locations. Thus, total area sampling possibly better reflected the soil fertility conditions of the area. However, as soil acidification was higher in the fertilizer strip (canopy projection), it is recommended that soil sampling continue to be performed at this location, as it would be impossible for the farmer to perform total area sampling to assess the need for fertilization, and in the fertilizer strip to verify the need for soil acidity correction.
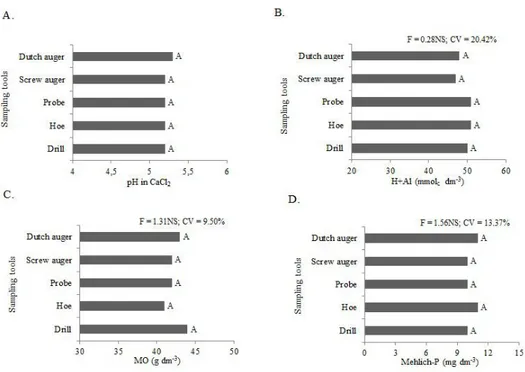
There were no significant changes (p>0.05) in the values of soil chemical attributes with the use of different sampling tools (Figures 4 and 5). This shows that the results of soil analysis do not depend on the tool used for sampling.
NS - Not significant by the F test (p >0.05). Same letters do not differ by the Tukey test, at 5% de probability. FIGURE 4 - pH values in CaCl2 (A), potential acidity (H+Al) (B), and contents of organic matter (MO) (C), and P- Mehlich (D) of the soil, at a depth of 0-0.2m, in a coffee-growing area, as a function of sampling tools.
NS - Not significant by the F test (p >0.05). Same letters do not differ by the Tukey test, at 5% de probability. FIGURE 5 - Contents of K+ (A), Ca2+ (B), Mg2+ (C), and base saturation (D) of the soil, at a depth of 0-0.2m, in a coffee-growing area, as a function of sampling tools.
Oliveira et al. (2007) verified in both no-tillage and conventional no-tillage areas that the type of tool used in soil sampling, shovel or auger, did not change the results of most of the chemical attributes evaluated (pH, organic matter, P, K+ and Ca2+). Rosolem et al. (2010) evaluated six soil sampling tools, five types of auger and the shovel, and found that the tools used yielded equivalent results for pH, potential acidity, organic matter, available P and Al3+. However, for the soil bases (K+, Ca2+ and Mg2+), the results were different most of the times, with the use of augers in relation to the shovel. Acqua et al. (2013) found, in a no-tillage area, that the sampling tools influenced the soil analysis results, and the values of the chemical attributes evaluated were higher with the electric drill than with the Dutch auger. The authors attributed these results to the volume of soil collected by each tool since in the no-tillage system, the variability of soil chemical attributes, both horizontally and vertically, is much higher than in conventional tillage.
The ease of performing soil sampling obtained with the drill coupled with the information that the results of the chemical attributes of the soil have not changed due to the tools used, justify the use of the drill in soil sampling for fertility evaluation, in coffee plantations.
4 CONCLUSIONS
In growing coffee, the fertilizer strip (canopy projection) has topsoil with higher acidity and lower contents of organic matter and nutrients P, K, Ca and Mg than between rows.
The tools used for soil sampling do not influence the results of soil chemical analysis in a coffee-growing area.
5 ACKNOWLEDGEMENTS
The authors would like to thank Fundação de Amparo à Pesquisa de Minas Gerais (Fapemig), for the undergraduate research grant for the second author; Coordenação de Aperfeiçoamento de Pessoal de Nível Superior (CAPES), for the doctoral grant for the third author.
6 REFERENCES
ACQUA, N.H.D. et al. Métodos de amostragem de solos em áreas sob plantio direto no sudoeste goiano. Revista Brasileira de Engenharia Agrícola e Ambiental, Campina Grande, v. 17, n. 2, p. 117-122, 2013.
BARBOSA, J. C.; MALDONADO JÚNIOR, W. Experimentação agronômica e AgroEstat: sistema para análises estatísticas de ensaios agronômicos. Jaboticabal: Multipress, 2015. 396p.
BURAK, D.L.; PASSOS, R.R.; ANDRADE, F.V. Variabilidade espacial de atributos químicos do solo sob cafeeiro conilon: relação com textura, matéria orgânica e relevo. Bragantia, Campinas, v. 71, p. 538-547, 2012.
COMISSÃO DE FERTILIDADE DO SOLO DO ESTADO DE MINAS GERAIS – CFSEMG. Recomendações para o uso de corretivos e fertilizantes em Minas Gerais, 5ª aproximação. Viçosa: Ed. UFV, 1999. 359p.
COVRE, A.M. et al. Distribuição de sistema radicular de cafeeiro conilon irrigado e não irrigado. Pesquisa Agropecuária Brasileira, Brasília, v. 50, n. 11, p. 1006-1016, 2015.
DELBEM, F.C. et al. Fontes e doses de adubação nitrogenada na atividade microbiana e fertilidade do solo cultivado com Brachiaria brizantha. Acta Scientiarum Agronomy, Maringá, v. 33, n. 2, p. 361-367, 2011.
EMPRESA BRASILEIRA DE PESQUISA
AGROPECUÁRIA - EMBRAPA. Sistema brasileiro de classificação de solos. 5 ed.rev.ampl. Brasília: Embrapa, 2018. 590p.
FERRAZ, G.A.S. et al. Variabilidade espacial de dose de P2O5 e K2O para adubação diferenciada e convencional em lavoura cafeeira. Coffee Science, Lavras, v. 10, n. 3, p. 346-356, 2015.
FIGUEIREDO, V.C. et al. Levantamento da fertilidade do solo de lavouras cafeeiras em produção, no sul de Minas Gerais. Coffee Science, Lavras, v. 8, n. 3, p. 306-313, 2013.
FLORI, J.G.; RESENDE, G.M. Soil chemical attributes and leaf nutrients of “Pacovan” banana under two cover crops. Revista Caatinga, Mossoró, v. 29, n. 2, p. 290-295, 2016.
GUARÇONI, A. et al. Diâmetro de trado necessário à coleta de amostras num cambissolo sob plantio direto ou sob plantio convencional antes ou depois da aração. Revista Brasileira de Ciência do Solo, v. 31, n. 5, p. 947-959, 2007.
application. Coffee Science, Lavras, v. 13, n. 3, p. 356-364, 2018.
NATALE, W. et al. Acidez do solo e calagem e pomares de frutíferas tropicais. Revista Brasileira de Fruticultura, Jaboticabal, v. 34, n. 4, p. 1294-1306, 2012.
NATALE, W. et al. Efeitos da calagem na fertilidade do solo e na nutrição e produtividade da goiabeira. Revista Brasileira de Ciência do Solo, Viçosa, v. 31, n. 6, p. 1475-1485, 2007.
NATALE, W. et al. Resposta da caramboleira à calagem. Revista Brasileira de Fruticultura, Jaboticabal, v. 30, n. 4, p. 1136-1145, 2008.
OLIVEIRA, F.H.T. et al. Amostragem para avaliação da fertilidade do solo em função do instrumento de coleta das amostras e de tipos de preparo do solo. Revista Brasileira de Ciência do Solo, Viçosa, v. 31, n. 5, 973-983, 2007.
OLIVEIRA, R.B. et al. Comparação entre métodos de amostragem do solo para recomendação de calagem e adubação do cafeeiro conilon. Engenharia Agrícola, Jaboticabal, v. 28, n. 1, p. 176-186, 2008.
Ciência do Solo, Viçosa, v. 38, n. 3, p. 840-849, 2014. ROSOLEM, C.A.; TOZI, T.S.; GARCIA, R.A. Amostragem de terra para fins de fertilidade em função da ferramenta de amostragem. Revista Ceres, Viçosa, v. 57, n. 3, p. 405-414, 2010.
ROZANE, D.E. et al. Dimensionamento do número de amostras para avaliação da fertilidade do solo. Semina: Ciências Agrárias, Londrina, v. 32, n. 1, p. 111-118, 2011.
SANTOS, E.O.J.; GONTIJO, I.; SILVA, M.B. Planejamento amostral de propriedades químicas do solo em lavoura de café conilon. Coffee Science, Lavras, v. 8, n. 4, p. 423-431, 2013.
SANTOS, H.C. et al. Amostragem para avaliação da fertilidade do solo em função da variabilidade de suas características químicas. Revista Brasileira de Engenharia Agrícola e Ambiental, v. 13, Suplemento, p. 849-854, 2009.
SILVA, F. C. Manual de análises químicas de solos, plantas e fertilizantes. 2.ed.rev.atual. Brasília: Embrapa Informação Tecnológica, 2009. 627p.