Received April 5, 2011 and accepted July 28, 2011. Corresponding author: [email protected]
Effects of cottonseed meal supplemented with lysine and enzyme
(Hydroenzyme XP) on egg quality and performance of laying hens
Ali Asghar Saki1, Khashayar Pournia1, Mohamad Mehdi Tabatabaie1, Pouya Zamani1, Mojtaba Haghighat1, Jalal Salary1
1 Department of Animal Science, Faculty of Agriculture, Bu-Ali Sina University, Hamedan, Islamic Republic of Iran.
ABSTRACT - This study was conducted to evaluate the effect of cottonseed meal supplemented with lysine and enzyme on laying hens performance and egg quality. Eighty Hy-Line W-36 white Leghorns were allotted for 12 weeks in a 2 × 2 factorial experiment in a completely randomized design, including four treatments and five replications with four birds in each. Treatments included: basal diet + 1% lysine + 0% enzyme; basal diet + 1% lysine + 0.025% enzyme; basal diet + 2% lysine + 0% enzyme; and basal diet + 2% lysine + 0.025% enzyme. Protein content in the magnum tissue was not significantly affected by different levels of lysine and enzyme, although magnum Protein:RNA ratio increased with 2% of lysine as compared with 1%. Moreover, jejunum DNA’s concentration was not significantly affected by lysine. Similarly, jejunum RNA:DNA ratio increased with 2% of lysine. Performance specificity significantly improved with 2% lysine and 0.025% enzyme. Diets supplemented with 2% lysine and 0.025% enzyme can improve performance, increase magnum protein synthesis and jejunum cell efficiency.
Key Words: cottonseed meal, DNA, performance, protein synthesis, RNA
www.sbz.org.br
Introduction
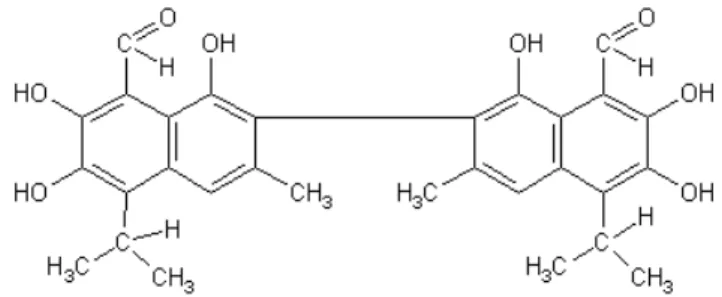
Cottonseed meal could be a favorable alternative protein source for laying hens diets, but the presence of a potentially toxic agent, gossypol, a poly-phenolic pigment found in virtually every part of the cotton plant including the seed (Azman & Yilmaz, 2005), has limited its uses (Lordelo et al., 2007). It has caused numerous problems related to development of iron deficiencies including anemia, labored breathing and formation of discolored yolks, which are not considered objectionable to consumers. Under condition of excessive heat during processing, gossypol may bind with lysine and form non-digestible maillard linkage, thus reducing the nutritional value of the lysine (Henry et al., 2001). Based on its nutrient profile, cottonseed meal is a more valuable feed ingredient in laying hens diets than in broilers diets, because laying hens have lower energy and protein requirement than broilers. In contrast, laying hens are more sensitive to gossypol ingestion than broilers (Lordelo et al., 2007). It is well documented that gossypol binds to lysine and reduces the absorption of this amino acid (Morgan, 1989; Risco & Chase, 1997). Gossypol 1,1,6,6,7,7- hexahydroxy-5,5- diisopropyl -3,3- dimethyl – (2,2- bi-naphthalene) -8,8 dicarboxyaldehyde} is a polyphenolic compound located in pigment glands that are distributed throughout the cotton plant (Carruthers et al., 2007;
Lordelo et al., 2007; Figure 1). Lysine is the first limiting amino acid in cottonseed meal (Qian & Yan, 2009) and typically has less nutritional value than soybean meal, generally providing 40 to 42% crude protein versus 44-48% for soybean meal. Binding gossypol and lysine in maillard reaction could make the reduction of lysine content in cotton seed meal severe. Problems related to lysine level and nutrient density may be reduced by several methods (Yu et al., 1996; Gamboa et al., 2001). Laying hens fed diets containing gossypol can produce eggs that have a brown yolk discoloration (Davis et al., 2002; Azman & Yilmaz, 2005). The objective of this study was to evaluate the effect of cottonseed meal by supplemented lysine and enzyme on performance and egg quality of laying hens and demonstrate cottonseed meal as a proper protein source for laying hens.
Material and Methods
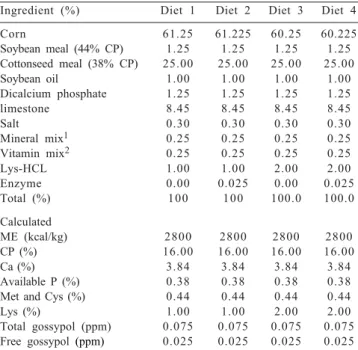
Eighty White Leghorn hens (80 weeks old) were used in this study for 12 weeks. Hens were randomly divided into four treatments and five replicates with four birds in each. The experiment was conducted in 2 × 2 factorial experiment in completely randomized design. The experimental diets were formulated to meet NRC’s (1994) nutrient requirements for hens (Table 1), particularly the recommendations for the Hy-Line W-36 strain. Hens were fed by mash basal diet supplemented with 1% lysine + 0% enzyme; 1% lysine + 0.025% enzyme; 2% lysine + 0% enzyme; and 2% lysine + 0.025% enzyme. (Hydro enzyme XP that contains xylanase, cellulase, amylase, lactase, protease, lipase and 4 types of probiotics). Water and feed were offered ad libitium. The light program had a duration of 16 hours per day. House temperature and humidity were recorded during the experiment. Average ambient relative humidity inside the house and daily temperature were 65±5% and 18±1 °C, respectively. Body weights were recorded at the beginning and at the end of study. The initial weight was 1359±77 g and the final weight was 1369±96 g.
Feed intake was measured weekly. Egg production and egg weight from all birds were tested daily through the experiment. Egg mass was calculated. Net feed conversion
ratio (NFCR) was analyzed by the Mandal et al. (2010) method, following the equation:
NFCR = Feed intake (kg)/Body weight gain (kg) + Egg production (kg) or
NFCR = Feed intake (kg)/Body weight loss (kg) + Egg production (kg)
Total gossypol of cottonseed meal was measured based on a hydrolysis of a gossypol linkage by oxalic acid in blue solution and finally separated released gossypol in chloroform and quantity measurement with UV spectrophotometer in 300 nm wave length (Botsoglu, 1991) as the following equation:
Total gossypol (ppm) = (2000×V) (C×W),
in which C: gossypol concentration in final solution, V: volume of the sample, W: sample weight (g).
Extraction of free gossypol by acetone was performed by hydrolysis with hydrochloridric acid, followed by separation of pure conformation then analysis with spectrophotometer in 300 nm wave length (Botsoglu, 1991) according to the following equation:
Free gossypol (ppm) = 100×C/W,
in which C: gossypol concentration in final solution and W: sample weight (g)
Egg quality analysis was performed every two weeks. Sixty normal eggs per treatment (3 eggs per replication) were randomly selected from the egg laying on the last three days (2 eggs/each day) and were used for analysis fortnightly. Eggs were stored at 4 °C for 7 d to enhance egg quality and yolk discoloration (Hewang et al., 2002). Egg characteristics were tested for egg quality measurement. Egg weight and egg shell weight were determined by electric balance. Egg length and width were measured using a Vernier caliper. Egg shape index was calculated as an egg diameter divided by egg length. Yolk color was determined on the Roche color fan (scoring 0 to 15). Egg internal and external quality traits were estimated by equations (Kul & Seker, 2004), as follows:
Egg content (gr) = egg production × (egg weight - shell weight SW)
Albumen index (%) = albumen height (mm)/[(albumen length (mm) + albumen width (mm))/ 2] ×100
Yolk index (%) = (yolk height/yolk diameter) ×100 Haugh unit (HU) = 100 log (albumen height + 7.57 – 1.7 EW0.37)
Specific gravity = W/(0.968 W - 0.4759 SW)
Unit surface shell weight (mg/cm2) = egg weight (mg)/egg surface area (cm2)
ESA = 3.9782 W0.75056
Shape index (%) = [width (cm)/height (cm)] ×100 Shell ratio (%) = [shell weight (g)/egg weight (g)] ×100 Ingredient (%) Diet 1 Diet 2 Diet 3 Diet 4
Corn 61.25 61.225 60.25 60.225
Soybean meal (44% CP) 1.25 1.25 1.25 1.25 Cottonseed meal (38% CP) 25.00 25.00 25.00 25.00
Soybean oil 1.00 1.00 1.00 1.00
Dicalcium phosphate 1.25 1.25 1.25 1.25
limestone 8.45 8.45 8.45 8.45
Salt 0.30 0.30 0.30 0.30
Mineral mix1 0.25 0.25 0.25 0.25
Vitamin mix2 0.25 0.25 0.25 0.25
Lys-HCL 1.00 1.00 2.00 2.00
Enzyme 0.00 0.025 0.00 0.025
Total (%) 100 100 100.0 100.0
Calculated
ME (kcal/kg) 2800 2800 2800 2800
CP (%) 16.00 16.00 16.00 16.00
Ca (%) 3.84 3.84 3.84 3.84
Available P (%) 0.38 0.38 0.38 0.38
Met and Cys (%) 0.44 0.44 0.44 0.44
Lys (%) 1.00 1.00 2.00 2.00
Total gossypol (ppm) 0.075 0.075 0.075 0.075 Free gossypol (ppm) 0.025 0.025 0.025 0.025 CP: crude protein; ME: metabolizable energy.
1 Mineral mix provided per followingin milligrams per kilogram of diet: Mn - 60;
Zn - 50; Fe - 30; I - 1.5; Se - 0.5. 2Vitamin mix provided per kilogram of diet:
where EW = egg weight (g); SW = egg shell weight (g); ESA = egg surface area (cm2) and AH = albumen height (mm). The protein content in the magnum tissue was measured according to the method of Bradford (1977). In this method, Bovine Serum Albumin (BSA) was used as a standard; samples were frozen in liquid nitrogen and ground to fine powder. Protein was extract in 100 mg Coomassie brilliant blue + 50 ml ethanol 95% (Bradford reagent). Finally, samples were measured by spectrophotometer (UV) in wave length 595 nm. The following equation used for determination of protein levels:
20×40 × 595 OD Protein concentration (mg/mL),
where OD595: absorption in 595 nm wave length; 40: microgram change into microliter; 20: dilution factor.
The deoxyribonucleic acid (DNA) was extracted from crude mucosal homogenates of the jejunum, using the method described by Doyle & Doyle (1987), as follows:
Samples were collected from the middle part of jejunum, cut, and mucosa was separated and transferred to micro tube. DNA was extracted with Cetyl Trimethyl Ammonium Bromide (CTAB). Eventually, DNA quantity was detected in spectrophotometer (UV) in wave length 260 nm as following the equation:
50×df ×260OD = DNA concentration (sg/g tissue), where OD260: absorption in 260 nm wave length and df: dilution factor (42). The number 50 shows that absorption in 260 nm is qualified as “1”, equal to 50 ng DNA
In order to measure cell efficiency and protein synthesis by RNA:DNA and RNA:protein, respectively, RNA integrity was checked. RNA extraction was determined by RNX-Plus Solution® kit in magnum tissue and jejenual mucosal. For magnum RNA extraction, samples were homogenized with liquid nitrogen. RNA was extracted with guanidinium
thiocyanate (GT), and the following equations were used in the determination of RNA quantity.
df×40 ×OD260 = RNA concentration (ng/μl),
where OD260 is the absorption in 260 nm wave length and df, the dilution factor (50). The number 40 shows that absorption in 260 nm is qualified as “1”, equal to 40 ng RNA Data from the experiment were subjected to ANOVA according to the GLM procedure. Duncan multiple range test procedure was used to detect significant difference. All statistical procedures were done by a SAS statistical software package (version 9.1), and differences were considered significant when P-value was below than 0.05.
Results and Discussion
The results of this study on performance of laying hens have shown that hen fed 2% lysine had increased number of eggs, egg weight, egg production, egg mass, body weight gain and daily feed intake (P<0.05) (Table 2). Similar trend was observed in 0.025% enzyme in the diet, except for number of eggs (P<0.05). Interaction effect of lysine and enzyme significantly improved number of eggs, egg
production, egg mass and daily feed intake (P<0.05). No
significant differences were obtained by feeding different levels of lysine and enzyme supplementation in feed conversion ratio, net feed conversion ratio at 92 weeks of age (P>0.05). Treatment 4 (2% lysine + 0.025 % enzyme) significantly increased number of eggs, egg mass, egg production, body weight gain and daily feed intake (P<0.05). Supplementation of cotton seed meal with lysine and enzyme reduced some anti-nutritional effects of this.
Results of this study have shown that supplement with 2% lysine significantly increased egg content of
% EN E W E P EM FI FCR NFCR BWG
Lysine 1 1.42±14.66a 58.68b±6.14 52.38b±5.10 30.23b±4.54 98.86b±5.89 3.33a±0.45 3.31a±0.45 8.37b±6.90 2 3.40±16.20a 60.20a±6.93 57.85a±12.16 34.63a±7.73 109.17a±11.54 3.25a±0.58 3.24a±0.57 12.00a±5.65
SEM 0.36 0.68 0.75 1.52 0.08 0.07 0.07 0.09
Enzyme 0 14.04b±1.95 14.04b±1.96 50.14b±6.96 29.62b±4.94 97.57b±5.38 3.37a±0.52 3.35a±0.52 7.85b±4.02 0.025 2.66a ± 16.82 58.72a± 6.98 60.08a±9.53 35.23a±6.67 110.47a±10.42 3.21a±0.50 3.19a±0.49 12.52a±6.48
SEM 0.36 0.68 0.75 1.52 0.08 0.07 0.07 0.09
Treatment 1 14.23b±1.48 57.11b±5.10 50.83b±5.31 29.00b±3.80 96.40b±6.11 3.37a±0.44 3.36a±0.43 7.40b±3.59 2 15.10b±1.23 58.25ba ±7.02 53.92b±4.39 31.45b±4.91 101.33b±4.51 3.28a±0.47 3.27a±0.46 9.35b±9.59 3 16.25b±2.32 59.20ba ±6.81 49.46b±8.28 30.25b±5.84 98.73b±4.28 3.37a±0. 60 3.35a±0.60 8.30b±4.79 4 18.55a±2.60 61.20a ±6.96 66.25a±9.30 39.01a±6.05 119.61a±5.36 3.14a±0.53 3.12a±0.51 15.70a±6.22
SEM 0.51 0.97 1.06 2.15 0.11 0.11 0.11 0.11
P value Lysine 0.009 0.01 0.009 0.0008 0.0002 0.52 0.49 0.67
Enzyme <0.0001 0.66 <0.0001 <0.0001 <0.0001 0.19 0.16 0.36
Lysine×Enzyme 0.002 0.12 0.002 0.009 0.001 0.53 0.51 0.63
Treatment <0.0001 0.05 <0.0001 <0.0001 <0.0001 0.46 0.41 0.53 Values within a column with different letters are different (P<0.05).
Treatment 1: 1% lysine + 0% enzyme; Treatment 2: 1% lysine + 0.025% enzyme; Treatment 3: 2% lysine + 0% enzyme; Treatment 4: 2% lysine + 0.025% enzyme. EN: number of eggs; EW: egg weight, EP: egg production; EM: egg mass; FI: feed intake; FCR: feed conversion ratio; NFCR: net feed conversion ratio; BWG: body weight gain; SEM: standard error of the mean.
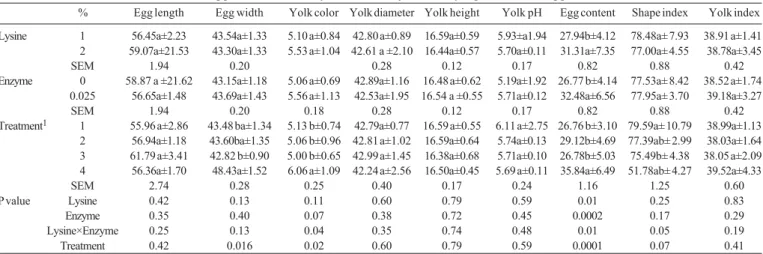
fresh egg (Table 3) and albumin index, yolk color, egg content, yolk color and Haugh unit in stored eggs as compared with 1% of lysine supplement (P<0.05). Moreover, interaction effect of lysine and enzyme supplement significantly influenced egg content, egg width, yolk color and shape index of a fresh egg (P<0.05). No significant differences were obtained for yolk diameter, yolk height, yolk pH, yolk index in stored eggs and egg length, yolk diameter, yolk height, yolk pH, shape index, and yolk index at 92 weeks of age in a fresh egg (P>0.05).
In laying hens, especially at this age (laying), the deposition of nutrients is more directed to increased egg production rather than body weight gain, in that case cottonseed meal supplemented with lysine and enzyme have no role in body weight gain in laying hens (Lordelo et al., 2007). Consequently, it seems that cottonseed meal
supplemented with lysine and enzyme could improve performance.
Results of this study have shown that in hens fed 2% of lysine supplement, yolk color, albumin height, albumin index, Haugh unit and egg content of a stored egg were higher than hens fed 1% of lysine supplement (P<0.05) (Table 4). Also, results have shown that 0.025% of enzyme supplement significantly increased yolk color and egg content as compared with 0% enzyme (P<0.05). In the end, interaction effect of lysine and enzyme supplementation significantly improved yolk color, albumin height, albumin index, Haugh unit and egg content of a stored egg (P<0.05). Based on laying hens fed cottonseed meal with lysine, Lordelo et al. (2007) suggested that the development of hen performance specificity occurs when hens are fed cottonseed supplemented with lysine. In this study, hens
% Egg length Egg width Yolk color Yolk diameter Yolk height Yolk pH Egg content Shape index Yolk index
Lysine 1 56.45a±2.23 43.54a±1.33 5.10 a±0.84 42.80 a±0.89 16.59a±0.59 5.93±a1.94 27.94b±4.12 78.48a± 7.93 38.91 a±1.41
2 59.07a±21.53 43.30a±1.33 5.53 a±1.04 42.61 a ±2.10 16.44a±0.57 5.70a±0.11 31.31a±7.35 77.00a± 4.55 38.78a±3.45
SEM 1.94 0.20 0.28 0.12 0.17 0.82 0.88 0.42
Enzyme 0 58.87 a ±21.62 43.15a±1.18 5.06 a±0.69 42.89a±1.16 16.48 a±0.62 5.19a±1.92 26.77 b±4.14 77.53a± 8.42 38.52 a±1.74
0.025 56.65a±1.48 43.69a±1.43 5.56 a±1.13 42.53a±1.95 16.54 a ±0.55 5.71a±0.12 32.48a±6.56 77.95a± 3.70 39.18a±3.27
SEM 1.94 0.20 0.18 0.28 0.12 0.17 0.82 0.88 0.42
Treatment1 1 55.96 a±2.86 43.48 ba±1.34 5.13 b±0.74 42.79a±0.77 16.59 a±0.55 6.11 a±2.75 26.76 b±3.10 79.59a± 10.79 38.99a±1.13
2 56.94a±1.18 43.60ba±1.35 5.06 b±0.96 42.81 a±1.02 16.59a±0.64 5.74a±0.13 29.12b±4.69 77.39ab± 2.99 38.03a±1.64
3 61.79 a±3.41 42.82 b±0.90 5.00 b±0.65 42.99 a±1.45 16.38a±0.68 5.71a±0.10 26.78b±5.03 75.49b± 4.38 38.05 a±2.09
4 56.36a±1.70 48.43a±1.52 6.06 a±1.09 42.24 a±2.56 16.50a±0.45 5.69 a±0.11 35.84a±6.49 51.78ab± 4.27 39.52a±4.33
SEM 2.74 0.28 0.25 0.40 0.17 0.24 1.16 1.25 0.60
P value Lysine 0.42 0.13 0.11 0.60 0.79 0.59 0.01 0.25 0.83
Enzyme 0.35 0.40 0.07 0.38 0.72 0.45 0.0002 0.17 0.29
Lysine×Enzyme 0.25 0.13 0.04 0.35 0.74 0.48 0.01 0.05 0.19
Treatment 0.42 0.016 0.02 0.60 0.79 0.59 0.0001 0.07 0.41
Values within a column with different letters are different (P<0.05). SEM: standard error of the means.
1Treatment 1: 1% lysine + 0% enzyme; Treatment 2: 1% lysine + 0.025% enzyme; Treatment 3: 2% lysine + 0% enzyme; Treatment 4: 2% lysine + 0.025% enzyme.
Table 3 - Effect of cottonseed meal supplemented with lysine and enzyme on laying hens fresh egg
% Yolk diameter Yolk height Yolk pH Yolk color Albumen height Albumin index Yolk index Haugh unit Egg content
Lysine 1 41.18 a±1.11 16.76 a±0.73 6.09 a±1.92 5.11 b±0.50 4.12a ±0.24 1.91b ±0.12 40.75 a±2.18 61.73 b±3.48 26.75 b±3.33
2 40.70 a±3.22 16.71 a±0.85 5.58 a±0.62 5.58 a±0.62 4.52 a±0.24 2.08 a±0.14 48.65 a±3.15 65.34 a±2.67 29.72 a±6.51
SEM 0.64 0.18 0.17 0.12 0.07 0.03 5.93 0.90 0.73
Enzyme 0 40.76 a±3.08 16.53 a±0.58 5.14 a±0.46 5.14 b±0.46 4.31 a±0.32 2.00 a±0.15 48.09 a±3.22 63.14 a±3.85 25.92 b±3.81
0.025 41.11 a±1.49 16.94 a±0.91 5.56 a±0.66 5.56 a±0.66 4.33 a±0.31 1.99 a±0.16 41.32 a±2.95 63.94a ±3.27 30.55 a±5.72
SEM 0.64 0.18 0.17 0.12 0.07 0.03 5.93 0.90 0.73
Treatment1 1 41.14 a±1.09 16.45 a±0.40 6.22 a±2.72 5.11 b±0.52 4.06 c±0.14 1.92bc±0.10 40.00a±1.35 60.60b±3.20 26.25b±3.05
2 41.12 a±1.15 17.07 a±0.85 5.79 a±0.09 5.12 b±0.48 4.18 bc±0.30 1.89 c±0.13 41.47 a ±2.60 62.87 ba±3.34 27.24 b±3.57
3 40.39 a±4.22 16.60 a±0.71 5.71 a±0.10 5.17 b±0.39 4.58 a±0.24 2.07 bc±0.16 56.14 a±4.98 65.87 a±2.58 25.59 b ±4.47
4 41.01 a±1.78 16.81 a±0.97 5.66 a±0.11 6.00 a±0.52 4.48 ba±0.23 2.09 a±0.12 41.17 a ± 3.31 65.02 a±2.76 33.85 a±5.58
SEM 0.91 0.25 0.24 0.17 0.10 0.04 8.39 1.27 1.03
P value Lysine 0.60 0.84 0.20 0.01 0.001 0.003 0.36 0.01 0.01
Enzyme 0.70 0.12 0.33 0.03 0.89 0.98 0.43 0.53 0.0004
Lysine×Enzyme 0.76 0.43 0.44 0.03 0.32 0.57 0.34 0.26 0.003
Treatment 0.91 0.38 0.37 0.006 0.009 0.02 0.49 0.049 0.0001
Values within a column with different letters are different (P<0.05). SEM: standard error of the means.
1Treatment 1: 1% lysine + 0% enzyme; Treatment 2: 1% lysine + 0.025% enzyme; Treatment 3: 2% lysine + 0% enzyme; Treatment 4: 2% lysine + 0.025% enzyme.
fed diets with cottonseed meal supplemented with 2% lysine showed significantly higher protein:RNA ratio in the jejunum (876.43 nanogram/mg) and RNA:DNA ratio in the magnum (2119.62 nanogram/mg) as well as higher protein synthesis in the magnum and cell efficiency in the jejunum (Yu et al., 1996). Increased jejunum cell efficiency caused better digestion and increased feed intake. Moreover, egg number, egg weight, daily feed intake and egg production increased as compared with hens receiving cottonseed meal diets enriched with 1% lysine (Tables 2, 5 and 6). However, no statistically significant differences in feed conversion rate and net feed conversion rate were obtained among treated groups, because daily feed intake increased similarly to egg production. This result was in agreement
with previous report by Lordelo et al. (2007). Indeed, Fitzsimmons et al. (1989) reported that FCR was not detrimentally affected by cottonseed meal supplemented with lysine and enzyme. Different levels of lysine and enzyme have no significant effect on body weight gain; this result is in agreement with Jones & Smith (1977), Fitzsimmons et al. (1989) and Lordelo et al. (2007).
Traditionally, gossypol is assumed to cause egg yolk discoloration based on a chemical combination of gossypol with ferric iron (Fe+3) released from yolk proteins (Lordelo et al., 2007). In the present research, laying hens only produced egg yolk with severe discoloration (discoloration score >6) when they were fed diets containing 2% lysine. More lysine supplement bind to gossypol and detoxify it,
% DNA extraction2 RNA extraction3 RNA:DNA ratio4
Lysine 1 2396.72a±415.02 1925.50b±429.53 1664.72b±430.71
2 2714.34a±612.74 2770.50a±477.00 2119.62a±510.51
SEM 1 3 1 . 1 0 6 7 . 9 7 9 2 . 6 3
E n z y m e 0 2468.34a±489.47 2194.70a±284.77 1819.67a±312.24
0 . 0 2 5 2642.73a±587.54 2501.30b±805.46 1964.67a±668.20
SEM 1 3 1 . 1 0 6 7 . 9 7 9 2 . 6 3
T r e a t m e n t1 1 2334.75a±373.48 1955.00c±158.89 1705.17b±259.98
2 2458.70a±464.33 1896.00c±586.85 1624.27b±566.04
3 2601.92a±571.52 2434.40b±135.18 1934.17a±330.3
4 2826.77a±661.74 3106.60a±459.38 2305.08a±603.88
SEM 1 8 5 . 4 1 9 6 . 1 3 1 3 1 . 0 0
P value Lysine 0 . 1 6 0 . 0 0 1 > 0 . 0 0 3
E n z y m e 0 . 3 6 0 . 0 0 5 0 . 2 8
Lysine×Enzyme 0 . 7 8 0 . 0 0 1 0 . 1 0
T r e a t m e n t 0 . 3 0 0.0001> 0 . 0 0 9
Values within a column with different letters are different (P<0.05); SEM: standard error of the means.
1Treatment 1: 1% lysine + 0% enzyme; Treatment 2: 1% lysine + 0.025% enzyme; Treatment 3: 2% lysine + 0% enzyme; Treatment 4: 2% lysine + 0.025% enzyme. 2Nanogram/Microliter.
3Nanogram/Microliter. 4Nanogram/Microliter.
Table 5 - DNA and RNA extraction in the jejunum
% Protein content2 RNA extraction3 Protein:RNA ratio4
Lysine 1 1079.24a±33.89 2634.30a±164.01 822.81b±65.32
2 1086.68a±22.63 2514.20a±297.42 876.43a±108.05
SEM 5 . 5 1 4 6 . 9 1 1 8 . 0 7
E n z y m e 0 1081.84a±14.57 2627.10a±220.34 829.40a±74.26
0 . 0 2 5 1084.08a±38.41 2521.40a±261.76 869.83a±105.25
SEM 5 . 5 1 4 6 . 9 1 1 8 . 0 7
T r e a t m e n t1 1 1078.72a±15.93 2644.60a±159.90 818.31b±47.70
2 1079.76a±46.59 2624.00ba±176.02 827.30b±81.77
3 1084.96a±13.15 2609.60ba±276.13 840.49 a±95.37
4 1088.40a±30.03 2418.80b±300.46 912.37a±112.61
SEM 7 . 7 9 6 6 . 3 5 5 1 . 5 0
P value Lysine 0 . 3 5 0 . 0 8 0 . 0 5
E n z y m e 0 . 7 7 0 . 1 3 0 . 1 3
Lysine×Enzyme 0 . 8 7 0 . 2 1 0 . 2 3
T r e a t m e n t 0 . 7 9 0 . 0 9 0 . 0 7
Values within a column with different letters are different (P<0.05); SEM: standard error of the mean.
1Treatment 1: 1% lysine + 0% enzyme; Treatment 2: 1% lysine + 0.025% enzyme; Treatment 3: 2% lysine + 0% enzyme; Treatment 4: 2% lysine + 0.025% enzyme. 2 Microgram/milligram.
3 Nanogram/microliter. 4 Nanogram/miligram.
in that case 2% of lysine supplement prevent gossypol from discoloring of yolk of eggs. Egg content significantly improved with 2% level of lysine; Davis et al. (2002), showed that egg content was affected with the different level of a synthetic amino acid in laying hen. Egg content was affected by egg production, therefore, increase in egg production improved egg content. Increase in jejunum cell efficiency and magnum protein synthesis caused more nutrients for egg content and egg production. Results of this study have shown that increasing egg weight definitely increased egg surface area and unit surface shell ratio. These results are in agreement with Davis et al. (2002) and Lordelo et al. (2007). The results of this research show that cottonseed meal with different levels of lysine and enzyme supplement have no significant effects on Haugh unit or yolk quality (P>0.05). Haugh unit and yolk quality are important, concerning internal egg characteristics. The validity of the Haugh unit has been questioned by Silverside & Scott (2001). Their presumption was that it was influenced by temperature, hen age, bird strain, nutrition, diseases (infectious Bronchitis), vitamin supplements, artificial exposure to ammonia, induced molt and medication.
T h e r e s u l t s h a v e s h o w n t h a t 2 % o f l y s i n e supplemented significantly increased jejunum mucosal RNA content and RNA:DNA ratio as compared with 1% lysine (P<0.05) (Table 5). Moreover, 0.025% enzyme significantly increased RNA jejunum concentration (P<0.05). Treatment 4 (2% lysine + 0.025% enzyme) significantly improved RNA and jejunum RNA:DNA ratio (P<0.05), while there was no significant effect on DNA concentration in the jejunum (P>0.05).
Intestinal and other organ growth may be due to cellular hyperplasia, hypertrophy or a combination of the two processes (Morisset, 1993). Iji et al. (2001) suggest that the development of jejunum RNA:DNA ratio caused better usage of hen feed. This result is in agreement with increased in jejunum RNA:DNA proliferation due to the supplementation of cottonseed meal with 2% lysine and 0.025% enzyme (Table 6). Results of this study have indicated that, in hens fed 2% of lysine supplementation, the RNA:DNA ratio was higher than for hens fed 1% of lysine supplementation, which was the same as for Iji et al. (2001). The results have shown that 2% of lysine have no significant effect on protein content (P>0.05), while 2% of lysine significantly decreased RNA concentration in the magnum tissue (P<0.05) (Table 6). However, 2% of lysine significantly increased Protein:RNA ratio in the magnum (P<0.05). Moreover, enzyme had no significant effect on protein content, RNA concentration or Protein:RNA ratio (P>0.05). Similar trend was observed in the interaction
effect of lysine and enzyme (P>0.05). Treatment 4 (2% lysine + 025/0% enzyme) significantly increased protein:RNA ratio (P<0.05), but had no significant effect on protein content (P>0.05).
The protein:RNA ratio has been proposed by Waterlow et al. (1998) as an indicator of ribosomal capacity for translating amino acids in to protein; they also showed that the RNA:DNA ratio measures the efficiency of cells in the performance of various functions.
Conclusions
Laying hen performance is improved by cottonseed meal supplemented by 2% lysine and 0.025% enzyme. Diets containing 25% cottonseed meal supplemented with 2% lysine and 0.025% enzyme could be administered to laying hens and provide satisfactory performance and egg quality.
Acknowledgements
The authors would like to thank the Department of Animal Science in Bu Ali Sina University for their excellent scientific collaboration.
References
AZMAN, M.A.; YILMAZ, M. The growth performance of broiler chicks fed diets containing cottonseed meal supplemented with lysine. Revue de Medecine Veterinaire, v.2, n.156, p.104-106, 2 0 0 5 .
BOTSOGLU, N.A. Determination of “free” gossypol in cottonseed and cottonseed meals by second-derivative ultraviolet spectrophotometry. Journal of Agricultural and Food Chemistr y, v.39, n.3, p.478-482, 1991.
BRADFORD, M. A rapid and sensitive method for the quantitation of microgram quantities of protein utilizing the principal of protein-dye binding. Analytical Biochemistry, v.72, p.248-254, 1 9 7 7 .
CARRUTHERS, N.J.; DOWED, M.K.; STEMMER, P.M. Gossypol inhibits calcineurin phosphatase activity as a multiple site. Eroupean Journal of Pharmacology, v.555, n.3 p.106-114, 2 0 0 7 .
DAVIS, A.J.; LORDELO, M.M.; DALE, N. The use of cottonseed meal with or without added soapstock in laying hen diet. Journal of Applied Poultry Research, v.11, n.2, p.127-133, 2 0 0 2 .
DOYLE, J.J.; DOYLE, J.J. Rapid DNA isolation procedure for small quantities of fresh leaf tissue. Pithchemical Bulletin, v.36, n.41, p.715-722, 1987.
FITZSIMMONS, R.C.; NEWCOMB, M.; MOUL, I.E. The long term effect of feeding ground and whole cottonseed to laying hens. Journal of Animal Science, v.69, n.3, p.425-429, 1989. GAMBOA, D.A.; CALHOUN, M.C.; KUHLMANN, S.W. et al. Tissue distribution of gossypol enantiomers in broiler fed various c o t t o n s e e d m e a l . J o u r n a l o f P o u l t r y S c i e n c e, v. 8 0 , n . 1 , p.920-925, 2001.
supplemented with lysine. Journal of Poultry Science, v.80, n.2, p.762-768, 2001.
HEWANG, B.W.; BIRD, H.R.; ALTSCHUL, A.M. Relationship between discoloration in eggs and dietary free gossypol supplied by different cottonseed products. Journal of Poultry Science, v.34, n.1, p.81-90, 2002.
IJI, P.A.; SAKI, A.A,; TIVEY, D.R. Intestinal development and body growth of broiler chicks on diets supplemented whit non-starch polysaccharides. Animal Feed Science and Technology, v.89, n.(3-4), p.175-188, 2001.
JONES, L.A.; SMITH, F.H. Effect of bound gossypol and amino acid supplementation of glandless cottonseed on growth of weaning rat. Journal of Animal Science, v.44, n.3, p.401-409, 1 9 7 7 .
KUL, S.; SEKER, I. Phenotypic correlation between some external and internal egg quality traits in the Japanese quail (coturnix coturnix japonica). International Journal of Poultry Science, v.3, n.6, p.400-405, 2004.
LORDELO, M.M.; DAVIS. A.J.; CALHOUN, M.C. et al. Relative toxicity of gossypol enantiomers in laying and broiler breeder hens. Journal of Poultry Science, v.86, n.3, p.582-590, 2007. MANDAL, A.B.; YADAV, A.S.; JOHRI, T.S. et al. Nutrition management and poultry diseases. Isatnagar: Barili Uopi, 2010. p.293-295.
MORGAN, S.E. Gossypol as a toxicant in livestock. In: BURROWS, G.E. (Ed) The veterinary clinics of North America: food animal practice. Philadelphia: W.B. Saunders, 1989. p.251-263. MORISSET, J. Regulation of growth and development of the gastrointestinal tract. Journal of Dairy Science, v.76, n.7, p.2080-2093, 1993.
NATIONAL RESEARCH COUNCIL - NRC. Nutrients requirements of poultry. 9.ed. Washington, D.C.: National Academic Press, 1994. 155p.
QIAN, J.; YAN, Z. Cogeneration of biodiesel and nontoxic cottonseed meal from cottonseed through in situ alkaline transestrification. Journal of Energy and Fuel, v.23, n.1, p.507-512, 2009. RISCO, C.A.; CHASE, C.C. Gossypol hand book of plant and
fungal toxicant. Boca Raton: CRC Press, 1997. p.87-97. SILVERSIDE, F.G.; SCOTT, T.A. Effect of storage and layer age on
quality of egg from two line ofhen”. Journal of Poultry Science, v.80, n.8, p.1240-1245, 2001.
WATERLOW, J.C.; GARLIC, P.J.; MILLWARD, D.J. Protein turnover and growth. In: Protein turnover in mammalian tissues and in whole body. Amsterdam: North-Holland, 1998. p.529-594. YU, F.; MaCNABB, W.C.; BARRY, T.N. et al. Effect of heat treatment