journal homepage: www.scielo.br/ne ISSN: 1519-566X
ECOLOGY, BEHAVIOR AND BIONOMICS
Oviposi on Behavior of
Grapholita molesta
Busck (Lepidoptera: Tortricidae)
at Di
ff
erent Temperatures
EDB
S
, TMA K
, LB M
Depto de Fitotecnia e Fitossanitarismo, Univ Federal do Paraná, Curi ba, PR, Brasil
Keywords
Apple tree, fecundity, oriental fruit moth, pre-oviposi on period
Correspondence
L B M , Depto de Fitotecnia e Fitossanitarismo, UFPR, 82210-280, Curi ba, PR, Brasil; [email protected] Edited by Wesley A C Godoy – ESALQ/USP Received 08 October 2009 and accepted 30 November 2010
Abstract
Cultivation of temperate-climate fruits is economically important for Brazil. Grapholita molesta Busck is a pest that causes damage to
apples, peaches, plums, and pears growing in different micro-regions of southern Brazil, and understanding its reproductive behavior is essential to develop control strategies. The objective of this study was to ascertain the in luence of different temperatures (13, 16, 19, 22, and 25ºC) on the oviposition behavior of G. molesta. Females of G. molesta were placed in individual plastic containers, and the
pre-oviposition period and the number of eggs laid were assessed until adult death. Temperature in luenced the pre-oviposition period, and females kept at 22° were the irst to lay their eggs. Oviposition occurred over a longer period of time at 13°C than at the higher temperatures. The highest total number of eggs was obtained at 19°C, with the mean daily oviposition being directly proportional to the temperature. There was a negative interaction between the pre-oviposition period and the total number of eggs laid by females. The most suitable temperature for oviposition of G. molesta was 19°C.
IntroducƟ on
In Brazil, cultivation of temperate-climate fruits, especially apples, peaches, and plums, is mostly concentrated in the southern areas. The main apple-producing regions, Vacaria (Rio Grande do Sul state), Fraiburgo, São Joaquim and Lages (Santa Catarina state), and Lapa and Porto Amazonas (Paraná) have different climates because of their geographical locations. The environmental conditions in these regions influence the behavior of pests, including the oriental fruit moth Grapholita molesta (Busck), one
of the key pests of temperate-climate fruit-growing regions in Brazil (Monteiro & Hickel 2004).
A population dynamics study showed that G. molesta
is most abundant in the warmer months of the year (Hickel et al 2003), which coincide with the fruit-ripening
period, resulting in high potential for economic damage. Although temperatures during the winter in southern Brazil are unsuitable for the physiological activity of the insect, adults of G. molesta can still be found in most of the
fruit-producing regions. The exception is São Joaquim, a region situated at 1,200 a.m.s.l., where minimum monthly temperatures range from 3°C to 6°C and maximum temperatures from 18°C to 21°C (INMET 2007).
Studies evaluating the effects of temperature on the development and reproduction of G. molesta were
carried out by Dustan & Armstrong (1933) and Chaudhry (1956), and their data guided several behavioral studies on G. molesta, in addition to serving as a basis for other
important factor when analyzing the insect’s geographical distribution.
Very little is known on the in luence of temperature on G. molesta in Brazil, and available information mostly
describes the effects of temperature on the development of immatures (Grellmann et al 1992). Therefore, more
information is required on the effects of temperature on G. molesta performance, especially in temperatures
lower than those tested in previous studies (Chaudhry 1956, Grellmann et al 1992), in order to represent the
natural conditions for the species in some of the major fruit-growing regions in southern Brazil.
The objective of this study was to assess the in luence of temperature on the oviposition behavior of G. molesta
under laboratory conditions.
Material and Methods
Insect origin
Pupae of G. molesta were obtained from a laboratory
colony initiated from insects collected in apple orchards in Vacaria, RS (28º26’S and 50º48’W, altitude 950 m), and maintained for two years on an arti icial diet (Guennelon
et al 1981).
OviposiƟ on behavior assessment
Insects were sexed during pupal stage (Beeke & Jong 1991), and insect couples were isolated in plastic containers (200 ml) closed with tulle fabric. Adults were fed with a solution of 13% honey and 0.13% nipagin impregnated on a cotton swab that was replaced every three days until the end of the experiment.
The oviposition performance of G. molesta was
observed at 13, 16, 19, 22, and 25°C ± 1ºC by placing 50 couples in climate chambers with a 14:10 h (L:D) photoperiod and 70 ± 10% RH, in a fully randomized experimental design. The following parameters were assessed daily: the pre-oviposition period, the total number of eggs, and the time when the eggs were laid.
StaƟ sƟ cal analysis
The data collected on the number of eggs laid were subjected to Anova (F < 0.05) and means were compared by the Tukey test (P < 0.05), using the freely available software R (R Development Core Team 2005) and Statgraphics Centurion XV, version 15.1.02 (StatPoint®). The distribution of times of egg laying was itted to the Gaussian model using the Matlab 7.0 Program (MathWorks®). The interactionbetween the pre-oviposition period and the total number of eggs laid was de ined. The pre-oviposition period was estimated by classes, based on the quartiles and the total egg number in each class, calculated using the program Excel (Microsoft, San Francisco, USA).
Results and Discussion
Pre-oviposiƟ on period (POP)
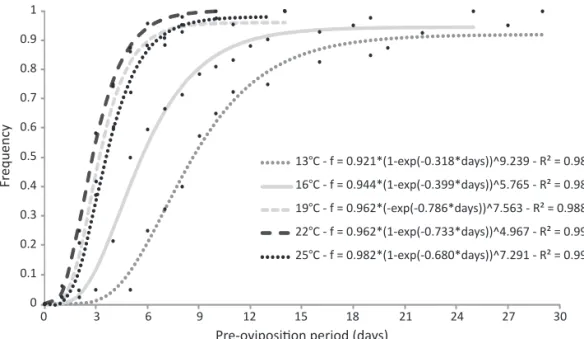
The POP of G. molesta was represented by cumulative
frequency curves (Fig 1), and two behavioral tendencies were observed. A longer POP was observed at temperatures below 19°C, with means of 11.4 and 7.5 days at 13°C and 16°C, respectively. Females started to lay eggs earlier at temperatures higher than 16°C, on average 4.4, 3.6, and 5.9 days, respectively, for 19, 22, and 25°C. The POP observed at these temperatures was on average 27%
Fig 1 Cumulative frequency distribution of the pre-oviposition period (POP) of Grapholita molesta at 13, 16, 19, 22, and 25 ± 1°C.
0 0.1 0.2 0.3 0.4 0.5 0.6 0.7 0.8 0.9 1
0 3 6 9 12 15 18 21 24 27 30
Fr
equency
Pre-oviposi on period (days)
lower than those at 13°C and 16°C. The relationship between temperature (t) and POP was established as POP = 56.158 - 4.9372 t + 0.1167 t2 (P < 0.05; R² = 0.985). The second-degree equation predicts that higher temperatures will be unfavorable for G. molesta
reproduction, resulting in an increase in POP in the areas of Brazil with temperatures higher than 22°C.
The POP was relatively uniform at 19, 22, and 25°C (respectively, σ = 2.8, 1.7, and 2.3 days); signi icantly lower (P < 0.05) than those at 13 and 16°C (respectively, σ = 6.7 and 4.7 days).
About 60% of the females kept at 16°C initiated egg-laying activity on the ifth day after emergence, while 90% of females kept at 19°C or above were already actively laying eggs after this period (Fig 1). This behavior of females at low temperatures may be related to the need to accumulate energy to maintain vital functions, and has also been observed in another insect species, Plutella xylostela (Lepidoptera: Yponomeutidae) (Crema & Castelo
Branco 2004).
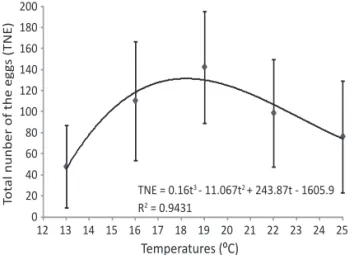
Total number of eggs (TNE)
The in luence of temperature on G. molesta TNE was
signi icant and showed a symmetrical trend, with the largest mean number of eggs per female at 19°C (Fig 2), about twice as large as the TNE obtained at the extreme temperatures. The maximum number of eggs per female was 272, at 19°C, more than the 262 observed by Reichart & Bodor (1982). At 22°C and 25°C, more eggs were produced than was observed by Chaudhry (1956), for temperatures between 21°C and 26.6°C. The relationship between TNE and temperature (t) can be expressed by TNE = -1605.9244 + 243.8651 t -11.0668 t2 + 0.16 t3 (P < 0.29; R² = 0.943) (Fig 2).
The variance of the total number of eggs laid per female was similar (P = 0.26) in all treatments. That is, the TNE was homoscedastic regardless of the experimental conditions.
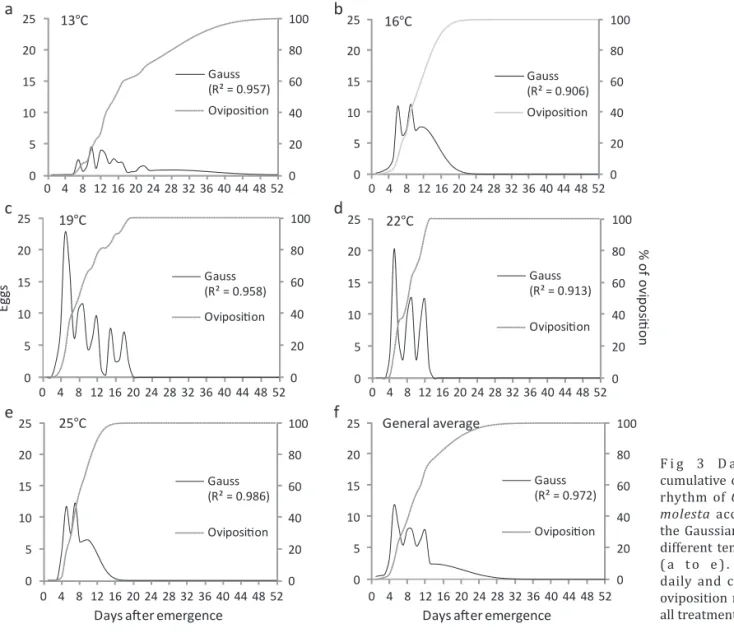
OviposiƟ on daily rhythm (ODR)
Females maintained at 13°C (Fig 3a) distributed their eggs homogeneously over a total of 51 days of oviposition. At temperatures higher than 13°C, eggs were laid during up to 50% of the ODR period (Fig 3b, c, d, e), and the lowest ODR occurred at 22°C (Fig 3 d).
The average duration of egg-laying activity (DELA) was similar at 13, 16, and 19°C (Fig 4a), and was nearly 45% longer than at the other temperatures tested. This difference was shown by analyzing the probability function of the accumulated DELA (Fig 4b) that distinguishes these two groups.
The variance in DELA was larger at temperatures lower than 22°C, and decreased as the temperature increased (Fig 4a). The variance showed that part of the females prolonged their egg-laying activity at low temperatures. In nature, this extension of the egg-laying period may increase reproductive success by distributing egg production over a wider range of conditions.
The ratio between total number of eggs and average duration of egg-laying activity (TNE/DELA) showed that the largest mean daily egg production (DEP) occurred at 22°C (Fig 5), suggesting that females in this temperature were more ef icient in producing/laying eggs, although females at 19°C laid a larger number of total eggs. In low temperatures, mean DEP was reduced 50% compared to the number of eggs produced at 22°C; a similair reduction (56%) was observed at 13°C compared to 16°C (Fig 5). The ratio between temperature (t) and DEP can be de ined by the equation DEP = -4.45667 + 0.728667 t (P < 0.05; R² = 0.850) (Fig 5).
Cyclical oviposition peaks were identi ied (Fig 3a-f) at approximately 3-day intervals, but in different quantities among treatments. Thus, females at 13°C required 34 days after emergence to complete 90% oviposition, which was 212% longer than the time needed at 16°C and 19°C (16 days). An increase of 3°C, compared to 19°C, resulted in a four-day decrease in the period needed to carry out 90% of the oviposition; there was no difference between 22°C and 25°C (12 days). Fig 3f shows the general oviposition performance, regardless of temperature, and in this case, 19 days were needed to carry out 90% of the oviposition.
RelaƟ onshipbetween the pre-oviposiƟ on period
(POP) and the total number of eggs (TNE)
As seen in Table 1, the TNE tended to be higher in the irst three quartiles in all treatments. Females were more fecund when the POP was lower, a relationship observed at 19°C and 22°C.
The combined results of all treatments allowed a statistical analysis as a single observation, from which it was ascertained that the irst two classes (frequency of eggs) represented about 76% of the total clutches (Table
Fig 2 Mean of the total number of eggs (TNE) laid per Grapholita
molesta female at 13, 16, 19, 22, and 25 ± 1ºC.
TNE = 0.16t3 - 11.067t2 + 243.87t - 1605.9
R2 = 0.9431
0 20 40 60 80 100 120 140 160 180 200
12 13 14 15 16 17 18 19 20 21 22 23 24 25
T
o
ta
l nunber of the eg
gs (TNE)
Fig 4 Reproductive period of Grapholita molesta at different temperatures (a). Cumulative distribution frequency of Grapholita molesta
reproductive periods at different temperatures (b). MOD - reproductive period.
MOD = -0.1381t2 + 4.412t - 18.117
R2 = 0.7336
0 5 10 15 20 25
13 15 17 19 21 23 25
Reproduc
ve period (days)
Temperature (ºC)
0 0.1 0.2 0.3 0.4 0.5 0.6 0.7 0.8 0.9 1
0 5 10 15 20 25 30 35 40 45 50
Frequency
Reproduc ve period (days)
13ºC - f = 1.619*(1-exp(-0.025*days))^0.976 R² = 0.995
16ºC - f = 1.026*(1-exp(-0.107*days))^2.793 R² = 0.994
19ºC - f = 1.109*(1-exp(-0.237*days))^73.172 R² = 0.973
22ºC - f = 1.283*(1-exp(-0.155*days))^2.587 R² = 0.992
25ºC - f = 0.999*(1-exp(-0.261*days))^2.549 R² = 0.992
a b
F i g 3 D a i l y a n d cumulative oviposition
rhythm of Grapholita
molesta according to
the Gaussian model at different temperatures ( a to e ) . G e n e ra l daily and cumulative oviposition rhythm for all treatments (f).
0 20 40 60 80 100 0 5 10 15 20 25
0 4 8 12 16 20 24 28 32 36 40 44 48 52
13°C
Gauss (R² = 0.957) Oviposi on 0 20 40 60 80 100 0 5 10 15 20 25
0 4 8 12 16 20 24 28 32 36 40 44 48 52
16°C
Gauss (R² = 0.906) Oviposi on 0 20 40 60 80 100 0 5 10 15 20 25
0 4 8 12 16 20 24 28 32 36 40 44 48 52
E
ggs
19°C
Gauss (R² = 0.958) Oviposi on 0 20 40 60 80 100 0 5 10 15 20 25
0 4 8 12 16 20 24 28 32 36 40 44 48 52
% of ovi p os i on
22°C
Gauss (R² = 0.913) Oviposi on 0 20 40 60 80 100 0 5 10 15 20 25
0 4 8 12 16 20 24 28 32 36 40 44 48 52
Days a er emergence Days a er emergence 25°C
Gauss (R² = 0.986) Oviposi on 0 20 40 60 80 100 0 5 10 15 20 25
0 4 8 12 16 20 24 28 32 36 40 44 48 52
General average
Gauss (R² = 0.972) Oviposi on
a b
c d
e f
1). Thus, females that had the smallest POP were those that laid the largest TNE, shown by the equation TNE = 185.3e-0.14 POP (P < 0.05; R² = 0.880) (Fig 6).
As a conclusion, females of G. molesta with a shorter
pre-oviposition period were the most fecund. As temperature
affected the pre-oviposition period, the temperature of 19°C was be the most favorable for G. molesta reproduction
(expressed as egg-laying activity).
Fig 5 Grapholita molesta mean daily egg production at different
temperatures.
DEP= 0.7287t - 4.4579 R² = 0.8505
0 5 10 15 20 25
12 13 14 15 16 17 18 19 20 21 22 23 24 25
D
a
il
y
e
gg pr
od
uc
o
n
(D
E
P
)
Temperature (ºC)
Temperature
(ºC) Quar le¹ N² POP (days) NTE
3 σ
CV Total number eggs
Frequency of eggs4
13
1st 10 <6 59.10 a 36.02 60.95 591 0.334 2nd 13 6.0 – 9 61.62 a 49.65 80.58 801 0.453 3rd 7 9 – 13.0 32.00 a 18.30 57.20 224 0.127 4th 10 >13 15.10 b 15.81 104.69 151 0.085
16
1st 9 <4 132.56 a 59.28 44.72 1193 0.264 2nd 12 4 – 5.0 121.58 a 47.12 38.75 1459 0.323
3rd 12 5.0 – 9 129.67 a 41.18 31.76 1556 0.344
4th 9 >9 34.44 b 23.96 69.56 310 0.069
19
1st 16 <3 157.00 a 31.70 20.19 2512 0.421 2nd 16 3.0 – 4.0 163.19 a 46.83 28.70 2611 0.438 3rd 5 4 – 5.0 107.80 ab 53.12 49.28 539 0.090 4th 6 >5 50.33 b 43.98 87.39 302 0.051
22
1st 12 <2 104.50 a 49.07 46.96 1254 0.271 2nd 16 2.0 – 3 83.75 a 52.46 62.64 1340 0.290 3rd 8 3 – 4.0 132.75 a 46.28 34.86 1062 0.230 4th 11 >4 88.18 a 48.69 55.22 970 0.210
25
1st 18 <3 102.94 a 50.59 49.15 1853 0.566 2nd 8 3.0 – 4.0 67.00 ab 47.04 70.22 536 0.164 3rd 12 4.0 – 6.0 51.25 b 41.51 81.00 615 0.188 4th 5 >6.0 53.60 ab 64.30 119.96 268 0.082
Overall
1st 64 <3 112.89 a 52.72 46.70 7225 0.359 2nd 69 3.0 – 5.0 117.06 a 58.80 50.23 8077 0.401 3rd 31 5.0 – 7.0 81.13 b 56.31 69.40 2515 0.125 4th 52 >7.0 44.83 c 42.94 95.79 2331 0.116
Table 1 Relationship between pre-oviposition period (POP) and total number of eggs (TNE) of Grapholita molesta at different temperatures, arranged by quartiles.
1Quartiles calculated by the program Excel 2007 (Microsoft, USA); 2Number of females; 3TNE - total number of eggs per female; 4Frequency
of eggs in relation to the total eggs laid in the treatment.
Means followed by different letters within the treatment were signi icantly different by the Tukey test (α = 0.05).
TNE = 185.35e-0.146POP
R² = 0.8801
0 20 40 60 80 100 120 140 160 180
0 3 6 9 12 15 18 21 24 27 30
To
ta
l number of eg
gs (TNE)
Pre-oviposi on period (days)
Fig 6 General relationship between the pre-oviposition period and
temperature. At 19°C, G. molesta females had the greatest
potential for daily egg laying.
Acknowledgments
The authors thank Dr Eduardo Hickel for his critical revision of the manuscript, the CNPq for a grant to the irst author to carry out this study, and the Paraná Federal University.
References
Beeke H, Jong D de (1991) Identi ication of larvae and pupae, p.65-71. In Greest LPS van der, Evenhuis HH (eds) World crop pests: tortricid pests: their biology, natural enemies and control. Elsevier, Amsterdam, 808p.
Chaudhry GU (1956) The development and fecundity of the oriental
fruit moth Grapholita (Cydia) molesta (Busck) under controlled
temperatures and humidities. Bull Entomol Res 46: 869-98. Crema A, Castelo Branco M (2004) Impacto da temperatura e
fotoperíodo no desenvolvimento ovariano e oviposição de traça-das-crucíferas. Hortic Bras 22: 305-308.
Dustan GG, Armstrong T (1933) Observations on the relation of temperature and moisture to the oriental fruit moth. Proc Entomol Soc Ontario 63: 29-39.
Guennelon G, Audemard H, Fremond JC, El Idrissi Ammari MA (1981) Progrès réalisés dans l’élevage permanent du Carpocapse
(Laspeyresia pomonella L.) sur milieu arti iciel. Agronomie 1:
59-64.
Grellmann EO, Loeck AE, Salles LAB, Fachinello JC (1992) Necessidade térmica e estimativa do número de gerações de
Grapholita molesta (Busck, 1916) (Lepidoptera: Olethreutidae)
em Pelotas, RS. Pesq Agropec Bras 27: 999-1004.
Hickel E, Hickel GR, Souza OFF de (2003) Dinâmica populacional da mariposa oriental em pomares de pessegueiro e ameixeira. Pesq Agrop Bras 38: 325-337.
Instituto Nacional de Meterologia Normais Climatologicas (1961-1990) Available at <http://www.inmet.gov.br/html/clima/ mapas/> Accessed on 03 Feb 2008.
Monteiro LB, Hickel E (2004) Pragas de impostância econômica em fruteiras de caroço, p.223-261. In Monteiro LB, Mio LLM de, Serrat BM, Motta ACV, Cuquel FL (eds) Fruteiras de caroço: uma visão ecológica. Curitiba, Reproset I. Grá ica, 390p.
Price PW (1997) Insect ecology. New York, John Wiley & Sons, 874p.
R Development Core Team (2005) R: a language and environment for statistical computing. R Foundation for Statistical Computing, Vienna, Austria.
Reichart G, Bodor J (1982) Biology of the oriental fruit moth (Grapholita molesta Busck) in Hungary. Acta Phytopathol Acad