Revista Brasileira de
Engenharia Agrícola e Ambiental
Campina Grande, PB, UAEA/UFCG – http://www.agriambi.com.br
v.20, n.9, p.847-855, 2016
Physical quality of grains subjected to moistening
and drying processes for marketing
Paulo C. Coradi
1, Alisson H. S. de Sousa
2, Lucas J. Camilo
2,
Roney E. Lima
2, Lélia V. Milane
2& Ângelo F. C. Lemes
2 DOI: http://dx.doi.org/10.1590/1807-1929/agriambi.v20n9p847-855A B S T R A C T
The aim was to evaluate the physical quality of conventional and transgenic corn grains, through drying and wetting processes for marketing. The experimental design was completely randomized in a factorial scheme (7 x 3 x 2), corresponding to seven drying times (0, 20, 40, 60, 80, 100 and 120 min), three temperatures of the drying air (80, 100 and 120 °C) and two hybrids of corn (conventional AG 1051 and transgenic Herculex@ 30S31H). Grain drying was held in convection oven with forced air ventilation while the wetting was done in a B.O.D chamber. The water movement in the grain, the volume and the electrical conductivity were evaluated periodically. The results showed that the transgenic corn grain reduced the negative effects of drying and moistening on the physical quality. The increase in drying air temperature accelerated the physical deterioration of conventional and transgenic corn grains. The increase in water content by the moistening process caused losses in grain physical quality, similar to the drying process, for both the conventional and transgenic corn grains.
Qualidade física de grãos de milho submetidos aos processos
de secagem e umedecimento para comercialização
R E S U M O
O objetivo deste trabalho foi avaliar a qualidade física de grãos de milho convencional e transgênico nos processos de secagem e umedecimento para comercialização. O delineamento experimental utilizado foi inteiramente casualisado, esquema fatorial (7 x 3 x 2), sete tempos de secagem (0, 20, 40, 60, 80, 100, 120 min), três temperaturas do ar de secagem (80, 100 e 120 °C) e dois híbridos de milho (convencional AG 1051 e o transgênico Herculex@ 30S31H). A secagem dos grãos foi realizada em estufa de convecção com ventilação forçada do ar enquanto o umedecimento foi feito em câmara do tipo B.O.D. Foram avaliadas periodicamente a movimentação de água nos grãos, o volume e a condutividade elétrica. Os resultados permitiram concluir que os grãos de milho transgênico reduziram os efeitos negativos da secagem e umedecimento na qualidade física dos grãos. O aumento da temperatura do ar de secagem acelerou a deterioração física dos grãos de milho convencional e transgênico. O aumento dos teores de água pelo processo de umedecimento proporcionou perdas na qualidade física dos grãos, semelhante ao processo de secagem, para ambos os grãos de milho convencional e transgênico.
Key words:
AG 1051
Herculex@ 30S31H water content temperature
Palavras-chave:
AG 1051
Herculex@ 30S31H teor de água temperatura
1 Universidade Federal de Santa Maria/Câmpus de Cachoeira do Sul. Cachoeira do Sul, RS. E-mail: paulo.coradi@ufsm.br (Corresponding author) 2 Universidade Federal de Mato Grosso do Sul/Câmpus de Chapadão do Sul. Chapadão do Sul, MS. E-mail: alisson_spricigo@hotmail.com;
luucasjandrey@hotmail.com; roney.eloylima@yahoo.com.br; vanessamilane@hotmail.com; angelofcl@yahoo.com.br
Introduction
Corn is one of the major inputs for the production segment and is used in large volume in animal feed, particularly in the sectors of poultry, swine and dairy cattle in “fresh” form, industrialized as bran, or silage (Elias et al., 2000; Coradi et al., 2011).
Grain quality is to be preserved to a maximum during storage, due to the occurrence of chemical, biochemical, physical and microbiological changes. The speed and intensity of these processes depend on the intrinsic quality of the grain, the pre-storage operations, the storage system used and the environmental factors during the storage period (Schuh et al., 2011; Antunes et al., 2011). Elias et al. (2000) note that, among the methods for preserving the quality of grain, drying brings not only savings from the point of view of processing, but also enables the preservation of natural environment product for a long period of time. Thus, drying stands out as the most important post-harvest stage, ensuring the maintenance of grain quality. However, the drying process also causes water loss in the grain and can cause damage to the cellular structure of the product, leading to changes in shape and decrease in their dimensions and chemical-physical characteristics (Elias et al., 2000: Costa et al., 2011; Tiecker Júnior et al., 2013).
The water level recommended by Brasil (2012) for the marketing of corn grain is 13.5% (w.b.); however, this moisture is still hotly contested by industries, farmers, cooperatives, warehouses, federal agencies and research institutions, because corn grains with moisture content above 12% (w.b.) when stored quickly lose their intrinsic quality.
Thus, many producers have opted to raise the water content of the grains, the storage conditions (12% w.b.) to the condition of 13.5% (w.b.) market at the moment, to achieve greater product weight. However, this type of operation is contradictory to the functional aspects and post-harvest quality, causing the standards of grain water content for marketing established by MAPA to be questionable.
The drying operation followed by moistening can be highly detrimental to the product, affecting the physical and chemical quality, and thus, precautions regarding food safety standards should be studied to minimize losses (Sousa et al., 2011). The objective was to evaluate the physical quality of conventional and transgenic corn grains with an initial moisture content of 13.5% (w.b.), through drying processes (at temperatures of 80, 100 and 120 °C) and moistening (under the conditions of 10 °C and 90% relative humidy (RH)) for marketing in accordance with the standards established by MAPA.
Material and Methods
The experiment was conducted at the Laboratory of Grain Postharvest at Federal University of Mato Grosso do Sul (UFMS), Campus of Chapadão do Sul (CPCS). The experimental design was completely randomized in a factorial scheme (7 x 3 x 2), corresponding to seven drying times (0, 20, 40, 60, 80, 100 and 120 min), three drying air temperatures
(80, 100 and 120 ° C), and two corn hybrids (conventional AG 1051 and transgenic Herculex@ 30S31H). For each drying
condition, there were three replicates. Analysis of variance was performed and the means were compared by Tukey test at 0.05 probability.
Conventional and transgenic corn grains were harvested at moisture contents of 13.5% (w.b.) and dried in convection oven with forced air ventilation at temperatures of 80, 100 and 120 °C. Corn grains used for evaluation were chosen manually, to form homogeneous and standardized lots.
For each corn sample, two aluminum caps were used, one with ten grains for measuring width, thickness and length, and another one with one hundred and fifty grains, weighed for the determination of water content, every twenty minutes. For each withdrawal, a sample of seventy-five seeds was weighed for the evaluation of electrical conductivity. Then, a sample with the same quantities of grain (one hundred and fifty) was subjected to the wetting process for the same drying time. For moistening the grain, it was considered, as the initial water content, the moisture obtained in the grain at the end of each drying process, the twenty-minute interval and water content of the final moisture obtained in grains with moistening, when the grain reached the equilibrium water content. A B.O.D. chamber at a temperature of 10 °C and RH of 90% was used to accomplish wetting. For each moisture condition, there were three replicates.
The temperature and the relative humidity were monitored throughout the drying and moistening. Upon withdrawal of each sample, ten grains were weighed and measured again. The water content of embu grains were determined by the gravimetric method. Grsize (length, width and thickness) was evaluated using a digital caliper (Mohsenin, 1986).
The electrical conductivity test was performed according to the methodology described by Vieira & Krzyzanowski (1999). Twenty-five grains were used for three sub-samples from each treatment and weighed accurately using two decimal places (0.01 g). Samples were placed in plastic cups to soak with 75 mL of deionized water and kept in a refrigerated B.O.D. chamber, temperature-controlled at 25 ± 2 °C for 24 h. The solutions containing the grains were lightly stirred, for the uniformity of the leachate, and immediately proceeded to the reading on a portable digital conductivity meter (CD-850 - "Instrutherm"). The results were divided by the mass of 25 grains and expressed in μS cm-1 g-1 grains.
Results and Discussion
For the process of moistening, it was found that increasing the exposure of the grains under conditions of 10 °C and 90% RH promoted water absorption. At drying temperatures of 100 to 120 °C, there was an increase in the absorbed water content, until the time of 80 min, thereafter the values varied and, at the time of 100 min, the levels decreased; at the time of 120 min, they increased again until reaching the hygroscopic equilibrium water content.
In Figure 2, it was found that the same time used for drying is not enough to rehydrate the grains, through the wetting process. The loss of grain quality due to the leaching of ions was verified through the electrical conductivity, that is, the rewetting of the grains contributed to the reduction in quality, in proportions similar to those in the drying. However, higher electrical conductivity values coincided with the higher temperature treatments, because these conditions promoted
0 2 4 6 8 10 12 14 16
0 5 10 15 20 25 30 35 40
0 20 40 60 80 100 120
Moisture content (% w
.b.)
Desorbed water (%)
Drying time (min)
Percentage of water desorbed* Moisture content*
C D
E F
G
a b c d e f
g
A B
0 2 4 6 8 10 12 14
0 10 20 30 40 50 60
0 20 40 60 80 100 120
Moisture content (% w
.b.)
Desorbed water (%)
Drying time (min)
Percentage of water desorbed* Moisture content* B
C D
E F
G
a b c d e f g
A
0 2 4 6 8 10 12 14
0 10 20 30 40 50 60 70
0 20 40 60 80 100 120
Moisture content (% w
.b.)
Desorbed water (%)
Drying time (min)
Percentage of water desorbed* Moisture content*
B C
D E
F G
a b c d e f g
A
0 2 4 6 8 10 12 14
0 0.5 1 1.5 2 2.5 3 3.5
0 20 40 60 80 100 120
Moisture content
(% w
.b.)
Absorbed
water (%)
Wetting time (min)
Percentage water absorbed* Moisture content*
B B
C D
E F
a b c
a b c d e e f
A
0 2 4 6 8 10 12 14
0 0.5 1 1.5 2 2.5 3 3.5 4 4.5 5
0 20 40 60 80 100 120
Moisture content (% w
.b.)
Absorbed water (%)
Wetting time (min)
Percentage water absorbed* Moisture content*
B C
D F
E G
a b c d e f g
A
0 2 4 6 8 10 12 14
0 0.5 1 1.5 2 2.5 3 3.5 4 4.5
0 20 40 60 80 100 120
Moisture content
(% w
.b.)
Absorbed
water (%)
Wetting time (min)
Percentage water absorbed* Moisture content*
C D
E F F
a b c d e f g
A
B
A. B.
C. D.
E. F.
*Significant at 0.05 probability level by Tukey test
largest amount of leached ions, i.e., greater disruption of cell membranes of the tissues that make up the grains (Vieira, 2008; Siqueira et al., 2011; Coradi et al., 2014). Thus, it can be seen that increased water content in the grains for the allowed marketing conditions (13.5% w.b.) (Brasil, 2012) through moistening can be an alternative to increasing the weight of the grain mass; however, the loss of physical quality was evident.
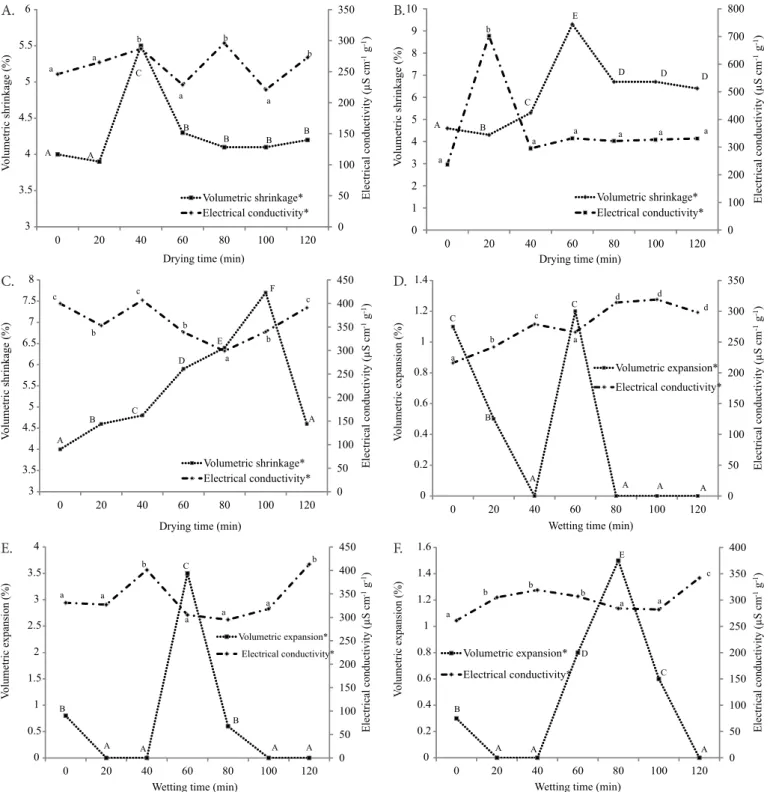
In Figure 3, it was observed that increasing the drying time caused a reduction of the grain volume. For the drying temperature of 80 °C, the time of 20 to 40 min showed the largest grain volume reductions. At the temperature of 100
°C, further reduction in the volume of the grains occurred in the time interval between forty and sixty minutes, coming into equilibrium in the following days.
At drying temperature of 120 °C, it was noted an increase in the time interval for the grains to be in balance, and that the volume reduction occurred in the range of zero to 10 min. During drying, the grains simultaneously undergo several physical changes caused by variations in the drying temperature and grain moisture, causing water and thermal stresses, expansion, contraction and irreversible changes in the density and porosity (Corrêa et al., 2010; Goneli et al., 2011).
0 50 100 150 200 250 300 350
0 5 10 15 20 25 30 35 40
0 20 40 60 80 100 120
Electric
conductivity (µ
S cm
al
-1
g
-1)
Desorbed water (%)
Drying time (min)
Percentage of water desorbed* Electricalconductivity* B
C D
E F
G
a
a b
c c
c a
A
0 100 200 300 400 500 600 700 800
0 10 20 30 40 50 60
0 20 40 60 80 100 120
Electric
conductivity (µS cm
al
-1
g
-1)
Desorbed water (%)
Drying time (min)
Percentage of water desorbed* Electricalconductivity* B
A
C D
E F
G
a
a a a a
a b
0 50 100 150 200 250 300 350 400 450
0 10 20 30 40 50 60 70
0 20 40 60 80 100 120
Electric
conductivity (µS cm
al
-1
g
-1)
Desorbed water (%)
Drying time (min)
Percentage of water desorbed* Electricalconductivity* A
B C
A B
C D
E F
G
c c
c
b
a b b
0 50 100 150 200 250 300 350
0 0.5 1 1.5 2 2.5 3 3.5
0 20 40 60 80 100 120
Electric
conductivity (µS cm
al
-1
g
-1)
Absorbed water (%)
Wetting time (min)
Percentage water absorbed* Electricalconductivity* A
B C
D E
F G
a b
c c
d d
d
0 50 100 150 200 250 300 350 400 450
0 0.5 1 1.5 2 2.5 3 3.5 4 4.5 5
0 20 40 60 80 100 120
Electric
conductivity
(µS
cm
al
-1
g
-1)
Absorbed
water
(%)
Wetting time (min)
Percentage of water absorbed* Electricalconductivity*
A B
C D
F E
G
a
a a
a a
b
b
0 50 100 150 200 250 300 350 400
0 0.5 1 1.5 2 2.5 3 3.5 4 4.5
0 20 40 60 80 100 120
Electric
conductivity (µS cm
al
-1
g
-1)
Absorbed water
(%)
Wetting time (min)
Percentage water absorbed* Electricalconductivity* B
C D
F F
E
a
b b b
a a
c
A
A. B.
C. D.
E. F.
*Significant at 0.05 probability level by Tukey test
0 50 100 150 200 250 300 350
3 3.5 4 4.5 5 5.5 6
0 20 40 60 80 100 120
Electric
conductivity (µS cm
al
-1
g
-1)
V
olumetric shrinkage (%)
Drying time (min)
Volumetric shrinkage* Electricalconductivity* A A
C
B
B B B a
a
a b b
b a
0 100 200 300 400 500 600 700 800
0 1 2 3 4 5 6 7 8 9 10
0 20 40 60 80 100 120
Electric
conductivity (µS cm
al
-1
g
-1)
V
olumetric shrinkage
(%)
Drying time (min)
Volumetric shrinkage* Electricalconductivity* A B
C E
D D D
a
a
a a a a
b
0 50 100 150 200 250 300 350 400 450
3 3.5 4 4.5 5 5.5 6 6.5 7 7.5 8
0 20 40 60 80 100 120
Electric
conductivity
(µS
cm
al
-1
g
-1)
V
olumetric
shrinkage
(%)
Drying time (min)
Volumetric shrinkage* Electricalconductivity* B
C D
E
F
A b
a b
c c c
b
A
0 50 100 150 200 250 300 350
0 0.2 0.4 0.6 0.8 1 1.2 1.4
0 20 40 60 80 100 120
Electric
conductivity (µS cm
al
-1
g
-1)
V
olumetric expansion (%)
Wetting time (min)
Volumetric expansion* Electricalconductivity* C
A
A A A B
C
a b
c a
d d d
0 50 100 150 200 250 300 350 400 450
0 0.5 1 1.5 2 2.5 3 3.5 4
0 20 40 60 80 100 120
Electric
conductivity (µS cm
al
-1
g
-1)
V
olumetric expansion
(%)
Wetting time (min)
Volumetric expansion*
B
A A A A
B C
a a
a a
a
b b
Electrical conductivity*
0 50 100 150 200 250 300 350 400
0 0.2 0.4 0.6 0.8 1 1.2 1.4 1.6
0 20 40 60 80 100 120
Electric
conductivity (µS cm
al
-1
g
-1)
V
olumetric expansion
(%)
Wetting time (min) Volumetric expansion*
Electricalconductivity*
A A A
C D
E
a
b b b
a a
c
B
A. B.
C. D.
E. F.
*Significant at 0.05 probability level by Tukey test
Figure 3. Volumetric shrinkage variation and expansion x electrical conductivity in grains of conventional corn hybrid AG 1051, during the drying and wetting processes: (A, D) T 80 °C; (B, E) T 100 °C; (C, F) T 120 °C
Siqueira et al. (2011) found that the decrease of the geometric volume and diameter of the grains were directly proportional to the water content, regardless of the drying condition.
In the process of grain moistening, at the temperature of 80 °C, there was a greater increase in volume for the interval from 40 to 60 min; after 80 min, it tended to equilibrium. For the temperature of 100 °C, there was greater increase in volume in time of 40 to 60 min, then reaching equilibrium. At the temperature of 120 °C, the increase in the volume was higher in the time interval from 40 to 80 min.
For drying and moistening and for all treatments, there were losses of grain quality, analyzed by the electrical
conductivity test, oscillating throughout drying and moistening, but attenuated in a curve, very close to all the conditions evaluated.
Observing the results presented in Figure 4, with increased drying time, the water content of the transgenic corn grains decreased for all temperatures, as observed for conventional corn, but less intensively, between the ranges of time. The same was found for the water desorbed from the grains, wherein the temperature increased the drying time and accelerated the process .
0 2 4 6 8 10 12 14
0 5 10 15 20 25 30 35
0 20 40 60 80 100 120
Moisture content (% w
.b.)
W
ater desorbed (%)
Drying time (min)
Percentage of water desorbed* Moisture content*
A B
C C
D D
E
a b c d e f g
0 2 4 6 8 10 12 14
0 10 20 30 40 50 60
0 20 40 60 80 100 120
Moisture content (% w
.b.)
W
ater desorbed (%)
Drying time (min)
Percentage of water desorbed* Moisture content*
A B
C D
E E
F
a b c d e f g
0 2 4 6 8 10 12 14
0 10 20 30 40 50 60 70
0 20 40 60 80 100 120
Moisture
content
(%
w
.b.)
W
ater
desorbed
(%)
Drying time (min)
Percentage of water desorbed* Moisture content*
B C
D
E E
F
a b c d e f g
A
0 2 4 6 8 10 12 14
0 0.2 0.4 0.6 0.8 1 1.2 1.4 1.6
0 20 40 60 80 100 120
Moisture content (% w
.b.)
W
ater absorbed (%)
Wetting time (min)
Porcentage of water absorbed* Moisture content* A
C
C
D D
B
D
a b c d e f g
0 2 4 6 8 10 12 14
0 0.5 1 1.5 2 2.5 3 3.5 4
0 20 40 60 80 100 120
Moisture content (% w
.b.)
W
ater absorbed (%)
Wetting time (min)
Porcentage of water absorbed* Moisture content*
A B
B C
C D
E
a b c d e f g
0 2 4 6 8 10 12 14
0 0.5 1 1.5 2 2.5 3 3.5
0 20 40 60 80 100 120
Moisture content (% w
.b.)
W
ater absorbed (%)
Wetting time (min)
Porcentage of water absorbed* Moisture content*
A B
C D
E D
F
a b b c d e f
*Significant at 0.05 probability level by Tukey test
Figure 4. Variation of moisture content x desorbed water and absorbed in transgenic corn hybrid Herculex 30S31H during the drying and moistening processes: (A, D) T 80 °C; (B, E) T 100 °C; (C, F) 120 °C
time and temperature to which the grains were subjected during the drying step. These events occur because the water potential is much changed, especially in the early imbibing, influencing the water absorption and may derail the sequence of events related to the process (Vieira, 2008; Coradi et al., 2014).
In Figure 5, the loss of grain quality through the leaching of ions was verified through the electrical conductivity.
Increasing the drying temperature and time led to greater cell damage to the grain tissues, according to results reported by other authors (Oliveira et al., 2013; Coradi et al., 2014). However, the wetting was not an intensive increase in electrical conductivity.
In Figure 6, in the drying, there was a reduction of the grain volume with the increase in the drying air temperature and time.
A. B.
C. D.
0 20 40 60 80 100 120
0 1 2 3 4 5 6 7
0 20 40 60 80 100 120
Electric
conductivity (µS cm
al
-1
g
-1)
V
olumetric shrinkage (%)
Drying time (min)
Volumetric shrinkage* Electricalconductivity* B
C D
E F
G
a b
b
b b c
d
A
0 50 100 150 200 250 300
0 1 2 3 4 5 6 7
0 20 40 60 80 100 120
Electric
conductivity
(µS
cm
al
-1
g
-1)
V
olumetric
shrinkage
(%)
Drying time (min)
Volumetric shrinkage* Electricalconductivity* B
B
C C
C D
a b
b c
c d
c
A
0 50 100 150 200 250
0 1 2 3 4 5 6 7 8
0 20 40 60 80 100 120
Electric
conductivity (µS cm
al
-1
g
-1)
V
olumetric shrinkage
(%)
Drying time (min)
Volumetric shrinkage* Electricalconductivity* A
B C
B C
C D a
b b b
b
c c
0 20 40 60 80 100 120 140
0 0.1 0.2 0.3 0.4 0.5 0.6 0.7 0.8 0.9
0 20 40 60 80 100 120
Electric
conductivity (µS cm
al
-1
g
-1)
V
olumetric expansion (%)
Wetting time (min)
Volumetric expansion* Electricalconductivity* B
B B
C C
D
a a a
b b
c
a
A
0 50 100 150 200 250 300
0 0.2 0.4 0.6 0.8 1 1.2 1.4
0 20 40 60 80 100 120
Electric
conductivity
(µS cm
al
-1
g
-1)
V
olumetric exp
ansion
(%)
Wetting time (min)
Volumetric expansion* Electricalconductivity* A A
A B
B D
a a
b b
c c
d
C
0 50 100 150 200 250 300
0 0.2 0.4 0.6 0.8 1 1.2 1.4 1.6
0 20 40 60 80 100 120
Electric
conductivity (µS cm
al
-1
g
-1)
V
olumetric expansion
(%)
Wetting time (min) Volumetric expansion* Electricalconductivity*
B A
C D E
a b
b c
b d
D
b
D
*Significant at 0.05 probability level by Tukey test
Figure 5. Variation of desorbed water percentage and absorbed x electrical conductivity of grains of transgenic corn hybrid Herculex 30S31H, during the drying and moistening processes: (A, D) T 80 °C; (B, E) T 100 °C; (C, F) T 120 °C
The larger volume reductions in Figure 6 occurred in the time of 100 and 120 min. These findings are important, since the volumetric changes of the product due to water removal are reported as the main causes of changes in the main physical properties of agricultural products (Siqueira et al, 2011; Goneli et al., 2011). In the moistening of the grains, for all the temperatures used in drying, there were variations in increasing the volume and, for the temperature of 80 °C, the greatest increase in volume was obtained at 120 min, while for the drying temperature of 100 ° C, it occurred at time
of 80 min and at a temperature of 120 °C in a period of 20 min.
According to the results of Figure 6, it was found that the disintegration of the cell tissue of the grain, quantified by the electrical conductivity, was increased with the increase of the wetting time, but not linearly. This was due to fluctuations of water charges absorbed by the grains along the moistening. Increasing the resistance presented in the different layers that make up the cellular structure of the plant tissue caused the physical damage in grains to be variable for each time of moistening.
A. B.
C. D.
0 20 40 60 80 100 120
0 5 10 15 20 25 30 35
0 20 40 60 80 100 120
Electric
conductivity (µS cm
al
-1
g
-1)
W
ater
desorbed (%)
Drying time (min)
Percentage of water desorbed* Electricalconductivity* A
B
C D
E E F
a b
b b b
c d
0 50 100 150 200 250 300
0 10 20 30 40 50 60
0 20 40 60 80 100 120
Electric
conductivity (µS cm
al
-1
g
-1)
W
ater desorbed (%)
Drying time (min)
Percentage of water desorbed* Electricalconductivity* A
B C
D E
F G
a c
b
d d f
e
0 50 100 150 200 250
0 10 20 30 40 50 60 70
0 20 40 60 80 100 120
Electric
conductivity
(µS cm
al
-1
g
-1)
W
ater desorbed
(%)
Drying time (min)
Percentage of water desorbed* Electricalconductivity* B
C D
E F G a
b b b
b
c c
A
0 20 40 60 80 100 120 140
0 0.2 0.4 0.6 0.8 1 1.2 1.4 1.6
0 20 40 60 80 100 120
Electric
conductivity (µS cm
al
-1
g
-1)
W
ater absorbed (%)
Wetting time (min)
Percentage of water absorbed* Electricalconductivity* A
D
B D
C D
a
a
b c d
a
0 50 100 150 200 250 300
0 0.5 1 1.5 2 2.5 3 3.5 4
0 20 40 60 80 100 120
Electric
conductivity (µS cm
al
-1
g
-1)
W
ater absorbed (%)
Wetting time (min)
Percentage of water absorbed* Electricalconductivity*
A B
B C
D
C E
a b
c d
e f
e
0 50 100 150 200 250 300
0 0.5 1 1.5 2 2.5 3 3.5
0 20 40 60 80 100 120
Electric
conductivity (µS cm
al
-1
g
-1)
W
ater absorbed (%)
Wetting time (min)
Percentage of water absorbed* Electricalconductivity*
B C
D E
F
D
a b
b c
b d
A
*Significant at 0.05 probability level by Tukey test
Figure 6.Volumetric shrinkage variation and expansion x electrical conductivity of grains of transgenic corn hybrid Herculex 30S31H, during the drying and moistening processes: (A, D) T 80 °C; (B, E) T 100 °C; (C, F) 120 °C
Conclusions
1. The genetically modified corn grains reduced the negative effects of drying and moistening on the physical quality of the grain.
2. The increase of the drying air temperature accelerated the physical deterioration of conventional and transgenic corn grains.
3. The increase in water content by moistening process caused losses in the physical quality of the grain, similar to those of the drying process, for both the conventional and transgenic corn grains.
Acknowledgements
The authors thank FUNDECT - MS, for the financial support and UFMS, for the physical space for the development of the research.
Literature Cited
Antunes, L. E. G.; Viebrantz, P. C.; Gottardi, R.; Dionello, R. G. Características físico-químicas de grãos de milho atacados por
Sitophilus zeamais durante o armazenamento. Revista Brasileira de Engenharia Agrícola e Ambiental, v.15, p.615-620, 2011. http:// dx.doi.org/10.1590/S1415-43662011000600012
A. B.
C. D.
Brasil. Portaria n° 611, de 04 de julho de 2012. Alterar os incisos IV e VI do art. 25 e o art. 31, todos da Instrução Normativa n° 60, de 22 de dezembro de 2011. Diário Oficial da República Federativa do Brasil, Brasília, DF, n. 129, 5 jul. 2012. Seção 1, p.10. Coradi, P. C.; Lacerda Filho, A. F. de; Melo, E. C. Quality of raw materials
from different regions of Minas Gerais State utilized in ration industry. Revista Brasileira de Engenharia Agrícola e Ambiental, v.15, p.424-431, 2011. http://dx.doi.org/10.1590/S1415-43662011000400015 Coradi, P. C.; Melo, E. C.; Rocha, R. P. Evaluation of electrical conductivity
as a quality parameter of lemongrass leaves (Cymbopogon citratus
Stapf) submitted to drying process. Drying Technology, v.32, p.969-980, 2014. http://dx.doi.org/10.1080/07373937.2013.879593 Corrêa, P. C.; Goneli, A. L. D.; Alonzo Júnior, P. C.; Oliveira, G. H. H.;
Valente, D. S. M. Moisture sorption isotherms and isosteric heat of sorption of coffee in different processing levels. International Journal of Food Science and Technology, v.45, p.2016-2022, 2010. http://dx.doi.org/10.1111/j.1365-2621.2010.02373.x
Costa, L. M.; Resende, O.; Sousa, K. A.; Gonçalves, D. N. Coeficiente de difusão efetivo e modelagem matemática da secagem de sementes de crambe. Revista Brasileira de Engenharia Agrícola e Ambiental, v.15, p.1089-1096, 2011. http://dx.doi.org/10.1590/ S1415-43662011001000014
Elias, M. C.; Dionello, R. G.; Radünz, L. L.; Milman, M. J.; Barbosa, F. F.; Martins, I. R. Armazenamento e industrialização de grãos de milho na propriedade rural. Pólo de Modernização Tecnológica em Alimentos da Região Sul do Rio Grande do Sul. Pelotas: UFPEL-FAEM-DCTA, 2000. 32p.
Goneli, A. L. D.; Corrêa, P. C.; Magalhães, F. E. A.; Baptestini, F. M. Contração volumétrica e forma dos frutos de mamona durante a secagem. Acta Scientiarum Agronomy, v.33, p.1-8, 2011. http:// dx.doi.org/10.4025/actasciagron.v33i1.4629
Mohsenin, N. N. Physical properties of plant and animal materials. New York: Gordon and Breach Publishers, 1986. 841p.
Oliveira, D. E. C.; Resende, O.; Souza, S. T. A.; Siqueira, V. C.; José Neto, C. A. Alterações morfométricas em grãos de soja durante o processo de secagem. Semina: Ciências Agrárias, v.3, p.975-984, 2013.
Schuh, G.; Gottardi, R.; Ferrari, E. F.; Antunes, L. E. G.; Dionello, R. G. Efeitos de dois métodos de secagem sobre a qualidade físico-química de grãos de milho safrinha-RS, armazenados por 6 meses. Semina: Ciências Agrárias, v.32, p.235-244, 2011. http://dx.doi. org/10.5433/1679-0359.2011v32n1p235
Siqueira, V. C.; Resende, O.; Chaves, T. H. Contração volumétrica dos frutos de pinhão-manso durante a secagem em diversas temperaturas. Revista Brasileira de Armazenamento, v.36, p.171-178, 2011.
Sousa, K. L.; Resende, O.; Chaves, T. H.; Costa, L. M. Cinética de secagem do nabo forrageiro (Raphanus sativus L.). Revista Ciência Agronômica, v.42, p.883-892, 2011. http://dx.doi.org/10.1590/ S1806-66902011000400009
Tiecker Júnior, A.; Dionello, R. G.; Ferrari Filho, E.; Antunes, L. E.; Castro, B. de. Avaliação da germinação de grãos de milho em armazenamento hermético e não hermético sob diferentes umidades de colheita. Cadernos de Agroecologia, v.8, p.1-5, 2013. Vieira, R. D. Temperature during soybean seed storage and
the amount of electrolytes of soaked seed solution. Science Agriculture, v.65, p.496-501, 2008. http://dx.doi.org/10.1590/ s0103-90162008000500008