Revista Brasileira de
Engenharia Agrícola e Ambiental
Campina Grande, PB, UAEA/UFCG – http://www.agriambi.com.br
v.21, n.4, p.261-266, 2017
Oat yield through panicle components and growth regulator
Anderson Marolli
1, José A. G. da Silva
2, Rubia D. Mantai
1,
Ana P. Brezolin
1, Maria E. Gzergorczick
2& Darlei M. Lambrecht
2DOI: http://dx.doi.org/10.1590/1807-1929/agriambi.v21n4p261-266
A B S T R A C T
The growth regulator modifies the expression of lodging and panicle components in oat plants, with reflexes in yield. The objective of this study was to define the optimal dose of growth regulator in oat for a maximum lodging of 5%. In addition, this study aimed to identify potential variables of the panicle to compose the multiple linear regression model and the simulation of grain yield in conditions of use of the regulator under low, high and very high fertilization with nitrogen. The study was conducted in 2011, 2012 and 2013 in a randomized block design with four replicates in a 4 x 3 factorial scheme, for growth regulator doses (0, 200, 400 and 600 mL ha-1) and N-fertilizer doses (30, 90 and 150 kg ha-1), respectively. The growth regulator doses of 395, 450 and 560 mL ha-1 are efficient, with maximum oat lodging of 5%, under low, high and very high nitrogen fertilization, respectively. The grain weight per panicle and panicle harvest index are potential variables to compose the multiple linear regression model. Multiple linear regression equations are efficient in the simulation of oat grain yield under the conditions of use of growth regulator, regardless of the N-fertilizer dose.
Produtividade da aveia por componentes
da panícula e regulador de crescimento
R E S U M O
O regulador de crescimento modifica a expressão do acamamento e componentes da panícula da aveia com reflexos na produtividade. O objetivo do estudo é a definição da dose ideal do regulador de crescimento em aveia para no máximo 5% de acamamento. Além disso, o estudo visa também identificar variáveis potenciais da panícula para compor o modelo de regressão linear múltipla e a simulação da produtividade de grãos nas condições de uso do regulador em reduzida, alta e muito alta fertilização com nitrogênio. O estudo foi conduzido em 2011, 2012 e 2013 em delineamento de blocos ao acaso com quatro repetições em fatorial 4 x 3, para doses de regulador (0, 200, 400 e 600 mL ha-1) e de N-fertilizante (30, 90 e 150 kg ha-1), respectivamente. As doses de 395, 450 e 560 mL ha-1 de regulador de crescimento são eficientes, com acamamento de plantas de aveia de no máximo 5%, em reduzida, alta e muito alta fertilização com nitrogênio, respectivamente. A massa de grãos da panícula e o índice de colheita da panícula são variáveis potenciais para compor o modelo de regressão linear múltipla. As equações de regressão linear múltipla são eficientes na simulação da produtividade de grãos de aveia nas condições de uso de regulador de crescimento independente da dose de N-fertilizante.
Key words:
Avena sativa
nitrogen trinexapac-ethyl
multiple linear regression
Palavras-chave:
Avena sativa
nitrogênio trinexapac-ethyl regressão linear múltipla
1 Universidade Regional do Noroeste do Estado do Rio Grande do Sul/Departamento de Ciências Exatas e Engenharias. Ijuí, RS. E-mail: marollia@yahoo.com.br
(Corresponding author); rdmantai@yahoo.com.br; anabrezolin@hotmail.com
2 Universidade Regional do Noroeste do Estado do Rio Grande do Sul/Departamento de Estudos Agrários. Ijuí, RS. E-mail: jagsfaem@yahoo.com.br;
eduardagze@gmail.com; darleilambrecht@yahoo.com
Introduction
Nitrogen (N) has strong influence on length, number and weight of grains in oat panicles, with direct reflexes on grain yield (Mantai et al., 2016). The increment in N along with favorable climatic conditions, despite significantly favoring grain yield, increase the vegetative growth of the plant, facilitating the occurrence of lodging (Silva et al., 2015). Lodging is directly related to the size of the plant and stem resistance, an event that can limit oat harvest and grain yield (Hawerroth et al., 2015). The use of growth regulators in the reduction of lodging has been a practice already employed in crotalaria (Kappes et al., 2011), rice (Alvarez et al., 2014) and wheat (Chavarria et al., 2015).
Dalchiavon et al. (2012), using multiple linear regression model, estimated rice grain yield incorporating to the model the number of panicles m-2, number of spikelets panicle-1 and
the weight of one thousand grains. Godoy et al. (2015), also studying soil attributes in rice, simulated grain yield based on the use of copper, nitrogen, iron and phosphorus by multiple linear regression. The relationships between oat panicle components and grain yield can favor the construction of yield simulation models in the more efficient planning of N management with the use of the regulator. The objective of this study was to define the ideal dose of the growth regulator for a maximum lodging of 5% in oat plants. In addition, it also aimed to identify potential variables associated with oat panicle through the use of the regulator to compose the multiple linear regression model and the simulation of grain yield, under conditions of low, high and very high N fertilization.
Material and Methods
The study was carried out at the field, in the agricultural years of 2011, 2012 and 2013, in the municipality of Augusto Pestana-RS, Brazil. The soil of the experimental area is classified as typic dystroferric Red Latosol and the climate of the region, according to Köppen’s classification, is Cfa, with hot summer without dry season. For the study, ten days before sowing, the soil was analyzed and showed the following chemical characteristics (Tedesco et al., 1995): pH = 6.2, P = 33.9 mg dm-3, K = 200 mg dm-3, OM = 3.0%, Al = 0 cmol
c dm -3, Ca =
6.5 cmolc dm-3 and Mg = 2.5 cmol c dm
-3. The plots consisted
of 5 rows with length of 5 m and spaced by 0.20 m, totaling an experimental unit of 5 m2. Sowing was performed with a
seeder-fertilizer on the vegetal cover of reduced C/N ratio (soybean/oat system). The seeds were subjected to germination and vigor tests in the laboratory to correct the desired density of 300 viable seeds m-2. Along the study, the fungicide
tebuconazole was applied at the dose of 0.75 L ha-1. In addition,
weeds were controlled with the herbicide metsulfuron-methyl at the dose of 4 g ha-1 and additional weedings, always when
necessary. The growth regulator was applied with a backpack sprayer at the constant pressure of 30 lb pol-2, by the compressed
CO2, using flat fan nozzles, in the stage between the 1st and 2nd
visible nodes of the oat stem.
The experimental design was randomized blocks with four replicates, following a 4 x 3 factorial scheme, for the sources
of variation doses of growth regulator (0, 200, 400 and 600 mL ha-1) and doses of N-fertilizer (source: urea) (30, 90
and 150 kg ha-1), respectively, totaling 48 experimental units.
Lodging was visually estimated and expressed in percentage in the stage close to grain harvest, following the methodology proposed by Moes & Stobbe (1991). The experiment was manually harvested by cutting the three central rows of each plot. Plants were threshed with a stationary threshing machine and sent to the laboratory to correct grain moisture to 13%, after weighing and estimation of grain yield per hectare (GY, kg ha-1). In the analysis of the oat panicle-type inflorescence,
20 panicles were randomly collected in each experimental unit and sent to the laboratory to correct grain moisture to 13%. Then, threshing was performed to determine the following components: panicle length (cm), number of spikelets per panicle (n), number of grains per panicle (n), panicle weight (g), grain weight per panicle (g) and panicle harvest index (g g-1) by the relationship between grain weight per panicle
and panicle weight.
After the assumptions of homogeneity and normality were met, through Bartlett’s tests, analysis of variance was performed to detect the main effects and the effects of interaction. The fit of the second-degree equation (GY = b0 ± b1x ± b2x2) for
grain yield (GY) was used to obtain the dose of the growth regulator (x) by the equation (x = – b1/2b2). The linear regression equation describing the behavior of the expression of the lodging percentage of oat plants by the increment in the doses of the growth regulator was fitted. This equation considered the possibility of plant lodging of 5%, a value added to the parameter “Y” of the equation, obtained by x = [(Y – b0)/(± b1)]. The potential variables for the multiple linear regression model were selected using the Stepwise technique. This procedure iteratively constructs a sequence of regression models through the addition and removal of variables using partial F statistics, according to the model:
(
)
(
)
R j 1 0
j
E j 1
QS | ,
F
QM x , x β β β =
where:
QSR - quadratic sum of the regression; and,
QME(xj, x1) - quadratic mean of the error for the model containing the variables x1 and xj.
The variables selected via Stepwise were used to compose the multiple linear regression equation in the simulation of oat grain yield. This equation is composed of two or more variables in the generation of an equation of the following type:
0 1 2 2 3 3 n n
y=b ±b x±b x ±b x ±b x
described in the matrix form as:
11 12 p1
1 0 1
21 22 p2
2 1 2
1n 2n pn
n n n
1 X X X Y
1 X X X Y
Y ; X ; ; and
M M M M
M M M
1 X X X Y
β ε
β ε
= = β = ε =
β ε
(1)
(2)
These matrices are used to obtain the values of the regression coefficients, being
The values of the ideal dose of the growth regulator were employed in the multiple linear regression model together with the mean values of the oat panicle components validated by the Stepwise technique. The analyses were performed using the computational program Genes.
Results and Discussion
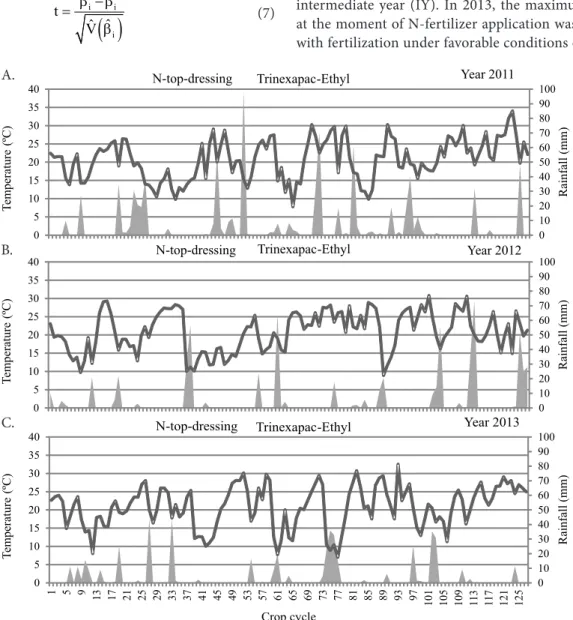
At the moment of N-fertilizer application in 2012, the mean of maximum temperature was higher (± 27 °C) in relation to 2011 and 2013 (Figure 1). N application was followed by more than 50 mm of rainfalls, a volume also observed close to grain harvest. These facts justify the reduced yield obtained (Table 1), characterizing 2012 as an unfavorable year (UY). In 2011, the lowest maximum temperature (± 12 °C) was observed close to the application of N-fertilizer in comparison to the other years. At the moment of fertilization, the soil had favorable moisture conditions due to the accumulation of rainfalls in the previous days (Figure 1). However, the large volume of rainfall during the cycle promoted shorter periods of insolation, reducing the efficiency of photosynthesis, which, combined with the means of grain yield (Table 1), classified 2011 as an intermediate year (IY). In 2013, the maximum temperature at the moment of N-fertilizer application was around 20 ºC, with fertilization under favorable conditions of soil moisture
(
)
1ˆ X ' X − X ' Y β =
and the variance of these coefficients is obtained by the covariance matrix of the vector of the regression coefficients:
( )
ˆ(
)
ˆ ˆ
Cov β = X ' X σ
(
)(
)
2
ˆ ˆ
Y X Y X
ˆ
n p 1
− β − β
σ =
− −
(4)
(5)
(6)
where:
n - number of equations; and, p - number of parameters.
The test of hypothesis verified H0 : βi = 0 vs Ha : βi ≠ 0, expressed by:
( )
i i
i
ˆ t
ˆ ˆ V β − β =
β (7)
Figure 1.Rainfall and maximum temperature in the oat cultivation cycle and moment of application of N-fertilizer and
growth regulator Trinexapac-Ethyl
Rainfall (mm)
Te
mperature
(ºC)
0 10 20 30 40 50 60 70 80 90 100
0 5 10 15 20 25 30 35 40
1 5 9 13 17 21 25 29 33 37 41 45 49 53 57 61 65 69 73 77 81 85 89 93 97
101 105 109 113 117 121 125
Crop cycle
Year 2013
Rainfall (mm) Maximum daily temperature (ºC)
Trinexapac-Ethyl N-top-dressing
Rainfall (mm)
Te
mperature
(ºC)
0 10 20 30 40 50 60 70 80 90 100
0 5 10 15 20 25 30 35
40 Year 2012
N-top-dressing Trinexapac-Ethyl
0 10 20 30 40 50 60 70 80 90 100
0 5 10 15 20 25 30 35 40
Year 2011
Rainfall (mm)
Te
mperature
(ºC)
N-top-dressing Trinexapac-Ethyl
A.
B.
(Figure 1). Although the total volume of rainfalls was the lowest one (Table 1), the adequate distribution of rainfall during the cycle (Figure 1) was decisive for a higher grain yield (Table 1), characterizing 2013 as a favorable year (FY).
According to Storck et al. (2014), the environmental conditions depending on site and year of cultivation decisively alter grain yield, and the agricultural year is the factor that most contributes to the variation in yield. In wheat and oat, the conditions of the cultivation year are predominantly defined by the distribution and volume of rainfall (Arenhardt et al., 2015). It should be pointed out that the excess of rainfalls in the grain filling stage contributes to plant lodging and reduction in the quality, reflecting in losses of yield (Prando et al., 2013). As reported, the variation of grain yield due to the year of cultivation is large, especially because of the distribution and volume of rainfall (Arenhardt et al., 2015). The variations between the years modify the efficiency of use of N in the elaboration of the production components and lodging (Mantai et al., 2015). Therefore, the simulation of grain yield per agricultural year does not contemplate the development of efficient models of expectation and prediction, which justifies the analysis of cumulative effect of the variability between favorable, intermediate and unfavorable years of cultivation in the polynomial regression models in the estimation of the ideal dose of the regulator and of multiple linear regression in the simulation of grain yield through oat panicle components.
In the estimation of the ideal dose of the growth regulator for grain yield, the second-degree equations were significant, regardless of the N-fertilizer dose, adjusted in 255, 300 and 320 mL ha-1 under conditions of low, high and very high
fertilization, respectively (Table 2). It should be pointed out that these doses do not guarantee grain yield and reduced lodging simultaneously, requiring the fit of the ideal dose through plant lodging. The estimate of the ideal dose of the regulator through plant lodging indicated linear regression equations, regardless of the doses of N-fertilizer (Table 2). The estimate of the ideal
dose of the regulator considered a maximum plant lodging of 5%, value added to the parameter “y” of each equation. Adjusted doses of 395, 450 and 560 mL ha-1 were obtained
under low, high and very high N fertilization, respectively, maintaining yields similar to those for the use of the optimal dose through grain yield.
In wheat, the increment in N doses favors vegetative growth and yield, promoting greater possibility of lodging (Penckowski et al., 2010). Chavarria et al. (2015) point out that, in wheat, doses between 400 and 500 mL ha-1 of regulator with
trinexapac-ethyl as the active principle are efficient to reduce lodging. Amabile et al. (2004), in barley, obtained adjusted dose of regulator of 500 mL ha-1. In rice, Nascimento et al. (2009)
obtained doses in the interval of 300 to 600 mL ha-1.
The identification of potential variables via Stepwise to compose the multiple linear regression model indicated the variables grain weight per panicle and panicle harvest index as significantly efficient, regardless of the dose of N-fertilizer
Table 1. Data of temperature and rainfall in the months and years of oat cultivation with means of grain yield and
classification of the agricultural years
Year Month Temperature °C Rainfall (mm) GYx
(kg ha-1) Class
Minimum Maximum Mean Mean of 25 years* Occurred
2011
May 10.5 22.7 16.6 149 100
3404 IY June 07.9 18.4 13.1 162 191
July 08.3 19.2 13.7 135 200 August 09.3 20.4 14.8 138 223 September 09.5 23.7 16.6 167 046 October 12.2 25.1 18.6 156 211
Total - - - 909 973
2012
May 11.1 24.5 17.8 149 020
2841 UY June 09.3 19.7 14.5 162 059
July 07.4 17.5 12.4 135 176 August 12.9 23.4 18.1 138 061 September 12.0 23.0 17.5 167 194 October 15.0 25.5 20.2 156 286
Total - - - 909 798
2013
May 10.0 22.6 16.3 149 108
4163 FY June 08.9 20.0 14.5 162 086
July 07.0 20.6 13.8 135 097 August 06.6 19.8 13.2 138 163 September 09.6 21.0 15.3 167 119 October 13.2 27.1 20.2 156 138
Total - - - 909 712
*Mean rainfall recorded in the months from May to October from 1982 to 2007; FY - Favorable year; UY - Unfavorable year; IY - Intermediate year; GY - Grain yield
Table 2. Estimate and simulation of the ideal dose of growth regulator in the restriction of plant lodging and grain yield
N-fertilizer (kg ha-1)
Equation P
(bix)
R2 Ideal dose
(mL ha-1) YE
Y = b0± b1x ± b2x2
Grain yield (kg ha-1) (2011 + 2012 + 2013)
30 3457 + 1.86x – 3.0 . 10-3x2 * 0.87 255 3736
90 3725 + 1.58x – 2.9 . 10-3x2 * 0.88 300 3938
150 3773 + 1.51x – 2.3 . 10-3x2 * 0.92 320 4014
Lodging (%) (2011 + 2012 + 2013) 30 24 – 0.05x * 0.87 395 (5) 90 59 – 0.12x * 0.82 450 (5) 150 75 – 0.16x * 0.88 560 (5)
Equation GY
(kg ha-1)
GY = b0± b1x ± b2x2
30 3457 + 1.86x – 3.0 . 10-3x2 * 0.87 395 3725
90 3725 + 1.58x – 2.9 . 10-3x2 * 0.88 450 3848
150 3773 + 1.51x – 2.3 . 10-3x2 * 0.92 560 3878 P(bix) - Parameter that measures the significance of the slope of the line; R² - Coefficient of
(Table 3). The mean values observed in these variables indicated reduction of expression by the increment in the growth regulator dose. The analysis involving also the growth regulator doses (0-600 mL ha-1) confirmed the possibility of
using the grain weight per panicle and panicle harvest index in simulations by multiple linear regression (Table 2). Therefore, the mean values of the potential variables (Table 3) together with the ideal dose of growth regulator in the reduction of lodging (Table 2) were used to simulate grain yield (Table 4). The identification of components that influence grain yield is decisive in the elaboration of simulation models (Leal et al., 2015). The use of the Stepwise technique can qualify the selection of potential variables in the simulation through multiple linear regression (Balbinot Júnior et al., 2005). In the simulation of grain yield through multiple regression in rice, Dalchiavon et al. (2012) identified the number of panicles, weight and number of spikelets panicle-1 and thousand-grain
weight as potential variables through the Stepwise technique. Also using this technique, in maize, Balbinot Júnior et al. (2005) defined ear weight, number of grains per row, number of rows per ear and number of plants and ears per area as appropriate in the simulation of grain yield through multiple linear regression.
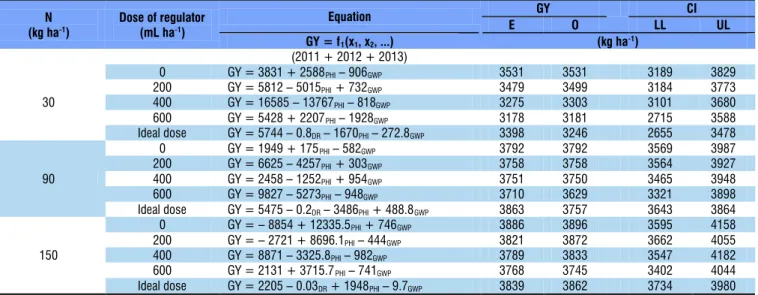
In Table 4, the simulation of grain yield indicated similarity between the estimated (E) and observed (O) values, being within the limits of the established confidence interval (CI). In the multiple model including potential components of the panicle and ideal dose of regulator, the results were satisfactory in the estimate of grain yield, with great proximity of expression of simulated and observed values.
The multiple linear regression was successfully used in species like wheat (Leilah & Khateeb, 2005), rice (Dalchiavon et al., 2012; Godoy et al., 2015), maize (Balbinot Júnior et al., 2005) and soybean (Mercante et al., 2010) for the simulation of grain yield and identification of potential variables of alteration by the management on the species.
Conclusions
1. The growth regulator doses of 395, 450 and 560 mL ha-1
are efficient, with maximum lodging of oat plants of 5%, under low, high and very high nitrogen fertilization, respectively.
2. The grain weight per panicle and panicle harvest index are potential variables to compose the multiple linear regression model.
GY - Grain yield (kg ha-1); GWP - Grain weight per panicle (g); PHI - Panicle harvest index (g g-1); Ideal dose - Dose of growth regulator for the estimate of maximum plant lodging of 0.05;
GYE - Estimated grain yield (kg ha-1); GY
O - Observed grain yield (kg ha -1); CI
LL - Lower limit of the confidence interval; CIUL - Upper limit of the confidence interval
N (kg ha-1)
Dose of regulator (mL ha-1)
Equation GY CI
E O LL UL
GY = f1(x1, x2, ...) (kg ha-1)
(2011 + 2012 + 2013)
30
0 GY = 3831 + 2588PHI– 906GWP 3531 3531 3189 3829
200 GY = 5812 – 5015PHI+ 732GWP 3479 3499 3184 3773
400 GY = 16585 – 13767PHI– 818GWP 3275 3303 3101 3680
600 GY = 5428 + 2207PHI– 1928GWP 3178 3181 2715 3588
Ideal dose GY = 5744 – 0.8DR– 1670PHI– 272.8GWP 3398 3246 2655 3478
90
0 GY = 1949 + 175PHI– 582GWP 3792 3792 3569 3987
200 GY = 6625 – 4257PHI+ 303GWP 3758 3758 3564 3927
400 GY = 2458 – 1252PHI+ 954GWP 3751 3750 3465 3948
600 GY = 9827 – 5273PHI– 948GWP 3710 3629 3321 3898
Ideal dose GY = 5475 – 0.2DR– 3486PHI+ 488.8GWP 3863 3757 3643 3864
150
0 GY = – 8854 + 12335.5PHI+ 746GWP 3886 3896 3595 4158
200 GY = – 2721 + 8696.1PHI– 444GWP 3821 3872 3662 4055
400 GY = 8871 – 3325.8PHI– 982GWP 3789 3833 3547 4182
600 GY = 2131 + 3715.7PHI– 741GWP 3768 3745 3402 4044
Ideal dose GY = 2205 – 0.03DR+ 1948PHI– 9.7GWP 3839 3862 3734 3980 Table 4. Multiple linear regression for the estimate of oat grain yield through the components of the panicle and growth regulator doses
GWP - Grain weight per panicle; PHI - Panicle harvest index; Ideal dose - Dose of growth regulator for the estimate of lodging lower than 0.05 (mL ha-1); *Significant at 0.05 probability of
error by the F-probability; nsNot significant; Means followed by the same letter in the row do not differ significantly at 0.05 probability of error by the Scott-Knott test
N
(kg ha-1) Source of variation
Stepwise model (2011+2012+2013) / Dose of Regulator (mL ha-1)
0 200 400 600 (0-600)
30
Regression * * * * *
GWP (g) A 2.70* B 2.50* C 2.30* D 2.06* 2.39* PHI (g g-1) A 0.84* A 0.83* A 0.83* B 0.78* 0.82*
Ideal dose (mL ha-1) ns ns ns ns 395*
90
Regression * * * * *
GWP (g) A 2.90* B 2.62* C 2.43* D 2.00* 2.5* PHI (g g-1) A 0.88* A 0.86* A 0.82* B 0.80* 0.84*
Ideal dose (mL ha-1) ns ns ns ns 450*
150
Regression * * * * *
GWP (g) A 2.36* A 2.30* B 2.26* C 2.00* 2.23* PHI (g g-1) A 0.89* A 0.87* B 0.86* B 0.84* 0.86*
Ideal dose (mL ha-1) ns ns ns ns 560* Table 3. Identification of potential variables via Stepwise and the respective means to compose the multiple linear
3. The multiple linear regression equations are efficient in the simulation of oat grain yield under conditions of use of growth regulator, regardless of the N-fertilizer dose.
Literature Cited
Alvarez, R. de C. F.; Crusciol, C. A. C. Nascente, A. S. Produtividade de arroz de terras altas em função de reguladores de crescimento. Revista Ceres, v.61, p.42-49, 2014. https://doi.org/10.1590/S0034-737X2014000100006
Amabile, R. F.; Minella, E.; Valente, C. M. W.; Serra, D. D. da. Efeito do regulador de crescimento trinexapac-ethyl em cevada cervejeira irrigada em áreas de cerrado do Distrito Federal. Planaltina: Embrapa Cerrado, 2004. 14p. Boletim de pesquisa e desenvolvimento, 120
Arenhardt E. G.; Silva, J. A. G. da; Gewehr, E.; Oliveira, A. C.de; Binelo, M. O.; Valdiero, A. C.; Gzergorczick, M. E.; Lima, A. R. C. de. The nitrogen supply in wheat cultivation dependent on weather conditions and succession system in southern Brazil. African Journal of Agricultural Research, v.10, p.4322-4330, 2015. https://doi.org/10.5897/AJAR2015.10038
Balbinot Júnior, A. A.; Backes, R. L.; Alves, A. C.; Ogliari, J. B.; Fonseca, J. A. Contribuição de componentes de rendimento na produtividade de grãos em variedades de polinização aberta de milho. Revista Brasileira Agrociência, v.11, p.161-166, 2005. Chavarria, G.; Rosa, W. P. da; Hoffmann, L.; Durigon, M. R. Regulador de
crescimento em plantas de trigo: Reflexos sobre o desenvolvimento vegetativo, rendimento e qualidade de grãos. Revista Ceres, v.62, p.583-588, 2015. https://doi.org/10.1590/0034-737X201562060011 Dalchiavon, F. C.; Carvalho, M. de P. e; Coletti, A. J.; Caione, G.;
Silva, A. F.; Andreotti, M. Correlação linear entre componentes da produção e produtividade do arroz de terras altas em sistema de plantio direto. Ciências Agrárias, v.33, p.1629-1642, 2012. https://doi.org/10.5433/1679-0359.2012v33n5p1629
Godoy, S. G. de; Stone, L. F.; Ferreira, E. P. de B.; Cobucci, T.; Lacerda, M. C. Correlação entre produtividade do arroz no sistema semeadura direta e atributos do solo. Revista Brasileira de Engenharia Agrícola e Ambiental, v.19, p.119-125, 2015. https:// doi.org/10.1590/1807-1929/agriambi.v19n2p119-125
Hawerroth, M. C.; Silva, J. A. G. da; Souza, C. A.; Oliveira, A. C. de; Luche. H. de S.; Zimmer, C. M.; Hawerroth, F. J.; Schiavo, J.; Sponchiado, J. C. Redução do acamamento em aveia-branca com uso do regulador de crescimento etil-trinexapac. Pesquisa Agropecuária Brasileira, v.50, p.115-125, 2015. https://doi. org/10.1590/S0100-204X2015000200003
Kappes C.; Arf, O.; Arf, M. V.; Gitti, D. de C.; Alcalde, A. M. Uso de reguladores de crescimento no desenvolvimento e produção de crotalária. Pesquisa Agropecuária Tropical, v.41, p.508-518, 2011. https://doi.org/10.5216/pat.v41i4.10768
Leal, A. J. F.; Miguel, E. P.; Baio, G. H. R.; Neves, D. de C.; Leal, U. A. S. Redes neurais artificiais na predição da produtividade de milho e definição de sítios de manejo diferenciado por meio de atributos do solo. Bragantia, v.74, p.436-444, 2015. https://doi. org/10.1590/1678-4499.0140
Leilah, A. A.; Al-Khateeb, S. A. Statistical analysis of wheat yield under drought conditions. Journal of Arid Environments, v.61, p.483-496, 2005. https://doi.org/10.1016/j.jaridenv.2004.10.011 Mantai, R. D.; Silva, J. A. G. da; Arenhardt, E. G.; Sausen, A. T. Z. R.;
Binello, M. O.; Bianchi, V.; Silva, D. R. da; Bandeira, L. M. The dynamics of relation oat panicle with grain yield by nitrogen. American Journal of Plant Sciences, v.7, p.17-27, 2016. https:// doi.org/10.4236/ajps.2016.71003
Mantai, R. D.; Silva, J. A. G. da; Sausen, A. T. Z. R.; Costa, J. S. P.; Fernandes, S. B. V. A eficiência na produção de biomassa e grãos de aveia pelo uso do nitrogênio. Revista Brasileira de Engenharia Agrícola e Ambiental, v.19, p.343-349, 2015. https:// doi.org/10.1590/1807-1929/agriambi.v19n4p343-349
Mercante, E.; Lamparelli, R. A. C.; Uribe-Opazo, M. A.; Rocha, J. V. Modelos de regressão lineares para estimativa de produtividade da soja no oeste do Paraná, utilizando dados espectrais.Engenharia Agrícola, v.30, p.504-517, 2010.
Moes, J.; Stobbe, E. H. Barley treated with athephon: I. Yield components and net grain yield. Agronomy Jounal, v.83, p.86-90, 1991. https:// doi.org/10.2134/agronj1991.00021962008300010021x
Nascimento, V.; Arf, O.; Silva, M. G.; Binotti, F. F. S.; Rodrigues, R. A. F; Alvarez, R. C. F. Uso do regulador de crescimento etil-trinexapac em arroz de terras altas. Bragantia, v.68, p.921-929, 2009. https:// doi.org/10.1590/S0006-87052009000400012
Penckowski, L. H.; Zagonel, J.; Fernandes, E. C. Qualidade industrial do trigo em função do trinexapac-ethyl e doses de nitrogênio. Ciência e Agrotecnologia, v.34, p.1492-1499, 2010. https://doi. org/10.1590/S1413-70542010000600020
Prando, A. M.; Zucareli, C.; Fronza, V.; Oliveira, F. Á. de; Oliveira Júnior, A. Características produtivas do trigo em função de fontes e doses de nitrogênio. Pesquisa Agropecuária Tropical, v.43, p.34-41, 2013. https://doi.org/10.1590/S1983-40632013000100009 Silva, J. A. G.; Arenhardt, E. G.; Krüger, C. A. M. B.; Lucchese,
O. A.; Metz, M.; Marolli, A. A expressão dos componentes de produtividade do trigo pela classe tecnológica e aproveitamento do nitrogênio. Revista Brasileira de Engenharia Agrícola e Ambiental, v.19, p.27-33, 2015.
Storck, L.; Cargnelutti Filho, A.; Guadagnin, J. P. Análise conjunta de ensaios de cultivares de milho por classes de interação genótipo x ambiente. Pesquisa Agropecuária Brasileira, v.49, p.163-172, 2014. https://doi.org/10.1590/S0100-204X2014000300002