Revista Brasileira de
Engenharia Agrícola e Ambiental
Campina Grande, PB, UAEA/UFCG – http://www.agriambi.com.br
v.20, n.12, p.1095-1100, 2016
Nitrogen efficiency in oats on grain yield with stability
José A. G. da Silva
1, Constantino J. Goi Neto
1, Sandra B. V. Fernandes
1,
Rubia D. Mantai
2, Osmar B. Scremin
2& Rafael Pretto
1DOI: http://dx.doi.org/10.1590/1807-1929/agriambi.v20n12p1095-1100
A B S T R A C T
Nitrogen (N) is the nutrient most absorbed by the oat crop. Unfavorable climate conditions decrease its efficiency, generating instability and reduction in yield. The objective of this study was to improve N use efficiency in oat grain yield by the economic value of the product and of the input and by models that scale the stability, considering systems of succession of high and reduced residual-N release in favorable and unfavorable years for cultivation. The study was conducted in the years 2013, 2014 and 2015 in two systems of succession (soybean/oat, maize/oat) in randomized blocks with eight replicates, using the N-fertilizer doses of 0, 30, 60 and 120 kg ha-1. The N-fertilizer dose for maximum economic efficiency
in oats should be considered based on the meteorological trends of the cultivation year. N use optimization by models that determine the stability is an innovative proposal to increase fertilization efficiency on the yield. The N-fertilizer dose of 60 kg ha-1 promotes
greater efficiency with predictability and yield, regardless of the agricultural year and the system of succession.
A eficiência do nitrogênio em aveia
na produtividade de grãos com estabilidade
R E S U M O
O nitrogênio é o nutriente mais absorvido pela aveia; em condições climáticas desfavoráveis diminui sua eficiência, gerando redução e instabilidade na produtividade. Objetivou-se, no estudo, a melhoria da eficiência de uso do nitrogênio na produtividade de grãos de aveia pelo valor econômico do produto e do insumo e por modelos que dimensionam a estabilidade considerando sistemas de sucessão de alta e reduzida liberação de N-residual em anos favoráveis e desfavoráveis ao cultivo. O estudo foi conduzido nos anos de 2013, 2014 e 2015 em dois sistemas de sucessão (soja/aveia; milho/aveia) em delineamento experimental de blocos casualizados com oito repetições, para as doses de N-fertilizante de 0, 30, 60 e 120 kg ha-1. A dose de N-fertilizante pela máxima eficiência econômica em
aveia deve ser considerada observando-se as tendências meteorológicas do ano de cultivo. A otimização de uso do nitrogênio por modelos que determinam a estabilidade é uma proposta inovadora para aumentar a eficiência de adubação sobre a produtividade. A dose de 60 kg ha-1 de N-fertilizante promove a maior eficiência com previsibilidade e produtividade,
independente de ano agrícola e do sistema de sucessão.
Key words:
Avena Sativa C/N
predictability biometric models optimization
Palavras-chave:
Avena Sativa C/N
previsibilidade modelos biométricos otimização
1 Universidade Regional do Noroeste do Estado do Rio Grande do Sul/Departamento de Estudos Agrários. Ijuí, RS. E-mail: [email protected];
[email protected]; [email protected]; [email protected]
2 Universidade Regional do Noroeste do Estado do Rio Grande do Sul/Departamento de Ciências Exatas e Engenharias. Ijuí, RS. E-mail: [email protected]
(Corresponding author); [email protected]
Introduction
Nitrogen (N) is decisive to maximize crop yield. However, the expectation for high yields, especially under unfavorable climatic conditions for cultivation, can increase the doses of mineral fertilization, increasing the production costs and making the crop economically unviable (Foulkes et al., 2009; Barraclough et al., 2010). Furthermore, it can cause environmental damages through nitrate leaching or ammonia volatilization in the use of the fertilizer under limiting conditions of rainfall or heat (Ma et al., 2010; Arenhardt et al., 2015). The type of cover on the soil can reduce the losses through leaching or volatilization and N use efficiency (Ma et al., 2010; Viola et al., 2013). Therefore, genetic characteristics, climatic conditions and cultivation techniques act on the N use efficiency of cereal crops (Prando et al., 2013; Mantai et al., 2015).
The strong variation of yield is associated with the great variability of the cultivation conditions, and the agricultural year is the factor with highest contribution (Storck et al., 2014). Years with favorable and unfavorable weather and the conditions involving the systems of succession of high and reduced residual-N release alter N availability and use efficiency by the plant, leading to greater instability of yield (Espindula et al., 2010; Arenhardt et al., 2015). Hence, studies aiming at higher N use efficiency can qualify the recommendations and provide technologies that are more adjusted, economically viable and of lower environmental impact, which are decisive conditions in the search for a more sustainable agriculture (Parry et al., 2011; Prando et al., 2013).
Given the above, this study aimed to improve N use efficiency and grain yield of oats by the economic value of the product and of the input and by models that scale the stability, considering systems of succession of high and reduced residual-N release in favorable and unfavorable years for cultivation.
Material and Methods
The study was carried out in the years 2013, 2014 and 2015 in the municipality of Augusto Pestana-RS, Brazil (28° 26’ 30’’S; 54° 00’ 58’’ W). The soil of the experimental area is classified as typic dystroferric Red Latosol and the climate of the region, according to Köppen’s classification, is Cfa, with hot summer without dry season. Prior to sowing, soil analysis was performed at the depth of 0.20 m and the characteristics of the area were obtained as the mean of the years: i) maize/oat system (Clay = 52%; OM = 2.9%; pH = 6.2; P = 40.8 mg dm-3;
K = 239.7 mg dm-3; Al = 0 cmol
c dm
-3; Ca = 6.5 cmol
c dm
-3 and
Mg = 2.5 cmolc dm-3) and; soybean/oat system (Clay = 54%;
OM = 3.2%; pH = 6.5; P = 26.9 mg dm-3; K = 179.5 mg dm-3; Al
= 0 cmolc dm-3; Ca = 6.3 cmol
c dm
-3 and Mg = 2.7 cmol
c dm
-3).
Sowings were performed according to the recommendation of cultivation, between May 15 and June 30, using a seeder-fertilizer. Each plot consisted of 5 rows with length of 5 m and spaced by 0.20 m, to form the experimental unit of 5 m2.
The seeds were subjected to germination and vigor tests at the laboratory in order to correct the density to 400 viable seeds m-2 of the oat cultivar ‘Brisasul’, which has short cycle
and small size. The plots received applications of the fungicide tebuconazole, with commercial name of FOLICUR® CE, at the
dose of 0.75 L ha-1. Weeds were controlled with the herbicide
metsulfuron-methyl, with commercial name of ALLY®, at the
dose of 4 g ha-1.
The experiments received 80 kg ha-1 of P
2O5, 60 kg ha -1 of K
2O
and 10 kg ha-1 of N fertilizer at sowing (except for the control
experimental unit), while the rest of the N was applied as top-dressing to contemplate the studied doses. The experiments were conducted in two systems of succession of high and reduced residual-N release under the conditions of soybean/oat and maize/oat, respectively. In each system, the experimental design was randomized blocks with eight replicates, for the N fertilizer doses of 0, 30, 60 and 120 kg ha-1, with urea as the source,
applied as top-dressing in the V4 phenological stage (fourth leaf expanded). Plants were manually harvested by cutting the three central rows of each plot, which were then threshed with a stationary harvester and sent to the laboratory to correct grain moisture to 13% and estimate grain yield.
After meeting the assumptions of homogeneity and normality through the Bartlett’s test, analysis of variance was performed to detect the main effects and effects of interaction. Based on this information, the Scott-Knott test of means was performed and a second-degree equation (GY = b0 ± b1x ± b2x2) was fitted in order to estimate the maximum technical
efficiency (MTE = -b1/2b2) and maximum economic efficiency (MEE = (t/w)b1/2b2) of grain yield. For maximum economic efficiency, the model includes the price of the product (w) and the price of the input (t). The utilized values represent mean prices practiced in 2013, 2014 and 2015 in the Northwest region of Rio Grande do Sul, with input (N-fertilizer) price of R$ 1.20 kg-1 and product (oat) price of R$ 0.40 kg-1.
The grain yield stability analysis was performed according to the models of Wricke (1965) and Eberhart & Russell (1966). The Wricke’s model, called ecovalence (ωi), was estimated based on the following equations:
(
)
n 2
i ij
j 1
DN
= ω =
∑
(
DN)
ij=Yij−Yi−Yj−Ywhere:
Yij - mean of the dose “i” in the environment “j”; Yi - mean of the dose “i” in all environments; Yj - mean of the environment “j” for all doses; and, Y - mi - overall mean.
According to this methodology, stability is considered when there are reduced values of ωi or ωi (%).
The model of Eberhart & Russell (1966) is based on the linear regression:
2 ij i i j ij ij
Y =B0 +B1 I +S +E
where:
Yij - mean of the dose “i” in the environment “j”; (1)
(2)
B0i - overall mean of the dose “i”;
B1i - linear regression coefficient whose estimate represents the response of the dose “i” to the variation of the environment “j”;
Ij - codified environmental index; S2
ij - regression deviations; and,
Eij - mean experimental error.
The stability of the N fertilizer application dose was obtained using the parameter S2
ij. A condition is considered
as stable when S2
ij = 0 and unstable when S 2
ij ≠ 0. It should
be pointed out that the models considered the combined effect of the agricultural years and the systems of succession, strengthening the estimation of the stability analysis. The mean values of grain yield associated with the data of temperature and rainfall, in the oat cultivation cycle, were the classification criteria of favorable, intermediate and unfavorable years for cultivation. The analyses were performed using the computational program Genes.
Results and Discussion
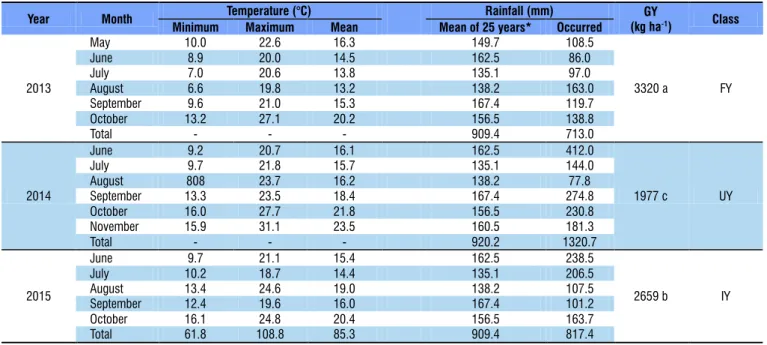
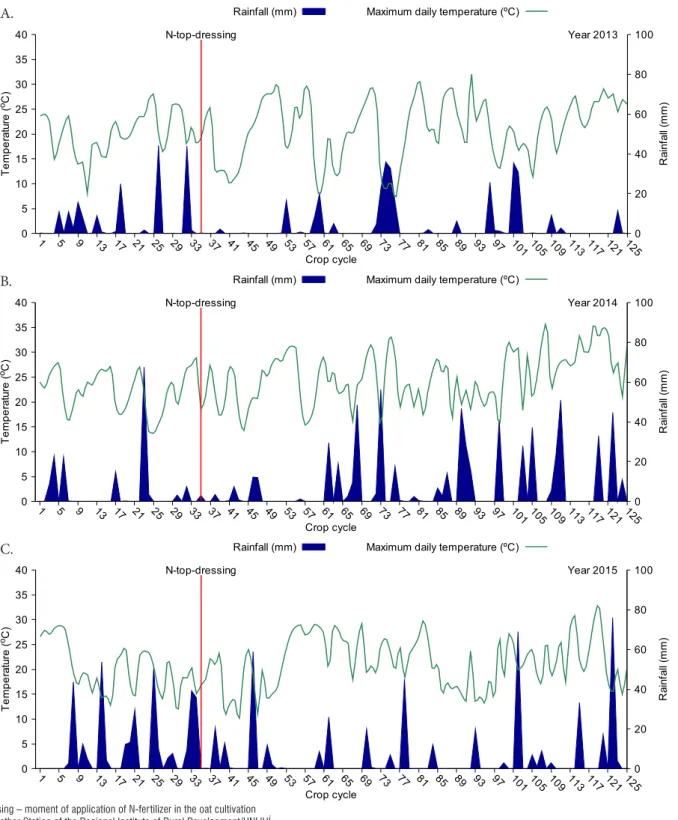
In the year of 2013, the maximum temperature at the moment of N-fertilizer application was close to 20 ºC, with favorable soil moisture conditions due to rainfalls that occurred in previous days, above 40 mm (Figure 1A). In this condition (Table 1) and although the total volume of rainfalls was the lowest one in relation to the historical average, the adequate distribution of rainfall along the cycle (Figure 1A) was responsible for the highest mean grain yield, characterizing 2013 as favorable year (FY). In 2014 (Figure 1B), the moment of N-fertilizer application indicated higher maximum temperature (± 28 oC) in relation to the other years, which
facilitates greater loss of nutrient through volatilization and reduction in plant efficiency, for increasing the respiration rate. Although there were adequate soil moisture conditions due to
the rainfalls before and after fertilization, the high frequency and the volume from 60 days of emergence on promoted long periods of lower insolation and with high temperatures, a positive condition that extended from the grain filling stage until grain harvest. The high volume of rainfall in relation to the historical average, especially in the final stage of filling and maturation, was decisive to reduce crop yield (Table 1), characterizing 2014 as an unfavorable year (UY) for cultivation.
In the year of 2015 (Figure 1C), the maximum temperature close to the N-fertilizer application was the lowest one (± 17 °C), in relation to the previous years, and the soil was under adequate moisture conditions due to the rainfalls that occurred in previous days. Although the volume of rainfalls and lower maximum temperature favored the vegetative stage, higher temperatures in relation to 2013 were recorded in the grain filling stage and with increased rainfall close to harvest. Although the volume of rainfalls is close to the historical average (Table 1), the large volume of rainfalls may have facilitated N leaching; thus, higher yields were not achieved. Therefore, meteorological data combined with the reasonable yield characterize 2015 as intermediate year (IY).
Regardless of the N-fertilizer dose and system of succession (Table 2), the year of 2013 showed high grain yield, while 2015 indicated intermediate yield and 2014 the lowest values, justifying the established proposal of classification. Comparing N-fertilizer doses in the system of high residual-N release (soybean/oat), the years classified as favorable (2013) and intermediate (2015) resulted in similar mean grain yields in the treatments with 60 and 120 kg ha-1 of the fertilizer.
This condition raises the hypothesis that the favoring of the cultivation year, combined with the conditions of high residual-N release, allows to reach high yields with significant reduction in the use of N-fertilizer. On the other hand, in the unfavorable year (2014), although the higher N-fertilizer dose showed higher response on grain yield, the small increment in each point of increase of the nutrient shows that the obtained
* Mean rainfall from May to October from 1991 to 2015; FY – Favorable year; UY – Unfavorable year; IY – Intermediate year; GY – Grain yield; Means followed by the same letter constitute a statistically homogeneous group, at 0.05 probability level by the Scott-Knott test
Year Month Temperature (°C) Rainfall (mm) GY
(kg ha-1) Class Minimum Maximum Mean Mean of 25 years* Occurred
2013
May 10.0 22.6 16.3 149.7 108.5
3320 a FY
June 8.9 20.0 14.5 162.5 86.0
July 7.0 20.6 13.8 135.1 97.0
August 6.6 19.8 13.2 138.2 163.0
September 9.6 21.0 15.3 167.4 119.7
October 13.2 27.1 20.2 156.5 138.8
Total - - - 909.4 713.0
2014
June 9.2 20.7 16.1 162.5 412.0
1977 c UY
July 9.7 21.8 15.7 135.1 144.0
August 808 23.7 16.2 138.2 77.8
September 13.3 23.5 18.4 167.4 274.8
October 16.0 27.7 21.8 156.5 230.8
November 15.9 31.1 23.5 160.5 181.3
Total - - - 920.2 1320.7
2015
June 9.7 21.1 15.4 162.5 238.5
2659 b IY
July 10.2 18.7 14.4 135.1 206.5
August 13.4 24.6 19.0 138.2 107.5
September 12.4 19.6 16.0 167.4 101.2
October 16.1 24.8 20.4 156.5 163.7
Total 61.8 108.8 85.3 909.4 817.4
Figure 1. Data of rainfall and maximum temperature in oat cycle 0
5 10 15 20 25 30 35 40
1 5 9 13 17 21 25 29 33 37 41 45 49 53 57 61 65 69 73 77 81 85 89 93 97 10
1 105 109 113 117 121 125
0 20 40 60 80 100
N-top-dressing Year 2015
Te
mp
er
atur
e(
oC)
Ra
in
fa
ll
(m
m)
Crop cycle
Rainfall (mm) Maximum daily temperature (ºC) 0
5 10 15 20 25 30 35 40
1 5 9 13 17 21 25 29 33 37 41 45 49 53 57 61 65 69 73 77 81 85 89 93 97 10
1 105 109 113 117 121 125
0 20 40 60 80 100
N-top-dressing Year 2014
Te
mp
er
atur
e(
oC)
Ra
in
fa
ll
(m
m)
Crop cycle
Rainfall (mm) Maximum daily temperature (ºC) 0
5 10 15 20 25 30 35 40
1 5 9 13 17 21 25 29 33 37 41 45 49 53 57 61 65 69 73 77 81 85 89 93 97 10
1 105 109 113 117 121 125
0 20 40 60 80 100
N-top-dressing Year 2013
Te
mp
er
atur
e(
oC)
Ra
in
fa
ll
(m
m)
Crop cycle
Rainfall (mm) Maximum daily temperature (ºC)
A.
B.
C.
return does not compensate the large amount of the input required, which makes the management unviable due to its high cost, suggesting the use of lower doses.
In the system of lower residual-N release (maize/oat), the favorable year for cultivation (2013) showed linear increase in grain yield due to the N-fertilizer doses, with more expressive results at 120 kg ha-1 (Table 2). However, the expected yield
with N dose of 120 kg ha-1 in this system, with soil OM content
from 2.6 to 5.0% and maize as the preceding crop, would be higher than 4 t ha-1. These results show that the stability in oat
grain yield by the use of N-fertilizer had already been achieved, although the conditions of the cultivation year were favorable and without the need of high N doses. In the unfavorable
Table 2. Mean values of grain yield (GY) in oat per nitrogen dose in the years and systems of cultivation
Year Nitrogen doses – GY (kg ha -1)
0 30 60 120
Soybean/oat system
2013 (FY) C 3041 a B 3734 a A 4039 a A 3979 a 2014 (UY) D 1482 c C 2217 c B 2488 c A 2821 c 2015 (IY) C 2265 b B 2980 b A 3265 b A 3440 b
Maize/oat system
2013 (FY) D 1882 a C 2974 a B 3294 a A 3617 a 2014 (UY) C 966 c B 1740 c A 2009 c A 2099 c 2015 (IY) D 1465 b C 2351 b A 2670 b A 2860 b
Means followed by the same letters, uppercase in the row and lowercase in the column, constitute a statistically homogeneous group by the Scott-Knott test at 0.05 probability level; FY – Favorable year; IY – Intermediate year; UY – Unfavorable year
year (2014) and intermediate year (2015), the N-fertilizer dose of 60 kg ha-1 promoted results similar to those caused
by the highest dose of the input. However, under the more limiting conditions of cultivation in the unfavorable year, due to climatic conditions and systems of succession of reduced residual-N release, the investments in fertilization should be minimized.
According to the stability analysis by the combined effects of cultivation years and systems of succession, the model of Eberhart & Russell evidenced a predictable behavior in the yield with the N doses of 30 and 60 kg ha-1, with
non-significant values of S2
ij, corroborating the results obtained
for phenotypical stability through the lowest values of ecovalence by the Wricke’s model. Analyzing the models of Eberhart & Russell and Wricke together, the N dose of 60 kg ha-1 evidenced higher yield with stability, potentiating N use
optimization, regardless of favorable or unfavorable year or system of succession.
Although the stability analysis has been more employed in the identification of genotypes with predictable behavior, it has been used in the definition of management technologies that ensure efficiency and stability in cultivation systems (Krüger et al., 2011; Silva et al., 2015). Studies of this nature were conducted in wheat for the identification of the best period of N application in favorable and unfavorable years (Arenhardt et al., 2015) and for the definition of the best plant arrangement on harvest uniformity and grain yield of canola (Krüger et al., 2016).
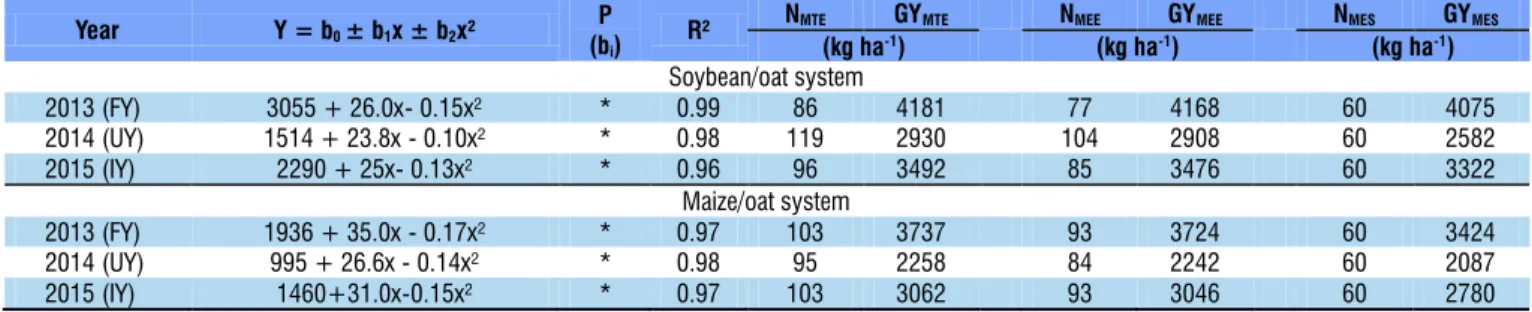
In the soybean/oat system (Table 3), the values of the maximum technical efficiency of N use for grain yield were obtained with 86 (2013 = favorable year), 119 (2014 = unfavorable year) and 96 kg ha-1 (2015 = intermediate year).
In the unfavorable year, the large amount of the input to achieve maximum technical efficiency did not compensate the reduced return of the capital invested in grain yield, making the cultivation unviable and, possibly, maximizing losses of the nutrient. On the other hand, in the favorable agricultural year, there was a large reduction of fertilization with high yield. This condition indicates the need for advances in N fertilization, combining the conventional fertilization recommendation with models of meteorological prediction.
The dimensioning of N dose through the maximum economic efficiency showed a significant increase in efficiency with reduction in the dose of the nutrient, compared with the technical efficiency, exhibiting values of N-fertilizer use
of 77 (2013), 104 (2014) and 85 kg ha-1 (2015). In addition,
these values allowed yields similar to those obtained through the maximum technical efficiency (Table 3). Therefore, it represents a reduction in N-fertilizer between 9 and 15 kg ha-1.
More-relevant results were obtained in N use considering the maximum efficiency of stability (MES), obtained with the N dose of 60 kg ha-1 (Table 4). This condition allowed, in favorable,
unfavorable and intermediate years, an expressive reduction in N use to 26, 59 and 36 kg ha-1 in relation to the maximum
technical efficiency and with little significant reduction in grain yield.
The maximum technical efficiency (MTE) of N use on grain yield in the maize/oat system (Table 3) was obtained with 103 kg ha-1 in the favorable year (2013) and intermediate year (2015),
and with 95 kg ha-1 in the unfavorable year (2014). Although
the values of N use through the maximum technical efficiency were the same in 2013 and 2015, the response of grain yield was higher in the favorable year. The N use through the maximum economic efficiency decreased for the N dose of 93 kg ha-1 in
the favorable (2013) and intermediate (2015) cultivation years and for the N dose of 84 kg ha-1 in the unfavorable year (2014).
Therefore, it represents a reduction in N-fertilizer between 9 and 11 kg ha-1 and with yields close to the maximum technical
efficiency. In the analysis of N use through models that scale the predictable behavior at maximum efficiency of stability (MES) with maximum grain yield was obtained with the N dose of 60 kg ha-1 (Table 4), sharply reducing the use of the
nutrient in relation to the maximum technical and economic efficiencies. This condition allowed a reduction in N-fertilizer of 35 to 43 kg ha-1 in comparison to the maximum technical
efficiency and with similar yields (Table 3). The obtained results show the possibility of optimization of N-fertilizer
FY = favorable year; UY – Unfavorable year; IY – Intermediate year; P – Significance of the angular parameter of the regression equation at 0.05 probability level; R2 – Determination coefficient; NMTE - Nitrogen dose at the maximum technical efficiency; NMEE - Nitrogen dose at the maximum economic efficiency; NMES – Nitrogen dose at the maximum efficiency of stability; GYMTE - Grain yield through the maximum technical efficiency; GYMEE - Grain yield through the maximum economic efficiency; GYMES – Grain yield through the maximum efficiency of stability
Year Y = b0± b1x ± b2x² P (bi) R²
NMTE GYMTE NMEE GYMEE NMES GYMES (kg ha-1) (kg ha-1) (kg ha-1) Soybean/oat system
2013 (FY) 3055 + 26.0x- 0.15x² * 0.99 86 4181 77 4168 60 4075 2014 (UY) 1514 + 23.8x - 0.10x² * 0.98 119 2930 104 2908 60 2582 2015 (IY) 2290 + 25x- 0.13x² * 0.96 96 3492 85 3476 60 3322
Maize/oat system
2013 (FY) 1936 + 35.0x - 0.17x² * 0.97 103 3737 93 3724 60 3424 2014 (UY) 995 + 26.6x - 0.14x² * 0.98 95 2258 84 2242 60 2087 2015 (IY) 1460+31.0x-0.15x² * 0.97 103 3062 93 3046 60 2780
Table 3. Regression in the estimation of maximum technical efficiency (MTE) and maximum economic efficiency (MEE) and maximum efficiency of stability (MES) by the nitrogen (N) and estimation of grain yield
Means followed by the same letter do not differ by the Scott-Knott test at 0.05 probability level; Ecovalence (ωi) - Wricke; Regression - Eberhart & Russell; * Significant at 0.05 probability level by F test; ns Not significant; S2
ij - Regression standard deviation; GY - grain yield; R2 - determination coefficient; by the F test (H
o: S 2
ij = 0)
N doses (kg ha-1)
GY (kg ha-1)
Ecovalence Regression
ωi ωi (%) S2ij R2
(2013+2014+2015+ maize/oat system + soybean/oat system) 0 1843 c 741089 46.8 41370* 0.92 30 2666 b 29511 1.8 -3253ns 0.99
60 2957 a 66008 4.1 -2199ns 0.99
120 3129 a 745059 47.1 39023* 0.89
use, improving the traditional criteria of recommendation. In addition, considering the analysis of costs of product and input and the meteorological trends of the cultivation year, the use of the stability analysis represents, therefore, a new alternative for fertilization dimensioning intended for N use optimization.
Conclusions
1. The N-fertilizer dose through the maximum economic efficiency in oat must be considered based on the meteorological trends of the cultivation year.
2. The optimization of nitrogen use through models that scale the stability is an innovative proposal to increase fertilization efficiency.
3. The dose of 60 kg ha-1 of the N-fertilizer promotes
greater efficiency with predictability and yield, regardless of the agricultural year and system of succession.
Acknowledgments
To the National Council for Scientific and Technological Development (CNPq), the Rio Grande do Sul Research Support Foundation (FAPERGS), the Regional University of the Northwest of the state of Rio Grande do Sul (UNIJUÍ) and the Federal University of Pelotas (UFPel), for providing the resources to conduct this research and for the scholarships of Scientific and Technological Initiation and Research Productivity.
Literature Cited
Arenhardt, E. G.; Silva, J. A. G. da; Gewehr, E.; Oliveira, A. C. de; Binello, M. O.; Valdiero, A. C.; Goi Neto, C. J.; Krysczun, D. K.; Cardoso, A. M.; Lima, A. R. C. de. The nitrogen supply in wheat cultivation dependent on weather conditions and succession system in southern Brazil. African Journal of Agricultural Research, v.10, p.4322-4330, 2015. http://dx.doi.org/10.5897/ AJAR2015.10038
Barraclough, P. B.; Howarth, J. R.; Jones, J.; Lopez-Bellido, R.; Parmar, S.; Shepherd, C. E.; Hawkesford, M. J. Nitrogen efficiency of wheat: Genotypic and environment variation and prospects for improvement. European Journal of Agronomy, v.33, p.1-11, 2010. http://dx.doi.org/10.1016/j.eja.2010.01.005
Eberhart, S. A.; Russell, W. A. Stability parameters for comparing varieties. Crop Science, v.6, p.36-40, 1966. http://dx.doi. org/10.2135/cropsci1966.0011183X000600010011x
Espindula, M. C.; Rocha, V. S.; Souza, L. T. de; Souza, M. A. de; Grossi, J. A. S. Efeitos de reguladores de crescimento na elongação do colmo de trigo. Acta Scientiarum Agronomy, v.32, p.109-116, 2010. http://dx.doi.org/10.4025/actasciagron.v32i1.943
Foulkes, M. J.; Hawkesford, M. J.; Barraclough, P. B.; Holdsworth, M. J.; Kerr, S.; Kightley, S.; Shewry, P. R. Identifying traits to improve the nitrogen economy of wheat: Recent advances and future prospects. Field Crops Research, v.114, p.329-342, 2009. http://dx.doi.org/10.1016/j.fcr.2009.09.005
Krüger, C. A. M. B.; Medeiros, S. L. P.; Silva, J. A. G. da; Dalmago, G. A.; Valentini, A. P. F.; Wagner, J. F. Rapeseed population arrangement defined by adaptability and stability parameters. Revista Brasileira de Engenharia Agrícola e Ambiental. v.20, p.36-41, 2016. http:// dx.doi.org/10.1590/1807-1929/agriambi.v20n1p36-41
Krüger, C. A. M. B.; Silva, J. A. G. da; Medeiros, S. L. P.; Dalmago, G. A.; Gaviraghi, J. Herdabilidade e correlação fenotípica de caracteres relacionados à produtividade de grãos e à morfologia da canola. Pesquisa Agropecuária Brasileira, v.46, p.1625-1632, 2011. Ma, B. L.; Wu, T. Y.; Tremblay, N.; Deen, W.; McLaughlin, N. B.;
Morrison, M. J.; Stewart, G. On-farm assessment of the amount and timing of nitrogen fertilizer on ammonia volatilization. Agronomy Journal, v.102, p.134-144, 2010. http://dx.doi. org/10.2134/agronj2009.0021
Mantai, R. D.; Silva, J. A. G. da; Sausen, A. T. Z. R.; Costa, J. S. P.; Fernandes, S. B. V.; Ubessi, C. A eficiência na produção de biomassa e grãos de aveia pelo uso do nitrogênio. Revista Brasileira de Engenharia Agrícola e Ambiental, v.19, p.343-349, 2015. http:// dx.doi.org/10.1590/1807-1929/agriambi.v19n4p343-349 Parry, M. A. J.; Reynolds, M.; Salvucci, M. E.; Raines, C.; Andralojc,
J. Raising yield potential of wheat. II. Increasing photosynthetic capacity and efficiency. Journal of Experimental Botany, v.62, p.453-467, 2011. http://dx.doi.org/10.1093/jxb/erq304
Prando, A. M.; Zucarelli, C.; Fronza, V.; Oliveira, F. A.; Oliveira Júnior, A. Características produtivas do trigo em função de fontes e doses de nitrogênio. Pesquisa Agropecuária Tropical, v.43, p.34-41, 2013. http://dx.doi.org/10.1590/S1983-40632013000100009
Silva, J. A. G.; Wohlenberg, M. D.; Arenhardt, E. G.; Oliveira, A. C.; Mazurkievicz, G.; Müller, M.; Arenhardt, L. G.; Binello, M. O.; Arnold, G.; Pretto, R. Adaptability and stability of yield and industrial grain quality with and without fungicide in Brazilian oat cultivars. American Journal of Plant Sciences, v.6, p.1560-1569, 2015. http://dx.doi.org/10.4236/ajps.2015.69155
Storck, L.; Cargnelutti Filho, A.; Guadagnin, J. P. Análise conjunta de ensaios de cultivares de milho por classes de interação genótipo x ambiente. Pesquisa Agropecuária Brasileira, v.49, p.163-172, 2014. http://dx.doi.org/10.1590/S0100-204X2014000300002
Viola, R.; Benin, G.; Cassol, L. C.; Pinnow, C.; Flores, M. F.; Bornhofen, E. Adubação verde e nitrogenada na cultura do trigo em plantio direto. Bragantia, v.72, p.20-28, 2013. http://dx.doi. org/10.1590/S0006-87052013005000013