Recebido para publicação em 21/6/2006 Aceito para publicação em 30/7/2007 (001770)
1Universidade Federal de Goiás – UFG, Departamento de Ciências Biológicas,
Campus de Jataí – CAJ, Rod. Br. 364, Km 192, Zona Rural, CP 03, CEP 75800-000, Jataí - GO, Brasil,
E-mail: smarianos@uol.com.br
2Universidade Federal de Goiás – UFG, Campus de Jataí – CAJ,
Rod. Br. 364, Km 192, Zona Rural, CP 03, CEP 75800-000, Jataí - GO, Brasil
3Universidade Estadual de Goiás – UEG,
Departamento de Tecnologia em Alimentos, Unidade Universitária de Jataí, Av. 31 de maio, s/n, setor Epaminondas, CEP 75800-000, Jataí - GO, Brasil, E-mail: fmdsmds@uol.com.br
*A quem a correspondência deve ser enviada
Abstract
Sugar cane juice containing 12% (w.w –1) of total reducing sugars and 0.0 to 5.0 mmol of nickel L–1, with pH ranging from 3.5 to 6.5, was inoculated with Fleischmann’s yeast (Saccharomyces cerevisiae) (10% w.w –1). Six hours after fermentation, the yeast’s cellular viability and trehalose content were evaluated. The resulting must was centrifuged and the raw yeast was analyzed by atomic absorption spectroscopy to evaluate the intracellular levels of calcium, copper, iron, magnesium, manganese, nickel, phosphorus, potassium, sulfur and zinc. The intracellular levels of iron, magnesium and calcium were affected and the yeast’s susceptibility to nickel was enhanced by the decrease in pH. The yeast’s growth was not affected by nickel at high pH, but the toxic effects of nickel were potentiated at low pH.
Keywords: nickel; mineral composition; Saccharomyces cerevisiae; yeast.
Resumo
O presente trabalho teve por finalidade estudar o acúmulo e os efeitos do níquel na composição mineral da levedura Saccharomyces cerevisiae Fleichmann fermentando mosto de caldo de cana com contaminações controladas, em níveis subtóxicos, do citado metal. O mosto esterelizado (120 °C/20 minutos), com 12% de açúcares redutores totais (ART) e quatro níveis de pH (3,5; 4,5; 5,5 e 6,5), foi acrescido com o sal cloreto de níquel (NiCl2.6H2O), resultando em seis níveis de contaminações (0,0; 0,1; 0,5; 1,0; 2,0 e 5,0 mmol Ni.L–1) e 24 tratamentos. A inoculação do mosto foi executada com fermento de panificação (10% p.p–1). Depois de 6 horas de fermentação, as leveduras foram obtidas por centrifugação, para posterior análise da viabilidade celular, dos teores de trealose, bem como dos teores celulares de níquel, fósforo, potássio, cálcio, magnésio, enxofre, cobre, ferro, manganês e zinco. O níquel parece influenciar nos teores intracelulares de ferro, magnésio e cálcio, sendo que a toxidade do níquel foi potencializa com o decréscimo do pH.
Palavras-chave: composição mineral; levedura; níquel; Saccharomyces cerevisiae.
Effects of nickel on the mineral composition of
Fleischmann’s yeast (
Saccharomyces cerevisiae
)
Efeitos do niquel na composição mineral da levedura Fleischmann (Saccharomyces cerevisiae)
Samuel MARIANO-DA-SILVA
1*, Joys Dias de Assis BRAIT
2, Luiz Henrique Poleto ANGELONI
2,
Fabiana Maria de Siqueira MARIANO-DA-SILVA
3, César Augusto Oliveira LEITE
2, Paula BRAGA
21 Introduction
Several studies have focused on the toxicity of heavy
met-als, particularly the toxicity associated with the phenomenon
of bioaccumulation
34. Several heavy metals are essential to
the metabolism of microorganisms, since they are required in
numerous enzymatic reactions and protein compositions. On
the other hand, metal elements can be highly toxic and may
disturb the microorganic metabolism.
Heavy metals comprise about 40 elements, including
nickel, which has a minimum density of 6.0 g.cm
–3 2. Nickel is
the 28
thelement in the periodic table, with an atomic weight of
58.71 g.cm
–3and specific density of 8.91
1. This metal, which
is usually present in soils next to mineral lodes or in deposits
of industrial residues (e.g., galvanoplastic residues containing
nickel), is easily absorbed by plants
10,21,23,37. Nickel can even
percolate into agricultural soils through server slime, through
discarded cement waste, accumulated wastes from burned
fossil fuel and urban garbage, among others
1,2,36. The average
world values of nickel found in agricultural soils range from
20 to 40 ppm. However, MALAVOLTA
22found 127 ppm in a
structured Terra Roxa (purple soil) in the state of São Paulo.
The fermentation process normally employed in Brazil
is the traditional Melle-Boinot method. Batch fermentation
with total cell recycling keeps the cellular concentration high,
increasing the alcohol content due to the low consumption of
sugar for cell growth
19,20. Due to the phenomenon of
bioac-cumulation, yeasts that grow by fermentation in the presence
of heavy metals, even in subtoxic concentrations, may present
higher cellular concentrations of these metals than those found
in must
24,26-28,32. This problem is believed to be aggravated when
associated with yeast recycling
25.
Nickel absorption by yeast depends on the sugar and
me-tabolism, considering that dead cells do not absorb metal
14. After
absorption, the cations are transported through the cell
mem-brane, probably by cation transporting proteins, to the cytosol,
where they are linked to metalloproteins in the vacuole
6,32,35,45.
Heavy metals may damage the yeast cell membrane by
fluidizing it, which causes potassium channels to open and its
intracellular level to decrease
4,9,16.
Accumulation of heavy metals in the vacuole may cause
cal-cium displacement from the vacuole, increasing free Ca
+2ions
in the cytosol, which may cause the potassium exit channels
to open, with loss of potassium to the surrounding medium
4.
Mg
+2ions are also displaced from the vacuole, passing to the
may also act directly on the SH- groups of the potassium exit
channels, causing them to open and resulting in loss of
potas-sium
4. H
+-ATPase damage is also reportedly caused by heavy
metals in yeast
15.
A key component in the plasmatic membrane is H
+-ATPase,
which creates an electrochemical gradient through the
mem-brane that controls the transportation of a variety of inorganic
and organic solutes, such as sugar
8,11.
This enzyme is clearly responsible for many physical,
chemical and nutritional facts, and is usually a stress
indica-tor, including the stress caused by heavy metals
4. Heavy metals
may also affect the sugar entering the yeast cell when they are
linked to the anionic bindings of the plasmatic membrane.
Sev-eral authors
31,42,43have reported that sugar transport into the
yeast cell is inhibited by heavy metals and this inhibition may
be involved in these metals’ (e.g., nickel, cobalt and cadmium)
interaction with the polyphosphate membrane, causing a
con-formational change in some active sites, which would render
binding with the sugar unviable.
2 Materials and methods
2.1 Material preparation
All reusable items (glass, quartz, polyethylene, Teflon,
etc.) were prepared for use by washing with detergent in ultra
pure water and soaking for 4 hours in a mixture of nitric acid,
hydrochloric acid and water (1 + 2 + 9), followed by rinsing
with ultra pure water and heat drying
29.
2.2 Yeast strain
Blocks of pressed yeast were stored at 3 °C
1 for later
use in the fermentation experiment.
2.3 Preparation of sugar-cane juice
For the fermentation, the juice was sterilized (1 ATM/20
minutes/121 °C) and diluted with sterilized distilled water to
12% of TRS (total reducing sugars). The pH was adjusted to
3.5; 4.5; 5.5 and 6.5, according to the treatment, through the
addition of NaOH 0.1 M or H
2SO
40.1 M. Nickel chloride salt
(NiCl
2.6H
2O) was then added to the musts, resulting in six levels
of contamination (0.0, 0.1, 0.5, 1.0, 2.0 and 5.0 mmol Ni L
-1)
and 24 treatments.
2.4 Fermentation experiment
Fermentation batches were prepared with 250 mL of
ster-ilized (autoclaved at 1 ATM, 120 °C, 20 minutes) sugar cane
must growth medium (diluted with distilled water to 16 °Brix)
and 25 g of yeast (uw) in 500 mL Erlenmeyer flasks, which
were capped with aluminum foil and placed in a thermostatic
oven at 30 °C
1. Fermentation, which was estimated by weight
loss (CO
2) measured at 1 hour intervals, was concluded in
6 hours, at which point the fermented product was separated
by centrifugation and analyzed.
2.5 Viable count, budding rate and bacterial
contamination
After 18 hours of fermentation, 0.5 mL of each yeast sample
was tested. The samples were diluted, erythrosine stained and
evaluated for yeast viability, budding rate and bacterial
contami-nation (rod type cells) by microscopic analysis, as described
by AMORIM et al
3.
2.6 Yeast trehalose
Trehalose was extracted from 60 mg of washed cells
(fresh wt) with 2 mL of 0.5 mol L
-1trichloroacetic acid in ice
bath for 20 minutes (the suspension was shaken frequently),
centrifuged
40,41, and 0.2 mL of each supernatant was subjected
to anthrone reaction, according to Brin
7.
2.7 Nickel, potassium, calcium, magnesium, copper,
manganese, and zinc quantification
Approximately 0.5 g of yeast sample was mineralized by
2:5:3 sulfuric acid (H
2SO
4), nitric acid (HNO
3) and perchloric
acid (HClO
4) digestion at 220 °C for 3 hours. The mineral
con-tent was measured by atomic absorption spectrophotometry,
with atomization by acetylene flame, in a Perkin Elmer model
Analyst 100 atomic absorption spectrophotometer
44.
2.8 Sulfur quantification
Approximately 0.5 g of yeast sample was mineralized by 2:1
hydrogen peroxide (H
2O
2) and perchloric acid (HClO
4) digestion
at 220 °C for 3 hours. The mineralized sample was dissolved
1:100 in distilled water, after which 1 mL of 6 M chloric acid
(HCl) and 0.5 g of barium chloride (BaCl
2) were added. After
5 minutes, the color was measured in the spectrophotometer
at 420 nm
30.
2.9 Phosphorus quantification
Approximately 0.5 g of yeast sample was mineralized by
2:1 hydrogen peroxide (H
2O
2) and perchloric acid (HClO
4)
digestion at 220 °C for 3 hours. The mineralized sample was
dissolved 1:100 in distilled water, and 2 mL of 0.25%
am-monium metavanadate (NH
4VO
3) and 2 mL of 5% ammonium
molybdate ([NH
4]
2MoO
4) were added. After 15 minutes, the color
was measured with a colorimeter at 660 nm
30.
2.10 Nitrogen quantification
Approximately 0.5 g of yeast sample was mineralized by
2:1 hydrogen peroxide (H
2O
2) and perchloric acid (HClO
4)
di-gestion at 220 °C for 3 hours. The nitrogen content was then
determined by the Microkjeldahl method
30.
2.11 Statistical analysis
The variables were subjected to variance analyses (F test),
following a factorial delineation in crossed model, in triplicate.
The averages were compared by Tukey’s multiple comparison
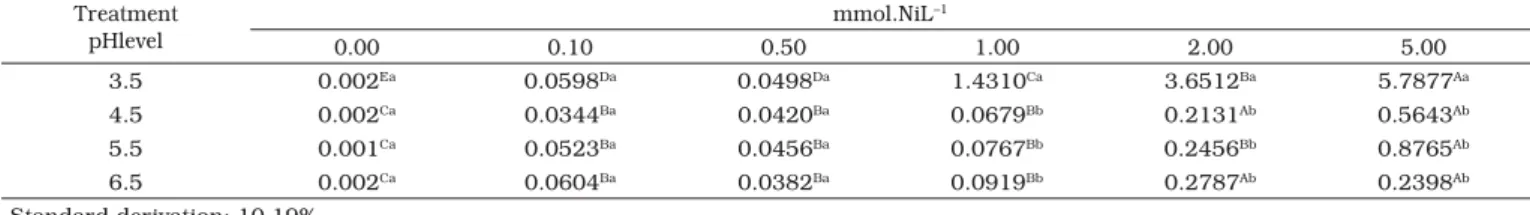
Table 1. Nickel yeast content (mmol.kg –1 in dw). Treatment
pHlevel
mmol.NiL–1
0.00 0.10 0.50 1.00 2.00 5.00
3.5 0.002Ea 0.0598Da 0.0498Da 1.4310Ca 3.6512Ba 5.7877Aa
4.5 0.002Ca 0.0344Ba 0.0420Ba 0.0679Bb 0.2131Ab 0.5643Ab
5.5 0.001Ca 0.0523Ba 0.0456Ba 0.0767Bb 0.2456Bb 0.8765Ab
6.5 0.002Ca 0.0604Ba 0.0382Ba 0.0919Bb 0.2787Ab 0.2398Ab
Standard derivation: 10.19%
The averages followed by the same letters (capital or small) on the same line or same column did not differ from each other, according to the F and Tukey tests at 1% of confidence.
Table 2. Potassium yeast content (mol.kg –1 in dw). Treatment
pH level
mmol.Ni L–1
0.00 0.10 0.50 1.00 2.00 5.00
3.5 0.3666 0.3922 0.3623 0.3581 0.3666 0.3922
4.5 0.4178 0.4369 0.4497 0.4455 0.4860 0.3964
5.5 0.3800 0.3368 0.3154 0.3261 0.3794 0.3730
6.5 0.3218 0.3282 0.3517 0.3538 0.3581 0.3304
Standard derivation: 17.67%
According to the variance test (F test), the averages did not differ from each other at 1% of confidence.
Table 3. Calcium yeast content (mmol.kg –1 in dw). Treatment
pH level
mmol.Ni L–1
0.00 0.10 0.50 1.00 2.00 5.00
3.5 27.86Aa 26.61ABa 25.87Ba 23.70Ca 22.25Cda 21.83Da
4.5 22.87Ab 19.65Bb 18.50Bb 17.26BCb 17.26BCb 17.05Db
5.5 21.21Ab 18.71Bb 17.26Bb 14.55BCc 14.97Cc 12.48Cc
6.5 17.05Ac 18.71Bb 17.05Ab 16.22Ab 13.72Bc 10.19Bc
Standard derivation: 3.25%
The averages followed by the same letters (capital or small) on the same line or same column did not differ from each other, according to the F and Tukey tests at 1% of confidence.
Table 4. Magnesium yeast content (mmol.kg –1 in dw). Treatment
pH level mmol.Ni L
–1
0.00 0.10 0.50 1.00 2.00 5.00
3.5 56.91Aa 52.80Ba 53.83Ba 51.09Ba 50.40Ba 46.29Ca
4.5 52.80Ab 50.40Ab 51.77Ab 50.06Aa 42.46Bb 45.26Ba
5.5 52.46Ab 48.34Bc 47.32Bc 44.91Cc 46.29Bb 40.11Db
6.5 46.29Ac 47.66Ac 48.34Ac 47.31Ab 45.94Ab 39.43Bb
Standard derivation: 6.39%
The averages followed by the same letters (capital or small) on the same line or same column did not differ from each other, according to the F and Tukey tests at 1% of confidence.
3 Results and discussion
Tables 1 to 11 show the results obtained for nickel,
phos-phorus, potassium, calcium, magnesium, sulfur, copper, iron,
manganese and zinc content.
The potassium content remained constant in the
differ-ent treatmdiffer-ents (Table 2), despite the slightly higher contdiffer-ent in
pH 4.5 level. Possibly, the use of higher levels of nickel would
lead to massive losses of potassium caused by heavy metal, as
reported by another author
4.
The treatments with different concentrations of nickel
interfered in the cell contents of calcium, copper and iron cell
(Table 3, 5 and 8). The pH affected nickels toxicity, because
the higher the pH the lower the intracellular calcium, copper
and iron content.
The decrease in intracellular iron content indicates that
nickel inhibited the ferrireductase enzyme responsible for iron
absorption. This finding was previously reported in cellular
treatment with cadmium
17. As BLACKWELL and TOBIN
5and
ASSMANN et al.
4reported for cadmium, nickel affected the
in-tracellular magnesium and calcium contents. The accumulation
of heavy metals in vacuoles probably caused displacement of
the calcium and magnesium from their vacuolar storage sites,
increasing the Ca
+2and Mg
+2concentrations in the cytosol.
Since the plasmatic membrane is damaged by nickel, causing
it to become fluidized, the transportation channels are opened,
leading to a reduction of the intracellular level of free ions
4.
The cellular contents of manganese, zinc, nitrogen,
sul-fur and phosphorus did not vary in the different treatments
(Tables 9, 10, 11, 7 and 6, respectively).
The pH influenced nickel absorption, since higher nickel
absorption occurred in pH 3.5 than in pH 6.5 (Table 1). At
higher levels of pH, nickel oxide and hydroxide are formed,
decreasing the free ions available for interaction with the yeast
13Table 7. Sulfur yeast content (mmol.kg –1 in dw). Treatment
pH level
mmol.Ni L–1
0.00 0.10 0.50 1.00 2.00 5.00
3.5 60.79 82.14 92.53 86.82 92.01 86.14
4.5 77.42 76.94 81.62 79.54 83.18 86.82
5.5 71.74 69.66 79.02 79.02 83.70 86.82
6.5 73.30 71.74 79.02 70.18 77.98 76.42
Standard derivation: 15.45%
According to the variance test (F test), the averages did not differ from each other at 1% of confidence.
Table 8. Copper yeast content (mmol.kg –1 in dw). Treatment
pH level mmol.Ni L
–1
0.00 0.10 0.50 1.00 2.00 5.00
3.5 0.4144Aa 0.4196Aa 0.4931Aa 0.4983Aa 0.5036Aa 0.3987Aa
4.5 0.1731Ab 0.1416Ab 0.1259Ab 0.1259Ab 0.1469Ab 0.1416Ab
5.5 0.1311Ab 0.1626Ab 0.1206Ab 0.1206Ab 0.1311Ab 0.1154Ab
6.5 0.1574Ab 0.1574Ab 0.1469Ab 0.1574Ab 0.1679Ab 0.1469Ab
Standard derivation: 15.98%
The averages followed by the same letters (capital or small) on the same line or same column did not differ from each other, according to the F and Tukey tests at 1% of confidence.
Table 9. Manganese yeast content (mmol.kg –1 in dw). Treatment
pH level
mmol.Ni L–1
0.00 0.10 0.50 1.00 2,00 5,00
3.5 0.3017 0.3017 0.4389 0.4252 0.3977 0.3840
4.5 0.2880 0.2606 0.2469 0.2331 0.2743 0.2743
5.5 0.3154 0.2743 0.2469 0.2743 0.2880 0.2469
6.5 0.3154 0.3292 0.3429 0.2880 0.3566 0.2194
Standard derivation: 19.29%
According to the variance test (F test), the averages did not differ from each other at 1% of confidence.
Table 10. Zinc yeast content (mmol.kg –1 in dw). Treatment
pH level mmol.Ni L
-1
0.00 0.10 0.50 1.00 2.00 5.00
3.5 3.9354 3.8334 3.7671 3.5938 3.7213 3.4307
4.5 3.3950 3.2472 3.3033 3.3644 3.5479 3.4409
5.5 3.3186 3.3287 3.3491 3.2574 3.3899 3.3236
6.5 3.5989 3.6499 3.6601 3.5581 3.6856 3.3848
Standard derivation: 7.90%
According to the variance test (F test), the averages did not differ from each other at 1% of confidence. Table 6. Phosphorus yeast content (mol.kg –1 in dw).
Treatment
pH level mmol.Ni L
–1
0.00 0.10 0.50 1.00 2.00 5.00
3.5 0.3901 0.3794 0.3820 0.3886 0.3654 0.3390
4.5 0.3948 0.3417 0.3662 0.3605 0.3820 0.3874
5.5 0.3605 0.3901 0.3767 0.3632 0.3901 0.3901
6.5 0.3767 0.3901 0.3632 0.3901 0.3767 0.3632
Standard derivation: 5.96%
According to the variance test (F test), the averages did not differ from each other at 1% of confidence. Table 5. Iron yeast content (mmol.kg –1 in dw).
Treatment
pH level mmol.Ni L
–1
0.00 0.10 0.50 1.00 2.00 5.00
3.5 14.98Aa 13.46Aa 15.40Aa 14.33Aa 13.70Aa 10.12Aa
4.5 6.03Ab 6.26Ab 7.30Ab 6.51Ab 6.10Ab 5.79Ab
5.5 5.68Ab 5.88Ab 6.66Ab 5.68Ab 5.03Ab 4.40Ab
6.5 4.86Ab 4.84Ab 4.26Ab 4.60Ab 4.73Ab 4.47Ab
Standard derivation: 13.21%
Table 14. Trehalose yeast content (%). Treatment
pH level
mmol.Ni L–1
0.00 0.10 0.50 1.00 2.00 5.00
3.5 3.50Aa 2.70Aa 1.23Bc 0.87Bc 0.01Cb 0.02Cb
4.5 3.90Aa 3.93Aa 2.10Bb 1.21Cb 0.02Db 0.01Db
5.5 3.93Aa 3.88Aa 3.67Aa 2.99Aa 3.00Aa 2.97Aa
6.5 3.81Aa 3.43Aa 3.55Aa 3.12Aa 3.05Aa 3.00Aa
Standard derivation: 7.21%
The averages followed by the same letters (capital or small) on the same line or same column did not differ from each other, according to the F and Tukey tests at 1% of confidence. Table 12. Viability rate (%).
Treatment pH level
mmol.Ni L–1
0.00 0.10 0.50 1.00 2.00 5.00
3.5 88.34Ab 82.98Abb 76.12Bb 72.60Bc 70.21Bd 66.90Cd
4.5 99.12Aa 95.56ABa 89.00Bb 84.29BCb 80.78Cc 76.90Cc
5.5 99.77Aa 98.92Aa 95.56ABa 90.67Bb 89.39Bb 87.89Bb
6.5 99.56Aa 99.20Aa 99.67Aa 98.90Aa 99.54Aa 98.07Aa
Standard derivation: 19.60%
The averages followed by the same letters (capital or small) on the same line or same column did not differ from each other, according to the F and Tukey tests at 1% of confidence.
Table 13. Budding rate (%). Treatment
pH level mmol.Ni L
–1
0.00 0.10 0.50 1.00 2.00 5.00
3.5 20.89 19.20 19.43 21.12 19.84 20.98
4.5 21.90 18.16 20.98 21.34 21.32 20.94
5.5 20.93 20.67 21.00 19.56 18.76 21.50
6.5 21.90 19.65 19.67 18.99 20.01 19.87
Standard derivation: 17.78%
According to the variance test (F test), the averages did not differ from each other at 1% of confidence.
Tables 12, 13 and 14 show the results obtained for
viabil-ity, budding rate and trehalose content. The viability rate and
trehalose contents proved to be strongly correlated (Tables 12
and 14), indicating the decreasing viability as the pH decreased
and the nickel content increased. The budding rate did not vary
significantly in the different treatments (Table 13). GUTIERREZ
et al.
12reported results with a similar tendency as those shown
here, differing only in the maintenance of cellular viability in
pH 4.0 and contamination with 5.44 mmol of Ni L
-1. In addition,
those authors reported a visible decrease in trehalose content,
which is congruent with the data reported in this paper.
Trehalose is associated mainly with carbohydrate storage
in fungus during the nonproliferation period
39. LILLIE and
PRINGLE
18demonstrated that yeast survival depends on the
stored trehalose level.
Figures 1 to 4 show CO
2production in the different
treat-ments. No difference was found in the fermentative velocity in the
treatments with pH 5.5 and 6.5 (Figures 3 and 4). At pH 3.5 and
Table 11. Nitrogen yeast content (g.100 g –1 in dw). Treatment
pH level mmol.Ni L
–1
0.00 0.10 0.50 1.00 2.00 5.00
3.5 6.41 6.63 7.17 7.22 7.34 6.55
4.5 6.90 6.63 6.46 6.45 6.79 6.67
5.5 6.20 6.95 6.52 6.03 6.30 6.46
6.5 6.02 6.03 6.26 6.33 6.23 5.72
Standard derivation: 4.32%
According to the variance test (F test), the averages did not differ from each other at 1% of confidence.
4.5, the fermentative velocity was lower in the treatments with
nickel than for the control (Figure 1 and 2), showing a tendency
to decrease as the metal concentration increased. This behavior
may be attributed to the high availability of free nickel ions
13and be correlated with the absorbed nickel content (Table 1),
viability rate and trehalose content (Tables 12 and 14).
The slowest fermentation rate (Figures 3 and 4) and
low-est viability rate (Figure 12) in the presence of nickel and low
pH can be explained by the decrease in sugar absorption by
yeast cells, due to the complexation of the phosphate groups
of the plasmatic membrane by nickel, as proposed by
VAN-STEVENINCK
42and VAN-STEVENINCK e BOOIJ
43.
4 Conclusions
The
S. cerevisiae
yeast accumulated nickel at all the tested
Nickel seems to influence the intracellular content of iron,
magnesium and calcium, since the results obtained here were
similar to those reported in the literature for other heavy
met-als. The trehalose values were strongly correlated with yeast
viability and growth, since this parameter reflects the
physi-ological stress to which the yeast is subjected.
References
1. ADRIANO, D. C. Trace Elements in the Terrestrial Environment. New York: Springer-Verlang, 1986. 533 p.
2. ALLOWAY, B. I. Heavy Metals in Soils. 2. ed. New York: John Wiley, 1995. 450 p.
3. AMORIM, H. V. et al. Processos de fermentação alcoólica: seu controle e monitoramento. Piracicaba: FERMENTEC, 1989. 145 p.
4. ASSMANN, S.; SIGLER, K.; HÖFER, M. Cd2+ induced damage to yeast plasma membrane and its alleviation by Zn2+: studies on Schizosaccharomyces pombe and reconstituted plasma membrane vesicles. Archive of Microbiology, v. 165, n. 4, p. 279-284, 1996.
5. BLACKWEEL, K. J.; TOBIN, J. M. Cadmium accumulation and its effects on intracellular ion pools in a brewing strain of Saccharomyces cerevisiae. Journal of Industrial Microbiology & Biotechnology, v. 23, n. 3, p. 204-208, 1999.
6. BRADY, D.; DUNCAN, J. R. Bioacumulation of metal cations by Saccharomyces cerevisiae. Applied Microbiology and Biotechnology, v. 41, n. 1, p. 149-159, 1994.
7. BRIN, M. Tranketalose: clinical aspects. Methods in Enzymology, v. 9, p. 506-514, 1966.
8. BROCK, T. D. et al. Biology of Microorganisms. 7. ed. New Jersey: Prentice Hall, 1994. 909 p.
9. GADD, G. M.; MOWLL, J. L. The relationship between cadmium uptake, potassium release and viability in Saccharomyces cerevisiae.FEMS Microbiology Letters, v. 16, n. 1, p. 45-48, 1983.
10. GOUVÊA, L. C. Estudo da compostabilidade do lodo de esgoto e avaliação da distribuição química de metais pesados no 0 2 4 6 8 10 12 14 16 18 20
0 1 2 3 4 5 6 7
Time (hours) CO 2 pro d uce d (g r)
0.0 mmol of Ni 0.1 mmol of Ni 0.5 mmol of Ni
1.0 mmol of Ni 2.0 mmol of Ni 5.0 mmol of Ni
Figure 2. CO2 produced in pH 4.5.
0 2 4 6 8 10 12 14 16 18 20
0 1 2 3 4 5 6 7
Time (hours) CO 2 p ro duce d (g r)
0.0 mmol of Ni 0.1 mmol of Ni 0.5 mmol of Ni
1.0 mmol of Ni 2.0 mmol of Ni 5.0 mmol of Ni
Figure 3. CO2 produced in pH 5.5.
Figure 1. CO2 produced in pH 3.5. 0 2 4 6 8 10 12 14 16 18 20
0 1 2 3 4 5 6 7
Time (hours) CO 2 p ro duce d (g r)
0,0 mmol of Ni 0.1 mmol of Ni 0.5 mmol of Ni
1.0 mmol of Ni 2.0 mmol of Ni 5.0 mmol of Ni
0 2 4 6 8 10 12 14 16 18 20
0 1 2 3 4 5 6 7
Time (hours) CO 2 p ro duce d (g r)
0.0 mmol of Ni 0.1 mmol of Ni 0.5 mmol of Ni
1.0 mmol of Ni 2.0 mmol of Ni 5.0 mmol of Ni
em atenuar a toxidade. Ciência e Tecnologia de Alimentos, v. 24, n. 1, p. 16-22, 2004.
27. MARIANO-da-SILVA, S.; PRADO-FILHO, L. G. Acúmulo de Cádmio por Saccharomyces cerevisiae em caldo de cana-de-açúcar contaminado com acetato de cádmio. Scientia Agricola, v. 56, n. 2, p. 427-431, 1999.
28. ______. Acúmulo de cádmio por Saccaromyces cerevisiae fermentando mosto de caldo-de-cana. Ciência e Tecnologia de Alimentos, v. 18, n. 4,p. 410-413, 1998.
29. McDANIEL, W. Sample preparation procedure for spectrochemical determination of total recoverable elements in biological tissues. In: SMOLEY, C. K.Methods for the determination of metals in environmental samples. Boca Ranton: CRC Press, 1992. cap. 3, p.613-625.
30. MIYAZAWA, M. et al. Análises químicas de tecido vegetal. In. SILVA, F. C. Manual de analises químicas. EMBRAPA: Brasília, 1999. cap. 4, p.173-224.
31. NAKAMURA, H. Adaptation of yeast to cadmium VII. Significance of polyphosphate in cadmium resistance. Botanical Magazine, v. 78, n. 1, p. 85-90, 1965.
32. NORRIS, P. R.; KELLY, D. P. Accumulation of cadmium and cobalt by Saccharomyces cerevisiae. Journal of General Microbiology, v. 99, n. 2, p. 317-324, 1977.
33. PRADO-FILHO, L. G.; DOMINGOS, R. N.; MARIANO-da-SILVA, S. Acúmulo de cádmio por Saccharomyces cerevisiae fermentando em mosto de melaço. Scientia Agrícola, v. 55, n. 1,p. 128-132, 1998.
34. ROBARDS, K.; WOURSFOLD, P. Cadmium. Analyst, v. 116, n. 6, p. 549-568, 1991.
35. RÖSICK, E.; MANGIR, M.; LOCHMANN, E. R. Unterschiedlich Aufnahme von Cadmium in Saccharomyces - BZW.Rhodotorula
- zellen. Chemosphere, v. 15, n. 8, p. 981-983, 1986.
36. SALGADO, P. E. T. Toxicologia dos Metais. In: OGA, S.
Fundamentos de toxicologia. São Paulo: Atheneu Editora, 1996. cap.3.2, p.153-172.
37. SILVA, F. C. Uso agronômico do lodo de esgoto: efeitos em fertilidade do solo e qualidade da cana-de-açúcar. 1995. 165 f.. Tese (Doutorado em Agronomia) - Escola Superior de Agricultura “Luiz de Queiroz”, Universidade de São Paulo, Piracicaba, 1995.
38. SNEDECOR, G. W.; COCHRAN, W. G. Statistical methods. 6. ed. Ames: The Iowa State University Press, 1967. 593 p.
39. THEVELEIN, J. M. Regulation of trehalose mobilization in fungi.
Microbiological Reviews, v. 48, n. 2, p. 42-59, 1984
40. TREVELYAN, W. E.; HARRISON, J. S. Studies on yeast metabolism 5. The trehalose content of baker’s yeast during anaerobic fermentation.Biochemical Journal, v. 62, n. 2, p. 177-183, 1956a.
41. ______. Studies on yeast metabolism 7. Yeast carbohydrate fraction. Separation from nucleic acid analysis and behavior during anaerobic fermentation. Biochemical Journal, v. 63, n. 1, p. 23-33, 1956b.
42. VAN-STEVENNINK, J.; The inlfuence of nickelous ions on carbohydrate transport in yeast cells. Biochimica et Biophysica Acta, v. 126, n. 1, p. 154-162, 1966.
43. VAN-STEVENNINK, J.; BOOIJ, H. L. The role of polyphosphates in the transport mechanism of glucose in yeast cells. Journal of General Physiology, v. 48, n. 1, p. 43-60, 1964
decorrer do processo. 1995. 255 f.. Dissertação (Mestrado em Agronomia) - Universidade Federal de Viçosa, Viçosa, Brasil, 1995.
11. GRIFFIN, D. H. Fungal physiology. 2. ed. New York: John Wiley, 1994. 458p.
12. GUTIERREZ, L. E. et al. Efeito do níquel sobre Saccharomyces cerevisiae durante fermentação alcoólica. Acta Biológica Leopoldensia, v. 13, n. 2, p. 61-74, 1991.
13. HAHNE, H. C. H.; KROONTJE, W. Significance of pH and chloride concentration on behavior of heavy metals pollutants mercury (II), cadmium (II), zinc (II) and lead (II). Journal Environmental Quality, v. 2, n. 4, p. 444-450, 1973.
14. HELDWEIN, R.; TROMBALL, H. W.; BRODA, E. Aufnahme von Cobalt, Blei und Cadmium Durch Bäckerhefe. Zeitschrift für Allgemeine Mikrobiologie, v. 17, n. 4, p. 299-308, 1977. 15. KARAMUSHKA, V. I.; SAYER, J. A.; GADD, G. M. Inhibition of
H+ efflux form Saccharomyces cerevisiae by insoluble metal
phosphates and protection by calcium and magnesium: inhibitory effects a result of metal cations? Mycological Research, v. 100, n. 6, p. 707-713, 1996.
16. KESSELS, B. G. F.; BELDE, P. M. J.; BORST-PAUWELS, G. W. F. H. Protection of Saccharomyces cerevisiae against Cd2+ toxicity by Ca2+.Journal of General Microbiology, v. 131, n. 10, p. 2.533-2.537, 1985.
17. LESUISSE, E.; LABBE, P. Effects of cadmium and of YAP1 and CAD1/YAP2 genes on iron metabolism in the yeast Saccharomyces cerevisiae.Microbiology, v. 141, n. 11, p. 2.935-2.943, 1995. 18. LILLIE, S. H.; PRINGLE, J. R. Reserve carbohydrate metabolism
in Saccharomyces cerevisiae: response to nutrient limitation.
Journal of Bacteriology, v. 143, n. 3, p. 1384-1394, 1980.
19. LIMA, G. J. M. M. Uso da levedura seca (Saccharomyces cerevisiae) de destilarias de álcool de cana-de-açúcar na alimentação de matrizes suínas em gestação e lactação. 1983. 139 f.. Dissertação (Mestrado em Agronomia) – Escola Superior de Agricultura “Luiz de Queiroz”, Universidade de São Paulo, Piracicaba, 1983.
20. LOPES, J. J. C. Bagaço de nutrientes minerais no processo Melle-Boinot de fermentação alcoólica. 1989. 74 f.. Dissertação (Mestrado em Agronomia) - Escola Superior de Agricultura “Luiz de Queiroz”, Universidade de São Paulo, Piracicaba, 1989. 21. MALAVOLTA, E. Elementos de nutrição mineral de plantas.
São Paulo: Editora Agronômica Ceres, 1980. 251 p.
22. ______.Fertilizantes e seu impacto ambiental – micronutrientes e metais pesados: mitos, mistificação e fatos. São Paulo: Produquímica, 1994. 154 p.
23. ______.Manual de química agrícola. São Paulo: Agronômica
Ceres, 1976. 528 p.
24. MARIANO-da-SILVA, S. Acúmulo de cádmio por Saccharomyces cerevisiae fermentando mosto de caldo de cana. 1998. 45f.. Dissertação (Mestrado em Agronomia) - Escola Superior de Agricultura “Luiz de Queiroz”, Universidade de São Paulo, Piracicaba, 1998.
25. ______.Efeitos do cádmio sobre a fermentação alcoólica e o uso da vinhaça para atenuar a sua ação tóxica. 2001. 134 f.. Tese (Doutorado em Agronomia) - Escola Superior de Agricultura “Luiz de Queiroz”, Universidade de São Paulo, Piracicaba, 2001. 26. MARIANO-da-SILVA, S.; BASSO, L. C. Efeitos do cádmio sobre
o crescimento das leveduras Saccharomyces cerevisiae PE-2 e
45. VOLESKY, B. Biosorption by fungal biomass. In: VOLESK, B.
Biosorption of Heavy Metals. Boca Ranton: CRC Press, 1990. p. 139-172.
44. VARMA, A. Group IIB elements (Zn, Cd, Hg). In: VARMA, A.