POTASSIUM FERTILIZATION AND SOIL MANAGEMENT SYSTEMS FOR
COTTON CROPS
1VITOR MARQUES VIDAL2*, FREDERICO ANTONIO LOUREIRO SOARES2, MARCONI BATISTA TEIXEIRA2,
ANTONIO EVAMI CAVALCANTE SOUSA3, FERNANDO NOBRE CUNHA2
ABSTRACT - Cotton has great socio-economic importance due to its use in textile industry, edible oil and biodiesel production and animal feed. Thus, the objective of this work was to identify the best potassium rate and soil management for cotton crops and select among cultivars, the one that better develops in the climatic conditions of the Cerrado biome in the State of Goiás, Brazil. Thus, the effect of five potassium rates (100, 150, 200, 250 and 300 kg ha-1 of K
2O) and two soil management systems (no-till and conventional tillage) on the growth, development and reproduction of four cotton cultivars (BRS-371, BRS-372, BRS-286 and BRS-201) was evaluated. The data on cotton growth and development were subjected to analysis of variance; the data on potassium rates were subjected to regression analysis; and the data on cultivars and soil management to mean test. The correlation between the vegetative and reproductive variables was also assessed. The conventional tillage system provides the best results for the herbaceous cotton, regardless of the others factors evaluated. The cultivar BRS-286 has the best results in the conditions evaluated. The cultivar BRS-371 under no-till system present the highest number of fruiting branches at a potassium rate of 105.5% and highest number of floral buds at a potassium rate of 96.16%. The specific leaf area was positively correlated with the number of bolls per plant at 120 days after emergence of the herbaceous cotton.
Keywords: Gossypium hirsutum L. KCl. No-till. Conventional tillage. Boll production.
ADUBAÇÃO POTÁSSICA E SISTEMA DE MANEJO DO SOLO NA CULTURA DO ALGODÃO
RESUMO - O algodão possui grande importância social e econômica, devido a sua utilização na indústria têxtil, produção de óleo comestível, biodiesel e alimentação animal, dessa forma é de grande importância selecionar a cultivar que apresenta o melhor desempenho nas condições climáticas do Cerrado goiano e estudar seu comportamento em função de doses de potássio pelas inúmeras funções na planta e ainda identificar o manejo do solo que proporcione as melhores condições visando um maior desempenho da cultura. Dessa forma, objetivou-se com o experimento, avaliar cinco doses de potássio (100; 150; 200; 250; 300 kg ha-1 de
K2O), dois sistemas de manejo do solo (plantio direto e plantio convencional) no crescimento, desenvolvimento e reprodução de quatro cultivares de algodão (BRS-371, BRS-372, BRS-286 e BRS-201). Os dados de crescimento e desenvolvimento do algodoeiro foram submetidos à análise de variância e para os dados referentes às doses de potássio, realizou-se análise de regressão, e referentes às cultivares e sistemas de manejo do solo teste de média, ainda avaliou-se a correlação entre as variáveis vegetativas e reprodutivas analisadas. O sistema de plantio convencional proporciona melhores respostas ao algodoeiro herbáceo independentemente dos demais fatores avaliados. A cultivar BRS-286 apresenta melhor resposta nas condições avaliadas. A cultivar
BRS-371 no sistema de plantio direto apresenta maior número de ramo frutífero na dose de potássio de 105,5% e botão floral na dose de potássio de 96,16%. A área foliar específica é positivamente correlacionada com o número de capulho aos 120 dias após emergência do algodoeiro herbáceo.
Palavras-chave: Gossypium hirsutum L. KCl. Plantio direto. Plantio convencional. Produção de capulho.
_____________________
*Corresponding author
1Received for publication in 07/18/2015; accepted in 10/18/2016.
Paper extracted from the doctoral thesis of the first author, supported by the FAPEG.
2Department of Hydraulics and Irrigation, Instituto Federal Goiano, Rio Verde, GO, Brazil; [email protected], [email protected], [email protected], [email protected].
INTRODUCTION
Cotton (Gossypium hirsutum L.) is a plant that belongs to the Malvaceae family, which has great socio-economic importance and is one of the main Brazilian agricultural products, with significantly increasing exports, especially due to the use of cotton fiber as raw material for the textile industry, and its seeds for animal feed and vegetable oil for human consumption (FREIRE, 2011).
Cotton has a 160-day average cycle and requires temperatures of 22-26°C and water supply of 750-900 mm (IAC, 2016). The irregularity of precipitation is one of the main limiting factors to the cotton yield, and the use of irrigation may result in cotton crops less dependent on climatic factors and consequently, significantly increase the crop yield (ZONTA et al., 2015).
The nutrient potassium (K) is absorbed in large amounts by the cotton crops and is essential for the plant development, production and fiber quality (CARVALHO; FERREIRA; STAUT, 2011). According to Furlani Junior et al. (2001), K is the second most required nutrient by the plant, requiring about 150 kg ha-1 of K
2O to an approximate yield of 3.5 Mg ha-1.
According to Ernani et al. (2007), K has various functions in the plant, such as the activation of several enzyme systems, many of them acting in the photosynthesis and respiration processes. K also contributes to osmotic regulation, controlling the stomata opening and closing. An appropriate potassium rate in cotton crop may increase the number of bolls of larger diameter, boll weight and weight of 100 seeds (STAUT; ATHAYDE, 1999).
However, to establish calibration curves for potassium fertilization in cotton is needed, aiming higher yields and lower production costs.
According to Brown et al. (1995), the erosion control is the main advantage of the no-till system in cotton crops, since they found no significant differences of yield and fiber quality between the no-till and conventional tillage systems. However, Yamaoka (1991) found higher cotton yield under no-till compared with conventional tillage system. Thus, results on the effects of soil management systems on cotton crops are inconsistent, requiring further studies.
Moreover, to select suitable cotton cultivars for each region is essential, aiming their best development. According to Araújo et al. (2013), the good development of plants depends on the cultivar choice and its adaptation to different edaphoclimatic conditions and cultural and management practices.
Thus, the objective of this work was to select
the cotton cultivar that has the best results in the climatic conditions of the Cerrado biome in the State of Goiás, Brazil, and identify the potassium rate and soil management that provide the best development to cotton crops, and the vegetative variable that best relates to the cotton reproductive organs (boll and floral bud).
MATERIAL AND METHODS
The experiment was conducted under field conditions in the experimental area of the Federal Institute of Goiás, Rio Verde campus, State of Goiás, Brazil. According to the Köppen classification, the region has an Aw, tropical climate, with annual average precipitation of 1200-1660 mm, concentrated from October to May, representing over 80% of the total precipitation. The soil of the experimental area was classified as Oxisol (typic distroferric Red Latosol; SANTOS et al. 2013) of medium texture.
The experiment was conducted in a randomized block design in a split plot arrangement (5x2x4) with 3 replications, totaling 120 experimental units of 20 m2 (5x4 m), which consisted of five rows of plants spaced 1.0 apart, with 0.25 m between plants. The evaluated area consisted of the central 2.0 m of the 3 central rows.
The potassium (K) rates was considered as plots, with rates of 50, 75, 100, 125 and 150% of the rate recommended by Sousa and Lobato (2004), which resulted in 100, 150, 200, 250 and 300 kg ha-1
of K2O, respectively. The potassium source used was potassium chloride (KCl). The fertilization was divided into two applications, at 60 and 90 days after planting (DAP). The sub-plots consisted of the soil management systems (SMS) conventional tillage system (CTS), which consisted of a heavy and two light harrowing, and no-till system (NTS), which was implemented over an area cultivated with
Uruchoa brizantha cv. Marandu for three years,
which were planted with a seed density of 10 Kg ha-1, without fertilization, and desiccated at
130 days after emergence with the herbicide glyphosate (2.400 g ha-1). The sub-sub-plots
consisted of the cultivars BRS-371, BRS-372,
BRS-286 and BRS-201 (Figure 1).
Fertigation was carried out by a Venturi system, using the fertilizers monoammonium
phosphate (MAP) (104 kg ha-1) and urea
(81.2 kg ha-1) in two applications, according to the
Figure 1. Layout of the experimental plots [(Potassium rates (KR)], sub-plots [no-till system (NTS) and conventional
tillage system (CTS)] and sub-sub-plots [cultivars 1 (BRS-371), 2 (BRS-372), 3 (BRS-286) and 4 (BRS-201)]. Table 1. Chemical and physical characteristics of the soil of the experimental area.
Ca2+ and Mg2+ extracted with KCl 1 mol L-1 pH 7.0; Na+ and K+ extracted using NH4OAc 1 mol L-1 determined in CaCl2 solution.
Undisturbed soil samples of both soil management systems (SMS) were collected at 60 DAP in the soil layers 0-10, 10-20 and 20-40 cm, with four replications, to determine the soil density by the volumetric ring method (PAULA; DUARTE, 1997) and the soil resistance to penetration, applying tensions, representing decreasing levels of moisture, with amplitudes of 0.5-0.05 kg kg-1, using a bench
penetrometer (TORMENA; ROLOFF, 1996). Growth regulator (inhibitor of the gibberellic acid synthesis) was applied according to the methodology described by Furlani Júnior et al. (2003). Phytosanitary control (preventive and curative) was carried out according to the incidence of pests and diseases, following the recommendations of Almeida, Domingues and Ramalho (2013).
The irrigation method used was the surface drip, which consists of emitters spaced 30 cm apart, with flow rate of 1.1 L h-1, at pressure of 10 meters
of water column (mwc). The irrigation system was evaluated by the coefficient of absolute uniformity of application, which was 90.01%, according methodology described by Keller and Karmeli (1974).
The irrigation depth applied was based on the Pichet's evaporimeter (MENDONÇA; RASSINI,
2009), using the crop coefficient (kc) values described by Oliveira et al. (2013). The total precipitation during the experiment was 817.19 mm, and the total irrigation depth applied was 83.03 mm.
The decomposition of the Urochloa brizantha
cv. Marandu straw was also evaluated. Samples of the shoots were cut near to the ground, placed in 24 0.25x0.25-m nylon bags and randomly spread in the NTS sub-plots to evaluate their decomposition. The evaluations were performed at 60, 90 and 120 DAP in eight samples, which were dried in a forced -air circulation oven at 65ºC for 24 hours and subsequently, weighed on a precision balance (0.01 g).
The constant of decomposition (K) of the straw was then determinate by the Equation 1 (WIEDER; LANG, 1982),
P = Po exp(-kt) (1)
in which P is the concentration of the remaining substrate at the time t (Mg ha-1), P
o is the amount of substrate at time zero (Mg ha-1), t is the
decomposition time (days).
Subsequently, the straw weight loss was determinate by the Dalal and Mayer (1986) model Layer Density Total
Porosity Sand Silt Clay
Sorptive complex
Ca+2 Mg+2 Na+ K+ H+Al OM pHps
cm g cm-3 % --- g kg-1 --- --- cmolc kg-1 --- %
(Equation 2), originally used to simulate soil organic matter decomposition,
Yt = Yε + (Y0 – Yε) exp-kt (2)
in which Yt is the straw weight loss at the time t (kg ha-1), Y
o is the straw initial weight, soon after the plant cutting (Mg ha-1), Y
ε is the straw
weight at equilibrium condition (Mg ha-1) and k is
the constant of decomposition (days).
The leaf area to leaf dry weight ratio, i.e., specific leaf area (SLA), and the SLA to leaf weight ratio, i.e., leaf area ratio (LAR), were determinate at 60 and 120 DAP. The leaf area was quantified by the Equation 3 (GRIMES;CARTER, 1969),
Y = 0.4322 x2.3002 (3)
in which Y is the leaf area (cm2), x is the length of the main vein of the cotton leaf (cm).
The samples were dried in a forced-air circulation oven at 65°C for 48 hours and then, their dry weights were evaluated in a precision balance (0.01 g). The number of fruiting branches (NFBr), total number of branches (TNBr), number of floral buds (NFBu) and number of bolls per plant (NBP)
were determinate by visual counting.
The data were subjected to analysis of variance by the F test (p<0.05), with subsequent regression analysis by the orthogonal polynomial method for the potassium rates and Tukey's test (p<0.05) for the cultivars and soil management systems, for the analysis of plants and soil management systems and sampling layers to the soil properties.
Significance test (p-value<0.05) was carried out with by the Pearson's correlation analysis (r), using the supplement Action 2.7 of the software Excel, and when significant, the correlation magnitude was classified according to Cohen (1988).
RESULTS AND DISCUSSION
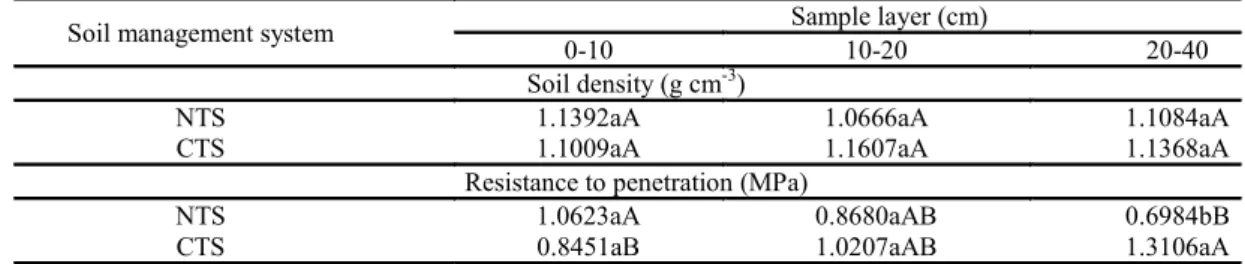
The soil management systems (SMS) and layers evaluated presented similar soil density (SD). The soil under conventional tillage system (CTS) presented resistance to penetration 46.7% higher than the soil under the no-till system (NTS) in the layer 20-40 cm. The layer 0-10 cm showed resistance to penetration 34.3% higher (NTS) and 35.5% lower (CTS) than the layer 20-40 cm (Table 2).
Table 2. Soil density and resistance to penetration under different management system and layers.
Averages followed by the same lowercase letter in the column and uppercase in the row do not differ by the Tukey's test (p<0.05). NTS = no-till system, CTS = conventional tillage system.
Ferrari et al. (2014) evaluated physical properties of an Oxisol (typic dystrophic Red Latosol - SiBCS) of clayey texture and the cotton development (NTS) over crops of oat, black oat and radish and found no effects of the treatments on the soil resistance to penetration, with similar results for
all layers evaluated (0-15, 15-30, 30-45 and 45-60 cm). These results differ from those in the
present study, in which the soil management systems presented differences of resistance to penetration, probably due to the seven years of Jatropha curcas
crop before the experiment implementation.
According to Rosolem et al. (1998), an increased soil resistance to penetration affects the root distribution and growth and nutrient absorption by the cotton, however, they found no reduction in shoot and root growth caused by soil compaction up to the density of 1.82 Mg m-3.
The Uruchoa brizantha cv. Marandu straw
decomposition presented weight of 1318.64 kg ha-1
at 60 days after planting (DAP), 2340.41 kg ha-1 at
90 DAP and 2716.66 kg ha-1 at 120 DAP, with
constant of decomposition (k) of 0.00125, 0.005 and 0.0075 kg day-1, respectively. Kliemann, Braz and
Silveira (2006) found an invariant index (kg day-1) of
weight loss (decomposition) of 0.0097 for a sole cultivation of Uruchoa brizantha.
Ferreira et al. (2010) evaluated the production, dry matter persistence and desiccation efficiency of plant species for soil cover crops, and their effects on cotton yield under NTS in an Oxisol (Red Latosol - SibCS) in Santa Helena de Goiás GO, Brazil, and found satisfactory production and dry matter persistence of Uruchoa brizantha cv. Marandu for cotton crops under NTS in the Brazilian Cerrado biome.
According to the analysis of variance (Table 3), the SMS affected the number of floral buds
Soil management system Sample layer (cm)
0-10 10-20 20-40
Soil density (g cm-3)
NTS 1.1392aA 1.0666aA 1.1084aA
CTS 1.1009aA 1.1607aA 1.1368aA
Resistance to penetration (MPa)
NTS 1.0623aA 0.8680aAB 0.6984bB
Table 3. Analysis of variance of the specific leaf area (SLA), leaf area ratio (LAR), number of fruiting branches (NFBr), total number of branches (TNBr), number of floral buds (NFBu) and number of bolls per plant (NBP) of cotton cultivars (C) subjected to potassium rates (KR) and soil management systems (SMS).
NS = not significant, * = significant at 5% of probability by the F test, CV (%) = coefficient of variation, DF = degrees of freedom.
The CTS had NFBu 25.2% higher (60 DAP), and NBP 37% higher (120 DAP) than the NTS, regardless of the others treatments. The cultivar
BRS-286 presented SLA 3.2% higher than the
BRS-371 at 120 DAP, and the cultivars BRS-372 and
BRS-201 had higher LAR (23.3%) at 120 DAS than the BRS-371, however, not differing from the
BRS-286 (Table 4).
Table 4. Number of floral buds (NFBu), number of bolls per plant (NBP), specific leaf area (SLA) and leaf area ratio (LAR) of cotton plants, at 60 and 120 days after planting (DAP), depending on the cultivar and soil management system (SMS).
Averages followed by the same letter in the column do not differ by the Tukey's test (p<0.05). NTS = no-till system,
CTS = conventional tillage system.
(NFBu) at 60 DAP and the number of bolls per plant (NBP) at 120 DAP. The cultivars (C) presented different specific leaf area (SLA) and leaf area ratio
(LAR) at 120 DAP. The interaction of potassium rates (KR), SMS and C affected the TNBr, NFBr and NFBu at 120 DAP.
Variation source DF Mean square (60 Days After Planting)
SLA LAR NFBr TNBr NFBu NBP
KR 4 517.46NS 52.52NS 2.45NS 9.32NS 27.66NS - Block 2 304.85NS 451.86NS 4.34NS 7.88NS 90.10NS - Residue 1 8 541.37 139.67 4.83 6.26 18.09 - SMS 1 2925.10NS 78.21NS 7.01NS 17.37NS 420.62* - KR x SMS 4 1305.97NS 258.62NS 1.59NS 2.39NS 26.35NS - Residue 2 4 1305.97 258.62 1.59 2.39 26.35 - C 3 1085.29NS 280.82NS 9.46* 13.31NS 29.43NS -
KR x C 12 675.69NS 124.40NS 1.69NS 4.12NS 19.66NS -
SMS x C 3 844.94NS 144.18NS 1.79NS 12.30NS 22.93NS -
KR x SMS x C 12 846.97NS 171.34NS 1.09NS 3.77NS 11.63NS -
Residue 3 66 740.36 150.48 2.03 6.29 15.22 -
CV1(%) 19.21 23.59 29.73 14.95 32.74 -
CV2(%) 29.83 32.09 17.04 9.24 39.52 -
CV3(%) 22.46 24.48 19.31 14.99 30.04 -
Variation source DF Mean square (120 Days After Planting)
SLA LAR NFBr TNBr NFBu NBP
KR 4 643.37NS 46.57NS 22.65NS 125.16NS 367.21NS 6.68NS Block 2 1185.08NS 75.39NS 437.89NS 249.74NS 126.06NS 9.27NS Residue 1 8 873.59 76.77 5.91 48.33 118.35 2.61
SMS 1 2141.19NS 0.90NS 112.76NS 2.40NS 3089.55NS 33.97* KR x SMS 4 1679.62NS 88.51NS 36.46NS 23.41NS 461.22NS 4.20NS
Residue 2 4 1679.62 88.51 36.46 23.41 461.22 4.20 C 3 2437.80* 109.81* 16.81NS 117.35NS 240.82NS 2.94NS KR x C 12 1015.65NS 51.71NS 10.74NS 98.30* 264.31NS 1.63NS SMS x C 3 497.45NS 2.14NS 27.82NS 3.12NS 40.30NS 2.26NS KR x SMS x C 12 1291.59NS 38.63NS 26.09* 104.92* 207.32* 2.92NS Residue 3 66 704.63 31.62 13.03 46.79 94.26 3.55
CV1(%) 40.60 34.49 16.40 18.26 32.27 38.52
CV2(%) 36.29 38.51 40.73 12.71 33.45 36.92
CV3(%) 36.46 34.97 24.35 17.96 37.73 39.91
Treatment NFBu NBP SLA LAR
60 DAP 120 DAP 120 DAP 120 DAP
SMS (cm2 g-1) (cm2 g-1)
NTS 11.11b 1.82b 68.58a 16.16a
CTS 14.86a 2.89a 77.03a 15.99a
Cultivars
BRS-371 11.97a 2.34a 60.59b 13.57b
BRS-372 12.29a 2.59a 78.23ab 17.69a
BRS-286 13.81a 1.92a 80.80a 15.61ab
Carvalho, et al. (2004) assessed the effects of SMS [(no-till and conventional tillage (one heavy and two light harrowing)] with green manures on the cotton crop development in an Oxisol (dystrophic Red Latosol - SiBCS), and found no significant effects on the cotton characteristics in any of the years evaluated, differing from the present study for the variables NFBu (60 DAP) and NBP (120 DAP).
According to the triple correlation (KR x SMS x C) (Table 5), the cultivar BRS-286 had a TNBr 34.7% higher than the other cultivars (NTS with KR of 100%); the cultivar BRS-371 had a TNBr approximately 30% higher than the BRS-286 and
BRS-201 (NTS with KR of 125%) at 120 DAP; and the BRS-371 had higher TNBr than the other cultivars, comparing the NTS with KR of 125%.
These different TNBr of the cultivars under different K rates are related to the cultivar responses to K, since the genetic factor probably contributed to these differences.
The cultivar BRS-286 had a NFBr 34.7% higher than the BRS-371 (NTS with KR of 75%), and a NFBr 40% higher in the NTS (KR of 75%) compared with the CTS (Table 5). The cultivar
BRS-286 had a NFBu 45% higher than the others cultivars (NTS with KR of 75%), and a NFBu of 44.2% (BRS-372), 75% (BRS-286) and 50% (BRS-201) higher in the NTS (KR of 75%) compared with the CTS. The cultivar BRS-286 had a NFBu 52.8% higher than the BRS-371 (NTS with KR of 100%).
Table 5. Total number of branches (TNBr), number of fruiting branches (NFBr) and number of floral buds (NFBu) of cotton cultivars (C), 120 days after planting, depending on the potassium rates (KR) and soil management systems (SMS); and SMS depending on the KR and C.
Averages followed by the same lowercase letter in the column (cotton cultivars depending on potassium rates and soil management systems), and the same uppercase letter in the row (soil management systems depending on potassium rates and cultivars) do not differ by the Tukey's test (p<0.05). CTS = conventional tillage system, NTS = no-till system.
Araújo et al. (2013) reaffirmed the importance of selecting appropriate cultivars to regional conditions. They assessed the phenology of herbaceous cotton cultivars (BRS-Cedro,
BRS-Itaúba, BRS-Araçá, BRS-Ipê-Cerrado and
BRS-Seridó) in an experiment conducted in 2010
(April to August) in the semi-arid region of the Brazilian Northeast and the cultivars BRS-Seridó and
BRS-Araripe, which are recommended for this
region, presented the best results for the characteristics evaluated.
Based on Rosolem et al. (1998) and Ferreira et al. (2010), the greater soil resistance to penetration
of the CTS (layer 20-40 cm) probably affected the root growth and nutrient absorption, since the highest TNBr, NFBr and NFBu were found in the NTS.
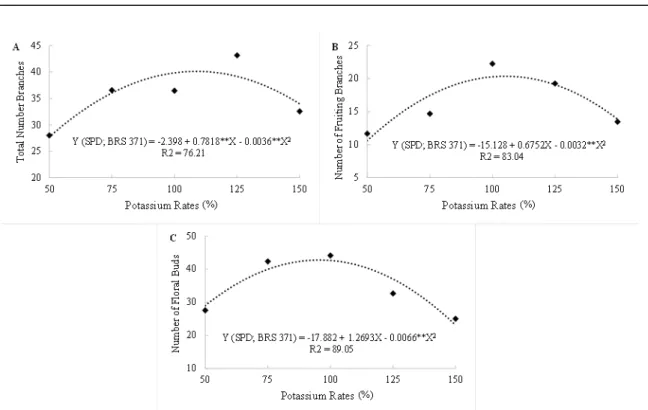
The BRS-371 in NTS had highest TNBr (KR of 108.58%) (Figure 2A), NFBr (KR of 105.5%) (Figure 2B) and NFBu (KR of 96.16%) (Figure 2C), with values estimated by polynomial models of 40.05, 20.49 and 43.14 respectively. The lowest TNBr, NFBr and NFBu of the BRS-371 in the NTS were found with KR of 50, 50, and 150% respectively.
Cultivar
Potassium rate (%)
50 75 100 125 150
CTS NTS CTS NTS CTS NTS CTS NTS CTS NTS
Total number of branches (unit)
BRS-371 32.9aA 28.0aA 40.8aA 36.5aA 37.3aA 35.4bA 31.9aB 53.1aA 37.8aA 32.5aA
BRS-372 34.5aA 33.5aA 39.1aA 39.2aA 35.9aA 36.2bA 41.1aA 41.7abA 39.3aA 37.2aA
BRS-286 35.4aA 34.4aA 40.9aA 46.0aA 44.5aA 55.4aA 40.7aA 29.8bA 41.7aA 40.7aA
BRS-201 38.3aA 36.7aA 35.0aA 42.1aA 38.0aA 30.2bA 38.5aA 37.2bA 36.7aA 36.7aA
Number of fruiting branches (unit)
BRS-371 14.2aA 11.7aA 12.7aA 14.7bA 11.1aA 22.2aA 9.4aA 19.2aA 15.5aA 13.4aA
BRS-372 12.9aA 13.3aA 12.7aA 16.7abA 14.9aA 18.3aA 16.1aA 16.8aA 15.7aA 16.1aA
BRS-286 12.8aA 15.4aA 13.5aB 22.5aA 14.4aA 19.5aA 16.3aA 12.1aA 13.1aA 15.7aA
BRS-201 12.1aA 13.1aA 13.4aA 16.8abA 13.2aA 11.9aA 16.7aA 13.4aA 16.2aA 12.9aA
Number of floral buds (unit)
BRS-371 22.5aA 27.5aA 20.8aA 29.3bA 14.2aA 20.8bA 14.2aB 35.00aA 25.8aA 25.1aA
BRS-372 14.8aA 26.8aA 22.2aB 39.8bA 16.8aA 25.4abA 19.1aA 22.2aA 18.8aA 29.6aA
BRS-286 17.2aA 17.5aA 18.1aB 72.3aA 33.1aA 44.1aA 19.2aA 21.7aA 26.5aA 25.0aA
BRS-201 16.4aB 32.9aA 18.8aB 37.7bA 19.9aA 26.7abA 30.0aA 36.3aA 24.7aA 20.3aA
Figure 2. Experimental data and regression analysis for the variables total number of branches (A), number of fruiting branches (B) and number of floral buds (C) of the cultivar BRS-371 in the no-till system (NTS) depending on the potassium
rates (KR).
Kaneko et al. (2014) studied the response of a high-density cotton crop to potassium rates (0, 60, 80, 100 and 120 kg ha-1) regarding its reproductive
variables and found no responses to potassium fertilization. However, the climatic conditions were more limiting to cotton yield than the nutrient rates in the soil. According to Malavolta, Vitti and Oliveira (1997), when the soil fertility, regarding potassium contents, is adequate in cultivated areas of Cerrado biome with cotton crop, a fertilization for replacing the amounts exported by the crop, making the necessary corrections, is recommended.
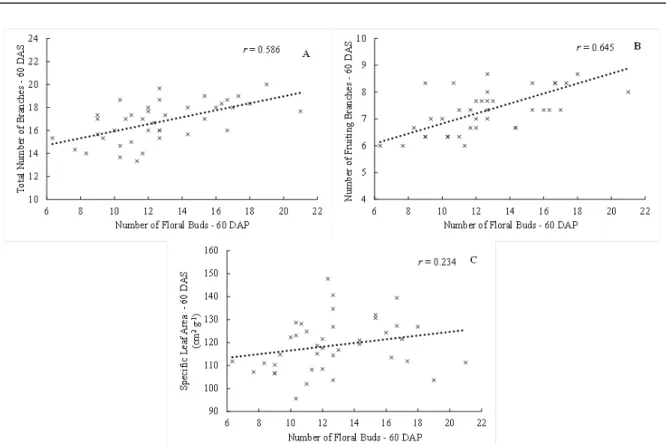
Figures 3 and 4 show the variables that showed significant correlations (p<0.05), based on the magnitude correlation (COHEN, 1988). The
variables TNBr and NFBr at 60 DAP had high correlation with the NFBu at 60 DAP (Figures 3A and 3B). These positive correlations denote the possibility of increasing the cotton production, since the greater the total number of branches, greater the number of floral buds. The variables SLA and NFBu at 60 DAP had a medium correlation (Figure 3C), probably due to the plant senescence with consequent leaf fall.
Figure 3. Significant correlations at 60 days after planting between the variables total number of branches and number of floral buds (A), number of fruiting branches and number of floral buds (B), and specific leaf area and number of floral buds (C).
Figure 4. Significant correlations at 120 DAP between the variables total number of branches and number of floral buds (A), number of fruiting branches and number of floral buds (B), and specific leaf area and number of bolls (C).
CONCLUSIONS
The conventional tillage system provides the best results for the herbaceous cotton, regardless of
the others factors evaluated.
The cultivar BRS-286 has the best results in the conditions evaluated.
potassium rate of 105.5% and highest number of floral buds at a potassium rate of 96.16%.
The specific leaf area was positively correlated with the number of bolls per plant at 120 days after emergence of the herbaceous cotton.
ACKNOWLEDGEMENTS
The authors thank the Ministry of Science and Technology (MCT), the National Council for Scientific and Technological Development (CNPq), the Coordination for the Improvement of Higher Education Personnel (Capes), the Foundation for Research Support of the State of Goiás (FAPEG), the Financier of Studies and Projects (FINEP), and the Federal Institute of Goiás (Rio Verde campus) for their financial and structural support.
REFERENCES
ALMEIDA, R. P.; DOMINGUES, C. A.; RAMALHO, F. de S. Manejo integrado de pragas do algodoeiro no Brasil. Campina Grande, PB: EMBRAPA ALGODÃO, 2013. 59 p.
ARAÚJO, L. F. et al. Características fenológicas, agronômicas e tecnológicas da fibra em diferentes cultivares de algodoeiro herbáceo. Agrária, Recife, v. 8, n. 3, p. 448-453, 2013.
BROWN, S. M. et al. Conservation tillage systems for cotton production. Soil Science Society of America Journal, Madison, v. 49, n. 5, p. 1256-1260, 1995.
CARVALHO, M. A. C. et al. Adubação verde e sistemas de manejo do solo na produtividade do algodoeiro. Pesquisa Agropecuária Brasileira, Brasília, v. 39, n. 12, p. 1205-1211, 2004.
CARVALHO, M. C. S.; FERREIRA G. B.; STAUT, L. A. A. Nutrição, calagem e adubação. In: FREIRE E. C. (Ed.). Algodão no Cerrado do Brasil. Aparecida de Goiânia: Mundial Gráfica, 2011. v. 2, cap. 19, p. 677-752.
COHEN J. Statistical power analysis for the behavioral sciences. Hillsdale, NJ: Erlbaum. 1988.
DALAL, R. C.; MAYER, R. J. Long-term trends in fertility of soils under continuous cultivation and cereal cropping in Southern Queensland. II. Total organic carbon and its rate of loss from the soil profile. Australian Journal Soil Research, Sydney, v. 24, n. 2, p. 281-292, 1986.
ERNANI, P. R. et al. Potássio. In: NOVAIS, R. F.; ALVAREZ, V. H.; BARROS, N. F.; (Eds.).
Fertilidade do solo. Viçosa: Sociedade Brasileira de Ciências do Solo, 2007. v. 1, cap. 9, p. 551-594.
FERRARI, S. et al. Atributos físicos do solo e desenvolvimento do algodoeiro em semeadura direta. Brazilian Journal of Biosystems Engineering, Tupã, v. 8, n. 1, p. 73-83, 2014.
FERREIRA, A. C. de B. et al. Produção de biomassa por cultivos de cobertura do solo e produtividade do algodoeiro em plantio direto. Pesquisa Agropecuária Brasileira, Brasília, v. 45, n. 6, p. 546-553, 2010.
FREIRE, E. C. Algodão no cerrado do Brasil. 2. ed. Aparecida de Goiânia, GO: ABRAPA, 2011. 1082 p.
FURLANI JÚNIOR, E. et al. Extração de macronutrientes e acúmulo de massa seca de algodão cv. IAC 22. Cultura Agronômica, Ilha Solteira, v. 10, n. 1, p. 71-87, 2001.
FURLANI JUNIOR, E. et al. Modos de aplicação de regulador vegetal no algodoeiro, cultivar IAC 22, em diferentes densidades populacionais e níveis de nitrogênio em cobertura. Bragantia, Campinas, v. 62, n. 2, p. 227-233, 2003.
GRIMES, D. W.; CARTER, L. M. A linear rule for direct nondestructive leaf area measurements. Agronomy Journal, Madison, v. 3, n. 61, p. 477-479, 1969.
INSTITUTO AGRONÔMICO DE
CAMPINAS - IAC. Cultivares - Algodão. Disponível em: <http://www.iac.sp.gov.br/cultivares/ inicio/resultados_quantitativos_view.php?
pesquisa=Algodão >. Acesso em: 09 jul. 2016.
KANEKO, F. H. et al. Resposta do algodoeiro em cultivo adensado a doses de nitrogênio, fósforo e potássio. Agrária, Recife, v. 7, n. 25, p. 382-389, 2014.
KELLER, J.; KARMELI, D. Trickle irrigation design parameters. Trans. ASAE. v. 17, p. 678-684. 1974.
KLIEMANN, H. J.; BRAZ, A. J. P. B.; SILVEIRA, P. M. Taxas de decomposição de resíduos de espécies de cobertura em Latossolo Vermelho distroférrico. Pesquisa Agropecuária Tropical, Goiânia, v. 36, n. 1, p. 21-28. 2006.
MENDONÇA, F. C.; RASSINI, J. B. Método EPS para manejo da irrigação de forrageiras. São Carlos, SP: Embrapa Pecuária Sudeste, 2009. 9 p. (Circular técnica, 63).
OLIVEIRA, S. E. M. et al. Coeficientes de cultura do algodão herbáceo e do feijão-caupi em sistemas monocultivo e consorciado. Revista Brasileira de Agricultura Irrigada, Fortaleza, v. 7, n. 3, p. 191-200. 2013.
PAULA, J. L.; DUARTE, M. N. Manual e métodos de análise de solo. 2. ed. Rio de Janeiro, RJ: EMBRAPA. Centro Nacional de Pesquisa de Solos, 1997. 247 p.
ROSOLEM, C. A. et al. Root growth and cotton nutrition as affected by liming and soil compaction. Communications in Soil Science and Plant Analysis, São Francisco, v. 29, n. 1-2, p. 169-177. 1998.
SANTOS, H. G. et al. Sistema Brasileiro de Classificação de Solos. 3. ed. Brasília, DF: EMBRAPA, 2013. 353 p.
SOUSA, D. M. G.; LOBATO, E. Cerrado: correção do solo e adubação. 2. ed. Brasília, DF: Embrapa Informação Tecnológica, 2004. 416 p.
STAUT, L. A.; ATHAYDE, M. L. F. Efeitos do fósforo e potássio no rendimento e em outras características agronômica do algodoeiro herbáceo. Pesquisa Agropecuária Brasileira, Brasília, v. 34, n. 10, p. 1839-1843. 1999.
TORMENA, C. A.; ROLOFF, G. Dinâmica da resistência à penetração de um solo sob plantio direto. Revista Brasileira de Ciências do Solo, Viçosa, v. 20, n. 2, p. 333-339. 1996.
WIEDER, R. K.; LANG, G. E. A Critique of the analytical methods used in examining decomposition data obtained from litter bags. Ecology, Durham, v. 63, n. 6, p. 1636-1642. 1982.
YAMAOKA, R. Plantio direto no Estado do Paraná. Londrina, PR: Iapar, 1991. 241 p. (Circular técnica, 23).
![Figure 1. Layout of the experimental plots [(Potassium rates (KR)], sub-plots [no-till system (NTS) and conventional tillage system (CTS)] and sub - sub - plots [cultivars 1 (BRS - 371), 2 (BRS - 372), 3 (BRS - 286) and 4 (BRS - 201)].](https://thumb-eu.123doks.com/thumbv2/123dok_br/15870770.664889/3.892.133.807.105.510/figure-layout-experimental-potassium-system-conventional-tillage-cultivars.webp)