AN ASSESSMENT OF E-SERVICE QUALITY, CUSTOMER
SATISFACTION, AND CUSTOMER TRUST ON CUSTOMER
BEHAVIOR IN ONLINE SHOPPING
Almira Farisa
Dissertation submitted as partial requirement for the conferral of Master in Management
Supervisor:
Professor Paulo Rita, Professor of Marketing, ISCTE Business School
Co-Supervisor:
Professor Tiago Oliveira, Associate Professor of Information Management, NOVA-IMS
AN ASS ES S MENT OF E -S ERVI C E Q UA LI TY , C USTOMER S AT ISF A C TI ON , AN D CUSTOM ER TRUS T O N CUSTOMER B EH AV IO R IN ON L INE S HO P P IN G Alm ira F ar isa
iii
Abstract
This purpose of this dissertation is to synthesize existing insight about e-service quality in online business and develop new visions that helps manager to understand the most important dimensions of e-service quality that have impact on customer satisfaction, customer trust, and customer behavior. This study focus on the impact of e-service quality of Indonesian e-commerce. This study tested the four-dimensions of e-service quality that better predict customer behavior. The result was expected to extend the insight about country culture difference might have different relevance of e-service quality attributes.
Data from an online survey of 355 Indonesian online consumers were used to test the research model. Structural equation modelling technique was used to test the research model. The analytical result showed that three dimensions of e-service quality: website design, security/privacy, and fulfilment positively affect overall e-service quality. Meanwhile customer service is not significantly related to overall e-service quality. Later, overall e-service quality is significantly related to customer satisfaction and customer trust. This study also tested the impact of customer satisfaction and customer trust on customer behavior such as repurchase intention, word of mouth, and site revisit. Result indicate customer satisfaction and customer trust had a positive impact on customer behavior.
Keywords: E-Service Quality, Customer Satisfaction, Customer Trust, Customer Behavior
JEL: M30 – Marketing and Advertising: General JEL: M31 – Marketing
iv
Resumo
O objetivo desta dissertação é sintetizar a percepção existente sobre a qualidade do serviço eletrónico em negócios on-line e desenvolver novas visões que ajudem o gestor a entender as dimensões mais importantes da qualidade do serviço eletrónico que têm impacto na satisfação, confiança e comportamento do cliente. Este estudo foca o impacto da qualidade do serviço eletrónico do comércio eletrónico na Indonésia, tendo testado as suas quatro dimensões de qualidade que melhor prevêem o comportamento do cliente. Pretende-se que os resultados obtidos permitam percepçionar melhor a diferença que a cultura do país pode ter na relevância dos diferentes atributos de qualidade do serviço eletrónico.
Dados recolhidos de 355 consumidores on-line indonésios foram usados para testar o modelo conceptual mediante a aplicação de modelação de equações estruturais. Os resultados mostraram que três dimensões da qualidade do serviço eletrónico, designadamente design do site, segurança / privacidade e atendimento afetam positivamente a qualidade geral do serviço eletrónico. O atendimento ao cliente não está significativamente relacionado à qualidade geral do serviço eletrónico. Adicionalmente, a qualidade geral do serviço eletrónico está significativamente relacionada com a satisfação e com a confiança do cliente. Este estudo também testou o impacto da satisfação e da confiança do cliente no seu comportamento, bem como a intenção de recompra, o passa-palavra e a revisitação do site. O resultado indica que a quer a satisfação quer e a confiança do cliente tiveram um impacto positivo no seu comportamento.
Palavras chave: Qualidade do serviço eletrónico, Satisfação do Cliente, Confiança do Cliente, Comportamento do Cliente
JEL: M30 – Marketing and Advertising: General JEL: M31 – Marketing
v
Acknowledgements
First, I would like to praise and be grateful for the presence of Allah subhanahu wa ta’ala who gives me the capability to finish this dissertation. I would like to grant my gratitude to all of those who make the completion of this dissertation possible. I would like to thank my supervisor, Professor Paulo Rita, for all the help, support, and advice since the very beginning until I finally finish this study. I would also like to acknowledge Professor Tiago Oliveira as the co-supervisor of this dissertation. I am gratefully indebted for his valuable feedback on this dissertation. Finally, I would also thanks to my parents and my family who fully support me and make this possible, my colleagues in ISCTE, my Indonesian friends, and all the professors who taught me during my study. This accomplishment would not have been possible without them. Thank you.
vi
Table of Contents
Abstract ... iii Resumo ... iv Acknowledgements ... v Table of Contents ... viList of Tables and Figures... vii
List of Abbreviations ... viii
Chapter 1. Introduction ... 1
Chapter 2. Literature Review and Research Hypotheses ... 4
2.1. E-Service Quality ... 4 2.2. Customer Satisfaction ... 7 2.3. Customer Trust... 8 2.4. Repurchase Intention ... 9 2.5. Word of Mouth ... 9 2.6. Site Revisit ... 10 Chapter 3. Contextualization ... 11
3.1 Online Retailer Business in Indonesia ... 11
3.2 Indonesian Consumer Behavior ... 13
Chapter 4. Research Methodology ... 16
4.1. Sample and Data Collection... 16
4.2. Research Instrument and Construct Measurement ... 16
4.3. Measurement Model ... 18
Chapter 5. Data Analysis and Discussion ... 25
5.1. Hypotheses Testing ... 25
5.2. Discussion ... 26
Chapter 6. Conclusion ... 30
6.1. Theoretical Contributions ... 30
6.2. Managerial Implications ... 30
6.3. Limitations and Future Research ... 31
References ... 33
vii
List of Tables and Figures
List of Table
Table 1. Measurement of latent constructs ... 17
Table 2. Cronbach's alpha, composite reliability (CR), AVE, and Fornell-Lacker Criterion . 20 Table 3. Cross-loadings ... 21
Table 4. Heterotrait-monotrait (HTMT) ratio ... 23
Table 5. Formative measurement model evaluation ... 24
List of Figures Figure 1. Conceptual model ... 6
Figure 2. The example of Indonesian based e-commerce ... 11
Figure 3. Top e-commerce sites in Indonesia by estimate monthly traffic ... 12
Figure 4. E-Commerce mobile traffic in Southeast Asia ... 12
Figure 5. Average transaction value and PDB per capita of Southeast Asia countries ... 13
Figure 6. Popular payment methods provided in Southeast Asia based e-commerce ... 13
viii
List of Abbreviations
COD cash on delivery
CS customer service DC delivery condition FF fulfilment IQ information quality MA merchandise availability OA order accuracy PO price offerings PP purchase process PR privacy PS product selection RP return handling/policies SA system availability SC security SL service level SP security/privacy TD timeliness of delivery WA website aesthetics WC website convenience WD website design WOM word of mouth WP web personalization
1
Chapter 1. Introduction
For over a decade the Internet has been generating consumer empowerment (Pires, Stanton, & Rita, 2006). Brick-and-mortar stores are slowly but surely closing down because of the rise of e-commerce (Quora, 2017). Compared with physical stores, online businesses offer convenience to customers (Business.com, 2017). Customers can just sit at their home, place their orders, pay via credit card, and wait until the goods are delivered to their home. E-commerce in Indonesia is growing fast due to the growth of internet penetration. In March 2017, the internet penetration reached slightly over 50% with 104.96 million internet users. The number of Indonesian internet users are projected to reach 133.39 million in 2021, making Indonesia one of the biggest online markets worldwide (Statista, 2018b). According to Statista (2018a), Indonesia currently has approximately 28.2 million online shoppers, and is projected to experience a 3-4% annual increase for the next years. The majority of users are in 25-34 years old range and account for 12.8 million users who are shopping online in Indonesia.
The rapid development of information technology led to a cultural shift. Customers started to shop in e-commerce rather than in physical stores. Physical businesses have been attempting to gain a competitive advantage by using e-commerce to interact with customers (Lee & Lin, 2005). In online business, competition can easily enter the market because of low entry barriers (Wang et al., 2016). From the customer side, they have low switching costs to shop from one online store to another (Mutum et al., 2014). In physical business and online business, customer shopping experience influences future customer behavior, including repurchase intention, store revisit intention, and word of mouth (WOM) (Chang & Wang, 2011).
The biggest challenge for online shopping is to provide and maintain customer satisfaction. A key success factor to survive in a fierce competitive e-environment is strategy that focuses on services. A company must deliver superior service experiences to its customers, so they will repurchase and be loyal to the firm (Gounaris et al., 2010). To obtain high levels of customer satisfaction, high service quality is needed which often leads to favorable behavioral intentions (Brady & Robertson, 2001). A website with good system quality, information quality, and electronic service quality is a key to success in e-commerce (Sharma & Lijuan, 2015).
The concept of e-service quality has been studied by many researchers. The attributes of e-service quality have a significant association with overall e-service quality, customer
2 satisfaction, and repurchase intentions, but not WOM (Blut et al., 2015). Tsao et al. (2016) studied the impact of e-service quality on online loyalty based on online shopping experience in Taiwan and showed that system quality and electronic service quality had significant effect on perceived value, that in turn had significant effect on online loyalty. Blut (2016) demonstrated that e-service quality had positive effect on customer satisfaction, repurchase intention, and WOM for online shoppers in US. In general, the existing studies about e-service quality have differences in both methodology and results, with no definite conclusions (Gounaris et al., 2010).
The purpose of this study is to build on existing literature on e-service quality in online shopping and develop new knowledge to better understand the most important dimensions of e-service quality that have impact on customer satisfaction, customer trust, and customer behavior. The lack of studies about the impact of e-service quality other than on customer satisfaction, purchase intention, and WOM and the difference in both methodology and result of e-service quality studies constitutes a research gap. Chang et al. (2013) stated that trust is the most important factor to attract e-commerce buyers. Yet, only few studies can be found about the impact of service quality on trust, especially on online business. Rasheed & Abadi (2014) tested the impact of e-service quality on trust in the overall services industry while Saleem, Zahra, & Yaseen (2017) tested it on Pakistan airline industry. Country culture was found to affect the relevance of e-service quality construct and Blut et al. (2015) also suggested that future research should test whether the e-service quality measurement works equally well in different countries and cultures. Gounaris et al. (2010) found that e-service quality had positive impact on three consumer behavioral intentions: purchase intentions, site revisit, and WOM. Rasheed & Abadi (2014) found that trust was considered to be an antecedent of service quality. Using an incorrectly specified e-service quality model would overestimate the importance of e-service quality attributes (Blut et al., 2015). Blut et al. (2015) developed a conceptual model of e-service quality that was able to predict customer behavior better than other established instrument, but only Blut (2016) tested empirically the conceptual model for online shoppers in the U.S. To address the research gap mentioned above, this study empirically tested Blut et al. (2015) e-service quality model in order to understand the impact of e-service quality not only in customer satisfaction, purchase intention, and WOM, but also in customer trust and site revisit, and applied to Indonesian online shoppers. The contributions of this study are to investigate the direct effect of overall service quality on customer satisfaction, customer
3 trust, and customer behavior as well as which dimensions of e-service quality have impact on building the perception of overall service quality, especially in Indonesia context.
4
Chapter 2. Literature Review and Research Hypotheses
2.1. E-Service Quality
Many researchers have proposed different attributes and dimension to measure e-service quality. The early study about e-e-service quality was done by Dabholkar (1996) who examined how customers form expectations on technology based self-service quality and suggested five main attributes of e-service quality: speed of delivery, ease of use, reliability, enjoyment, and control. The result of the study shows that control and enjoyment were significant determinants of service quality, ease of use was also a key determinant in service quality, but only for high waiting time and control groups, while speed of delivery and reliability had no impact on service quality.
Later, Loiacono, Watson, & Goodhue (2002) analyzed websites selling books, music, airline tickets and hotel reservations, developing the WebQualTM scale to measure e-service quality. The dimensions of WebQualTM informational fit to task, interactivity, trust, response time, ease of understanding, intuitive operations, visual appeal, innovativeness, flow (emotional appeal), consistent image, on-line completeness, better than alternative channels. The study provides researchers with a validated reliable measure of website quality. It also adds understanding of TAM by revealing the components of ease of use and usefulness.
Other research conducted by Wolfinbarger & Gilly (2003) using focus groups identified four dimensions of e-service quality called eTailQ.: customer service, privacy/security, website design, and fulfilment/reliability. Pan, Ratchford, & Shankar (2002) analyzed 105 e-tailers comprising 6,739 price observations for 581 items in eight product categories, and proposed five dimensions of e-service quality: reliability, shopping convenience, product information, shipping/handling, and pricing.
Zeithaml et al. (2002) assembled what is currently known about service quality delivery through websites on five main dimensions: information availability and content, ease of use, privacy/security, graphic style, and fulfilment/ reliability. A study conducted by Parasuraman et al. (2005) divided e-service quality into two different scales: e-service quality scale (E-S-QUAL) and e-service quality recovery scale (E-RecS-(E-S-QUAL). Privacy/security, reliability, fulfilment, efficiency, and individualized attention are the dimensions of E-S-QUAL where the dimensions of E-RecS-QUAL are responsiveness, compensation, and contact. The result of the study shows that privacy plays a significant role in customers’ higher-order evaluations pertaining to websites.
5 Gounaris et al. (2010) examined the effect of service quality and satisfaction on WOM, site revisit, and purchase intention in the context of internet shopping. To measure e-service quality, these authors used WebQual scale (usability, information, and interaction) developed by Barnes & Vidgen (2002) and two additional parameters, aesthetics and after sales service, developed by Lee & Lin (2005). The study used 240 random online interviews from an Internet provider in Greece and showed that e-service quality had a positive effect on e-satisfaction, while it also influenced, both directly and indirectly through e-satisfaction, the customer behavioral intentions, namely site revisit, WOM communication and repeat purchase.
Kitapci et al. (2014) investigated the effect of service quality dimensions on patient satisfaction, identified the effect of satisfaction on WOM communication and repurchase intention, and looked for a significant relationship between WOM and repurchase intention in the public healthcare industry. The framework used the SERVQUAL model developed by Parasuraman et al. (1985) to measure service quality. The study demonstrated that customer satisfaction had a significant effect on WOM and repurchase intentions which were found highly related.
In a more recent study, Blut et al. (2015) determined the model that best describes the dimensions that compromise e-service quality. Results show that e-service quality is a four-dimensional construct: website design, customer service, security/privacy, and fulfilment. Later, Blut (2016) empirically tested Blut et al., (2015) model using 358 U.S. online customers. The study showed that e-service quality construct conformed to the structure of a higher order factor model that links online service quality perceptions to distinct and actionable dimensions, including website design, fulfillment, customer service, and security/ privacy. The result of this study also showed that overall quality fully mediated the relationship between dimensions and outcomes for fulfilment and security, and partially mediated the relationships for customer service and website design.
6 Figure 1. Conceptual model
The following Figure 1 illustrates the proposed conceptual model for e-service quality in online shopping context. To examine the relationship among customer satisfaction, customer trust, repurchase intention, WOM, and site revisit, the models from Gounaris et al. (2010), Blut (2016), Rasheed & Abadi (2014) and Kitapci et al. (2014) were adapted.
According to Blut (2016), e-service quality measurements contain four dimensions: website design, customer service, security/privacy, and fulfilment. Website design refers to all elements of customer's experience related to the website, including information quality, website aesthetics, purchase process, website convenience, product selection, price offerings, website personalization, and system availability. An efficient website should contain three main categories of contents: information-oriented, transaction-oriented, and customer-oriented (Cox & Koelzer, 2004). A good website design should emphasize the usability by providing the aesthetics of the design, reflecting a strong and associative image to the brand, and being able to attract customers to visit it (Díaz & Koutra, 2013). Customers would assess their experience of using a website to assess an online store’s overall service quality. Hence, H1. Website design influences positively overall e-service quality
7 Customer service refers to service level and return handling/return policies during and after the sale (Blut, 2016). Offline businesses always have service staff that helps customers during the purchasing process. In online businesses, customers sometimes do the entire purchasing process by themselves without customer service assistance (McLean & Wilson, 2016). Some online businesses provide customer service that allows customers to ask more detailed information regarding the product they want to buy. Companies usually use web-based synchronous media such as live chat facilities, online help desk, and social network websites (Turel & Connelly, 2013). According to Blut (2016), customer service might contribute to e-service quality. Hence,
H2. Customer service has a positive direct influence on overall e-service quality
Security/privacy refers to the security of credit card payment and privacy of shared information (Blut, 2016). To increase the website credibility and service quality, the website must emphasize assurance and security (Wang et al., 2015). Schmidt et al. (2008) showed that an effective website must feature privacy and security (see also: Fortes & Rita, 2016). When a customer purchases goods from an online website, this requires to enter private information such as name, address, and contact number, including information about credit card (Holloway & Beatty, 2008). Customers are always concerned whether the website would protect them against fraud after transaction. Website security and privacy is important to assess service quality of online stores. Hence,
H3. Security/privacy impacts positively on overall e-service quality
Fulfilment refers to activities that ensure customers receive what they ordered including time of delivery, order accuracy, and delivery condition (Blut, 2016). This attribute can only be assessed after the payment is done. According to Liao & Keng (2013), customer post-payment dissonance is more likely to occur in online shopping rather than in the offline shopping environment because customers cannot see directly the product before they purchase it. Companies must make sure delivery timeliness, order accuracy, and delivery condition to provide superior service quality for customers. Order fulfilment represents one of the determinants of e-service quality. Hence,
H4. Fulfilment exerts a positive impact on overall e-service quality 2.2. Customer Satisfaction
Customer satisfaction is an indication of the customer’s belief of the probability of a service leading to a positive feeling (Udo et al., 2010). According to Kotler & Keller (2006),
8 customer satisfaction is the consequence of customer’s experiences during the buying process, and it plays a crucial role in affecting customers’ future behavior, such as online repurchase and loyalty (Pereira, Salgueiro, & Rita, 2016). Satisfaction is one of the most important success measures in the business to consumer (B2C) online environment (Shin et al., 2013). A satisfied online customer would likely to shop again and recommend online retailers to others (e.g., Pereira et al., 2017), while a dissatisfied customer would leave his/her online retailer with or without any complaint.
Satisfaction is closely related to customer attitudes and intentions, which are part of a customers’ behavior (Holloway et al., 2005) and directly influence customers’ positive behavioral intentions. Prior literature has confirmed a significant relationship between e-service quality and customer satisfaction (Blut et al., 2015; Gounaris et al., 2010; Kitapci et al., 2014; Udo et al., 2010). Gounaris et al. (2010) argue that e-service quality has a positive effect on satisfaction. E-satisfaction also influences, directly and indirectly through e-satisfaction, positive outcomes namely repurchase intention, WOM, and site revisit. Thus, the following hypothesis is provided to investigate the effect of service quality on customer satisfaction in online shopping.
H5. Overall e-service quality positively influences customer satisfaction 2.3. Customer Trust
Trust is a major factor for customers to decide whether to buy products from online stores or not (Fortes, Rita, & Pagani, 2017). According to Wu et al. (2018), trust can be seen as a belief, confidence, sentiment, or expectation about buyer intention or likely behavior. According to Chang et al. (2013), lack of trust is a major barrier in the adoption of e-commerce. Oliveira et al. (2017) measured three dimensions of consumer trust (competence, integrity and benevolence) and found that customer with high overall trust demonstrated a higher intention to e-commerce. Shopping through internet involves trust not only between internet merchant and customer, but also between customer and the computer system where the transaction is executed (Lee & Turban, 2001). Trust helps reduce uncertainty when the degree of familiarity between consumer and transaction security mechanism is insufficient (Wu et al., 2018). Previous studies have found that there is a positive relationship between service quality and trust (Rasheed & Abadi, 2014; Wu et al., 2010). Based on these findings, we argue that in online businesses:
9 2.4. Repurchase Intention
Customer satisfaction is a critical factor to generate customer loyalty (Pham & Ahammad, 2017). Kotler & Armstrong (2012) stated that customer satisfaction is the key to the buying behavior of the future. Repurchase intention indicates an individual’s willingness to make another purchase from the same company, based on his/her previous experiences (Hellier et al., 2003). Customers who are satisfied with the service provided by a service provider would increase the usage level and future usage intentions (Henkel et al., 2006). Customer satisfaction and repurchase intentions can be increased by offering superior service quality (Cronin et al., 2000). When customers are satisfied with the product or service they buy, they tend to purchase again from the same supplier. Several studies have found evidence for a positive relationship between customers’ satisfaction and repurchase intentions (Blut et al., 2015; Kitapci et al., 2014; Pham & Ahammad, 2017; Wolfinbarger & Gilly, 2003).
If customers have high level of trust toward the website, it is more likely for them to have intention to purchase (Gao, 2011). Moreover, if customers have already experienced purchase from a website and they had good purchase experience from it, then they would likely to repurchase from the same website. Chek & Ho (2016) found evidence of a positive relationship between service customer trust and purchase intention. Based on this evidence, we propose that:
H7. Customer satisfaction positively influences repurchase intention H8. Customer trust positively influences repurchase intention 2.5. Word of Mouth
Word of mouth (WOM) is product information that individuals transmit to other individuals (Solomon, 2018). WOM tends to be more reliable and trustworthy than other messages from formal marketing channels because customers get the word from people they know (Tuten & Solomon, 2015). WOM communication is an effective and powerful method to influence purchase decisions, particularly when important information is communicated by reliable and credible sources (Ennew, Banerjee, & Li, 2000).
According to Brown et al. (2007), the emergence of the internet has allowed customers to interact with each other quickly, and has easily established a phenomenon known as interpersonal online influence or electronic WOM. Customers often use WOM when they are looking for information about brands, products, services, and organizations. WOM continues to be recognized as an important source of information affecting customer product choices
10 (Smith et al., 2005). Companies must be aware of both positive and negative WOM communication, since it is highly related to customers’ behavioral intentions and affects corporate sales and profits (Jung & Seock, 2017). According to Wang (2011), not all satisfied customers result in positive WOM about services, whereas dissatisfied customers have strong tendency to share their bad experience with others.
Customers who experience good service quality provided by an e-commerce site tend to engage in positive WOM communication, with positive WOM being an outcome of customer satisfaction (Kau & Loh, 2006). Kitapci et al. (2014) found that satisfied customers positively influence their WOM intentions. Kim & Stoel (2004) also showed the important role of online trust in order for customers to recommend a brand or website. Customers need to be satisfied with their experience and trust the information provided by the website before they give recommendation to others (Loureiro et al., 2018). Therefore, this research leads to the following hypotheses:
H9. Customer satisfaction positively influences WOM H10. Customer trust positively influences WOM 2.6. Site Revisit
Site visitors’ perceived service quality is a significant indicator of satisfaction as well as post-visit behavioral intentions such as site revisit (Leung et al., 2011). The more positive the customer feels about a particular site after an interaction, the more likely the customer is to return to that site (Gounaris et al., 2010). Another key issue for online service companies is a customer’s decision to return or not to an internet site. The decision to revisit a site resembles customer service switching behavior (Keaveney, 1995), where a customer keeps on using the online service category but switches from one service provider to another.
Taylor & Strutton (2010) predicted intentions to return to a website. Gounaris et al. (2010) confirmed that the relationship between customer satisfaction and site revisit was significantly positive. In general, customers tend to use their past retail service experience for decision making in order to formulate strategies for repeat behavior. Therefore, the following hypothesis is proposed:
11
Chapter 3. Contextualization
3.1 Online Retailer Business in Indonesia
Online terms means on the Internet. Online shopping is the activity or action of buying products or services over the Internet (Oxford Dictionaries, n.d.). It means, customer going online, browse in the seller’s website, selecting the product they want to buy, arranging for its delivery, and finally pays the product with debit or credit card. Online retailer is a company that provide online shopping facilities. They provide a website that allow consumers to purchase from their website. According to Investopedia (n.d.), online retailing can include business-to-business (B2B) and business-to-consumer (B2C) sales of products and services, through subscriptions to website content.
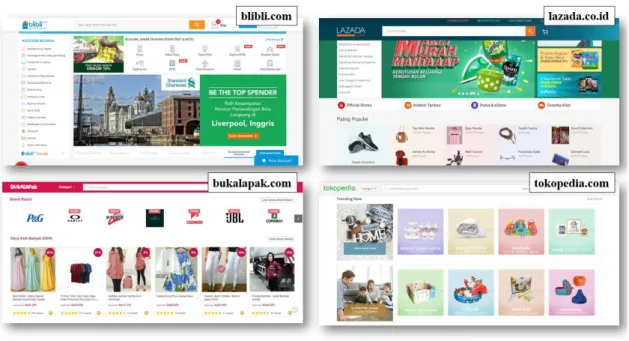
Figure 2. The example of Indonesian based e-commerce
Source: blibli.com; bukalapak.com; lazada.co.id; tokopedia.com
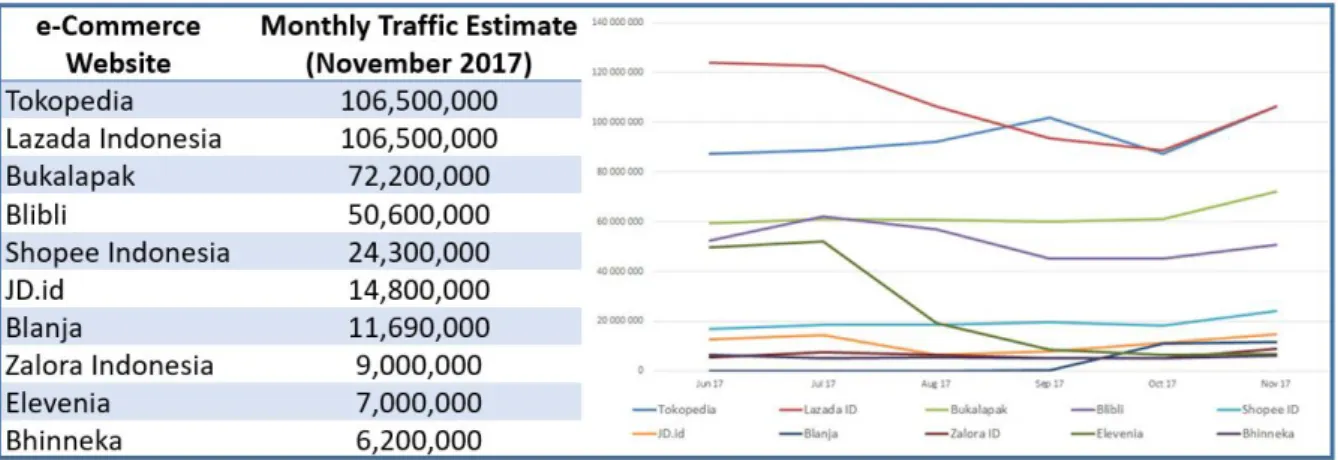
In 2017, e-commerce sales in Indonesia reach US$10.9 billion. This number increase about 41% than sales achieved in 2015, US$5.5 billion (Detik Inet, 2017). The main goal of every e-commerce is to get as many visitors as possible, so they can be potential buyer. Figure 2 shows the most popular e-commerce in Indonesia. As shown in Figure 3, in the last quarter in 2017, Tokopedia and Lazada Indonesia compete at the first and second position with the monthly visitor estimated around 106,500,000. Bukalapak, Blibli, and Shopee Indonesia managed to enter the top 5 e-commerce list with the most number of visitors.
12 Figure 3. Top e-commerce sites in Indonesia by estimate monthly traffic
Source: Asean Up (2018)
Related to mobile visits, Southeast Asia’s e-commerce is able to surpass economic growth in Western countries. Figure 4 shows e-commerce mobile traffic growth in Southeast Asia. There has been a massive increase in mobile visits to e-commerce in Southeast Asia. Within 12 months, mobile traffic has increased on average by 19%. Mobile visits now account for an average of 72% of total web traffic. Indonesia became the country with the highest mobile traffic share, which is 87%. Interestingly, there is no e-commerce in Southeast Asia that has desktop traffic of more than 30% of their total website traffic (iPrice, 2018).
Figure 4. E-Commerce mobile traffic in Southeast Asia
13 3.2 Indonesian Consumer Behavior
The number of smartphone user grows rapidly all over the world, including in Indonesia. This phenomenon seems to be in line with the increasing number of e-commerce users from websites and mobile applications. According Maulana (2018) an average of 87 percent of e-commerce visitors come from mobile usage. The finding further prove that the share of mobile device users has a considerable potential in earning higher number of visits.
Figure 5. Average transaction value and PDB per capita of Southeast Asia countries
Source: iPrice (2018)
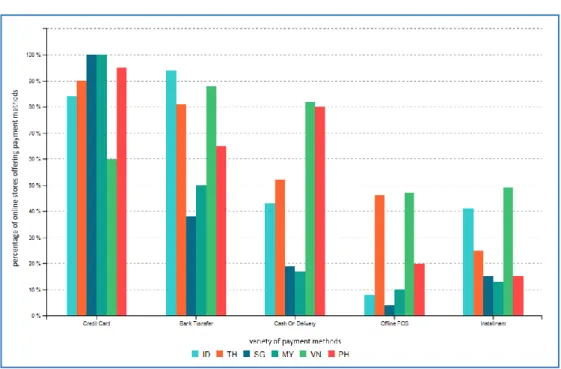
Figure 6. Popular payment methods provided in Southeast Asia based e-commerce
14 Although the mobile access accounts for an average of 87 percent of total traffic, the majority of consumers in Indonesia and other developing countries in Southeast Asia still prefer to purchase through desktop. The general behavior of Indonesian online consumers is looking for goods through mobile (smartphone or tablet) websites or apps, but when they decide to shop, they use a computer or a laptop (Maulana, 2018).
IPrice survey as shown in Figure 5 reported that on average, Indonesian consumer spending about Rp500.000 (about US$36) per month (Maulana, 2018). Figure 6 shows the popular payment method provided by e-commerce. Indonesian consumers still choose conventional payment methods such as cash on delivery and bank transfer. According to ecommerceIQ (2018) report, in January 2018, cash on delivery is the most payment method used with 52 percent of online shopper using followed by ATM/bank transfer (45 percent), and credit card (2 percent). Even though local e-commerce offers diverse payment methods, 94 percent of Indonesian based e-commerce still provide inter-bank transfer as their payment methods. In addition, the payment method with the least risk for online shopper, cash on delivery (COD), is also popular among Indonesian consumer. Forty-three percent of e-commerce is still offering COD as one of the payment method option. Trust issue is also the reason why COD is still widely used by Indonesian consumers although this method is actually not effective (Mustikasari, 2018).
The other payment method that differ Indonesian consumer behavior with western countries is the payment point in local convenience store such as Indomaret and Alfamart. If online shopping consumers do not have bank account, they are still able to purchase online by using payment point as the payment method. Consumers only need to bring the check-out code of their purchase and bring it to the nearest convenience store payment point. Consumers then pay cash to the cashier and get the payment receipt. Indonesian consumers tend to choose the conventional payment method. The reason is there are still many people who do not have bank accounts, which is about 150 million people. Indonesia’s Central Bank (BI) count roughly among 260 million people, there are 143 million debit card circulated and 17 million credit cards (Freischlad, 2017). Most of the debit card cannot be used for online shopping. Credit card penetration in Indonesia is also still the lowest compared to other countries in Southeast Asia. In 2015, credit card penetration in Indonesia only amounted to 1.6 percent (Mustikasari, 2018). Most of Southeast Asia country have low credit card penetration (below 5 percent) except Singapore with more than 38 percent penetration rate, so e-commerce players in that area provide more diverse payment method that suitable in each region (The Asian Banker, 2017).
15 There is less mature in e-commerce payment system in Indonesia. The payment system still be a classic problem for online business.
16
Chapter 4. Research Methodology
4.1. Sample and Data Collection
The research was targeted for specific groups as respondents that would provide the information necessary for this research and who must fit with some set criteria. The respondents were screened to ensure that they remember the last experience of using an online retailer website. The criteria for respondent selection were Indonesian internet users, who had visited, bought, or used the service offered by online retailers, at least once during the previous six months. The target population in this study was comprised of all Indonesian male and female adults’ individuals over the age of 17 years old.
In order to test the proposed model, a questionnaire was developed. Data collection was conducted through an online questionnaire using Google Docs, and the link shared on social media such as Facebook, LINE, and WhatsApp. Respondents were directed to a website containing the questionnaire via the shared link, for its self-administration. Respondents were instructed to respond based on the last online store that they used during the last six months. 4.2. Research Instrument and Construct Measurement
Overall e-service quality was defined as the overall excellence or superiority of the service (Zeithaml, 1988). The three items of overall e-service quality were adapted from Blut (2016). The constructs of the model were measured by combining items from WebQual, E-S-Qual, and eTailQ (Holloway & Beatty, 2008; Parasuraman et al., 2005; Wolfinbarger & Gilly, 2003). The measurement of e-service quality was assigned to four dimensions: website design, customer service, security/privacy, and fulfilment. Based on Blut (2016), e-service quality dimensions were operationalized as of a reflective-formative type (Ringle et al., 2012). The first order dimensions of website design consisted of eight attributes: information quality, website aesthetics, purchase process, website convenience, product selection, price offerings, website personalization, and system availability. The first order dimensions of customer service consisted of two attributes: service level and return handling/policies. The first order dimension of security/privacy consisted of two attributes: security and privacy. Lastly, the first order dimension of fulfilment consisted of three attributes: timeliness of delivery, order accuracy, and delivery condition.
The customer satisfaction scale was adapted from Fornell (1992) and customer trust was measured by six items adopted from Gefen (2002), Lee & Turban (2001) and Urban, Amyx, & Lorenzon (2009). Repurchase intention and WOM was measured with items adopted
17 from Zeithaml et al. (1996). Site revisit was developed from Gounaris et al. (2010). All of the constructs and reflective items were measured using a seven point scale ranging from 1 strongly disagree to 7 strongly agree (Table 1).
Table 1. Measurement of latent constructs
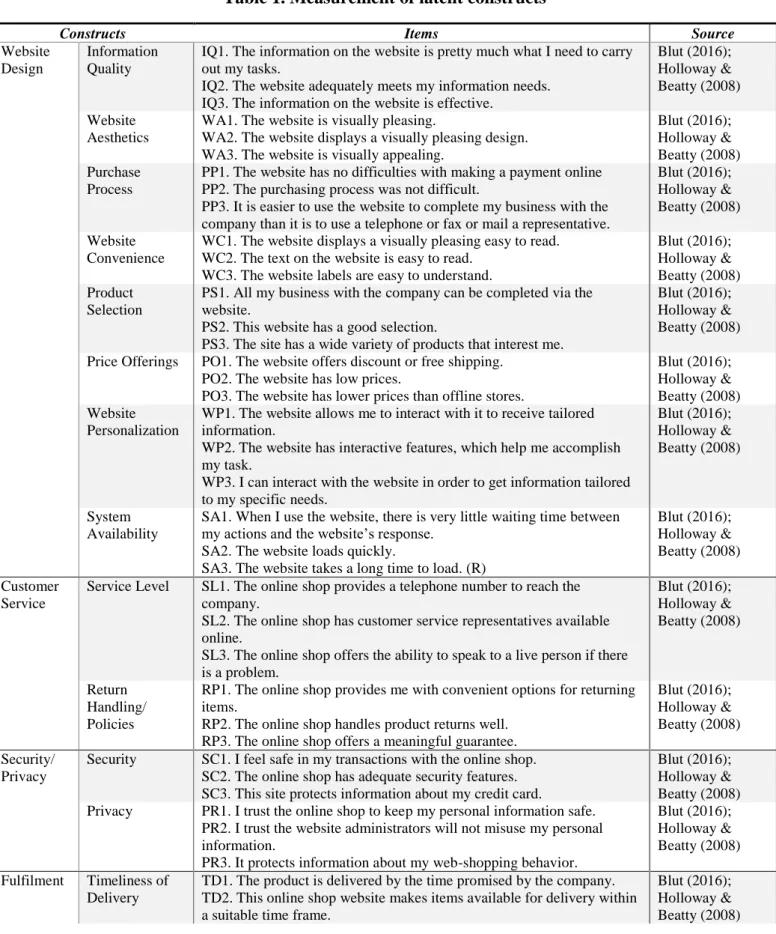
Constructs Items Source
Website Design
Information Quality
IQ1. The information on the website is pretty much what I need to carry out my tasks.
IQ2. The website adequately meets my information needs. IQ3. The information on the website is effective.
Blut (2016); Holloway & Beatty (2008) Website
Aesthetics
WA1. The website is visually pleasing.
WA2. The website displays a visually pleasing design. WA3. The website is visually appealing.
Blut (2016); Holloway & Beatty (2008) Purchase
Process
PP1. The website has no difficulties with making a payment online PP2. The purchasing process was not difficult.
PP3. It is easier to use the website to complete my business with the company than it is to use a telephone or fax or mail a representative.
Blut (2016); Holloway & Beatty (2008) Website
Convenience
WC1. The website displays a visually pleasing easy to read. WC2. The text on the website is easy to read.
WC3. The website labels are easy to understand.
Blut (2016); Holloway & Beatty (2008) Product
Selection
PS1. All my business with the company can be completed via the website.
PS2. This website has a good selection.
PS3. The site has a wide variety of products that interest me.
Blut (2016); Holloway & Beatty (2008)
Price Offerings PO1. The website offers discount or free shipping.
PO2. The website has low prices.
PO3. The website has lower prices than offline stores.
Blut (2016); Holloway & Beatty (2008) Website
Personalization
WP1. The website allows me to interact with it to receive tailored information.
WP2. The website has interactive features, which help me accomplish my task.
WP3. I can interact with the website in order to get information tailored to my specific needs. Blut (2016); Holloway & Beatty (2008) System Availability
SA1. When I use the website, there is very little waiting time between my actions and the website’s response.
SA2. The website loads quickly.
SA3. The website takes a long time to load. (R)
Blut (2016); Holloway & Beatty (2008) Customer
Service
Service Level SL1. The online shop provides a telephone number to reach the
company.
SL2. The online shop has customer service representatives available online.
SL3. The online shop offers the ability to speak to a live person if there is a problem. Blut (2016); Holloway & Beatty (2008) Return Handling/ Policies
RP1. The online shop provides me with convenient options for returning items.
RP2. The online shop handles product returns well. RP3. The online shop offers a meaningful guarantee.
Blut (2016); Holloway & Beatty (2008) Security/
Privacy
Security SC1. I feel safe in my transactions with the online shop.
SC2. The online shop has adequate security features. SC3. This site protects information about my credit card.
Blut (2016); Holloway & Beatty (2008)
Privacy PR1. I trust the online shop to keep my personal information safe.
PR2. I trust the website administrators will not misuse my personal information.
PR3. It protects information about my web-shopping behavior.
Blut (2016); Holloway & Beatty (2008)
Fulfilment Timeliness of
Delivery
TD1. The product is delivered by the time promised by the company. TD2. This online shop website makes items available for delivery within a suitable time frame.
Blut (2016); Holloway & Beatty (2008)
18
Constructs Items Source
TD3. It quickly delivers what I order.
Order Accuracy OA1. You get what you ordered from this website.
OA2. The website sends out the items ordered. OA3. The website is truthful about its offerings.
Blut (2016); Holloway & Beatty (2008) Delivery
Condition
DC1. The product was damaged during delivery. (R) DC2. The ordered products arrived in a good condition. DC3. The products arrived with a major damage. (R)
Blut (2016); Holloway & Beatty (2008)
Overall e-Service Quality SQ1. Overall. my purchase experience with this online shop is excellent
SQ2. The overall quality of the service provided by this online shop is excellent
SQ3. My overall feelings toward this online shop are very satisfied
Blut (2016)
Customer Satisfaction S1. I am satisfied with this online shop.
S2. The online shop is getting close to the ideal online retailer. S3. The online shop always meets my needs.
Fornell (1992)
Customer Trust T1. One can expect good advice from this online shop.*
T2. This online shop is genuinely interested in customer’s welfare. T3. If problems arise, one can expect to be treated fairly by this online shop.
T4. I am happy with the standards by which this online shop is operating. T5. This online shop operates scrupulously.
T6. You can believe the statements of this online shop.
Gefen (2002); Lee & Turban (2001); Urban et al. (2009)
Repurchase Intention RI1. I will do more purchases through this online shop in the future.
RI2. I will increase purchases through this online shop. RI3. I will intensify purchases through this online shop.
Zeithaml et al. (1996)
Word of Mouth WOM1. I say positive things about this online shop to other people.
WOM2. I recommend this online shop to someone who seeks my advice. WOM3. I encourage friends and others to do purchase goods from this online shop.
Zeithaml et al. (1996)
Site Revisit SR1. I will not to shop again from this online shop. (R)*
SR2. I will make next purchase from this online shop. SR3. I will re-visit this online shop in the future.
Gounaris et al. (2010) Note: * items have been excluded due to low validity
4.3. Measurement Model
To assess the validity and reliability of the measurement, this research used partial least square (PLS) path modelling as implemented in SmartPLS software. Composite reliability (CR), factor loading, and average variance extracted (AVE) were used to test the convergent validity. It is acceptable if an individual item factor loading is greater than 0.70, composite reliability exceeds 0.70 and AVE exceed 0.50 (Gefen et al., 2000). Factor loading exceeding 0.50 is acceptable, while a value exceeding 0.70 shows strong evidence of convergent validity (Bagozzi & Yi, 1988). All the factor loadings estimates exceeded 0.70, except T1 and SR1 (for these reasons these were eliminated), and Bootstrap t-statistics showed strong evidence of convergent validity. As shown in Table 3, AVE of each reflective construct in this research also exceeded 0.50 (ranging from 0.641 to 0.880). The AVE indicated that most of the variance of each indicator was explained by its own construct. Thus, the convergent validity was confirmed.
19 To assess the discriminant validity, this research used three measures: Fornell-Lacker criterion, cross-loadings, and heterotrait-monotrait (HTMT) ratio of correlations criterion. According to Hair et al. (2010), discriminant validity ensures that a construct measure is empirically unique and represents phenomena of interest that other measures in a structural equation model do not capture. Discriminant validity is established if a latent variable accounts for more variance in its associated indicator variables that it shares with other construct in the same model (Fornell & Larcker, 1981). Table 2 shows the square root of AVEs (in bold) compared with other constructs correlation. Since the square roots of AVEs were higher than correlation between other constructs, it met the acceptable discrimination. A second approach for establishing discriminant validity is cross-loadings. According to Chin (1998), each indicator loading should be greater than all cross-loadings. Table 3 shows that each indicator loading (in bold) is greater than all of its cross-loadings. The third approach is heterotrait-monotrait (HTMT) ratio of correlations. If HTMT value is below 0.90, discriminant validity has been established between two reflective constructs (Henseler et al., 2014). As shown in Table 4, all construct had HTMT value below 0.90. Thus, the discriminant validity of the measurement model was also established.
Cronbach’s alpha can assess the internal consistency reliability of the instruments. Cronbach’s alpha should be 0.7 or higher, for exploratory purposes, but 0.6 or higher is also acceptable (Hair et al., 2011). As illustrated in Table 2, all reflective constructs proved to be reliable since all Cronbach’s alpha were greater than 0.7 (ranging from 0.770 to 0.931).
20 Table 2. Cronbach's alpha, composite reliability (CR), AVE, and Fornell-Lacker Criterion
Cronbach’s
Alpha CR AVE IQ WA PP WC PS PO WP SA SL RP SC PR TD OA DC SQ S TD RI WOM SR
IQ 0.868 0.919 0.792 0.890 WA 0.887 0.930 0.815 0.615 0.903 PP 0.782 0.874 0.698 0.526 0.412 0.836 WC 0.892 0.933 0.823 0.611 0.692 0.598 0.907 PS 0.816 0.892 0.734 0.583 0.549 0.610 0.709 0.857 PO 0.780 0.873 0.696 0.488 0.390 0.266 0.325 0.343 0.834 WP 0.834 0.901 0.752 0.471 0.315 0.274 0.291 0.318 0.638 0.867 SA 0.770 0.867 0.686 0.471 0.396 0.277 0.320 0.298 0.574 0.544 0.828 SL 0.774 0.869 0.689 0.405 0.266 0.128 0.238 0.283 0.395 0.588 0.393 0.830 RP 0.876 0.924 0.802 0.419 0.292 0.214 0.242 0.308 0.442 0.510 0.386 0.615 0.895 SC 0.837 0.903 0.758 0.463 0.293 0.222 0.275 0.270 0.470 0.531 0.543 0.430 0.621 0.871 PR 0.895 0.935 0.827 0.448 0.299 0.205 0.264 0.296 0.416 0.444 0.421 0.418 0.545 0.701 0.910 TD 0.896 0.935 0.828 0.487 0.348 0.260 0.288 0.309 0.527 0.586 0.651 0.523 0.439 0.503 0.487 0.910 OA 0.876 0.924 0.802 0.475 0.354 0.245 0.318 0.340 0.572 0.594 0.634 0.443 0.514 0.646 0.584 0.779 0.896 DC 0.734 0.842 0.641 0.425 0.282 0.121 0.203 0.220 0.419 0.434 0.489 0.347 0.368 0.491 0.367 0.510 0.621 0.800 SQ 0.915 0.946 0.855 0.554 0.398 0.294 0.355 0.374 0.561 0.609 0.595 0.385 0.507 0.655 0.516 0.677 0.750 0.555 0.925 S 0.855 0.911 0.774 0.522 0.341 0.285 0.337 0.328 0.584 0.607 0.590 0.379 0.551 0.691 0.597 0.609 0.749 0.543 0.791 0.880 TD 0.908 0.931 0.731 0.482 0.327 0.241 0.289 0.331 0.535 0.679 0.615 0.498 0.532 0.632 0.625 0.681 0.730 0.511 0.719 0.795 0.855 RI 0.914 0.946 0.853 0.384 0.287 0.219 0.241 0.258 0.473 0.528 0.534 0.350 0.420 0.457 0.375 0.501 0.579 0.419 0.619 0.722 0.696 0.924 WOM 0.931 0.956 0.880 0.523 0.326 0.261 0.321 0.362 0.564 0.593 0.528 0.369 0.478 0.593 0.512 0.516 0.679 0.491 0.713 0.780 0.755 0.803 0.938 SR 0.849 0.930 0.869 0.390 0.225 0.164 0.220 0.238 0.465 0.565 0.539 0.422 0.522 0.547 0.429 0.510 0.603 0.519 0.682 0.723 0.705 0.768 0.750 0.932
Notes: IQ: Information Quality; WA: Website Aesthetics; PP: Purchase Process; WC: Website Convenience; PS: Product Selection; PO: Price Offerings; WP: Website Personalization; SA: System Availability; SL: Service Level; RP: Return Handling/Policies; SC: Security; PR: Privacy; TD: Timeliness of Delivery; OA: Order Accuracy; DC: Delivery Condition; SQ: Overall Service Quality;
21 Table 3. Cross-loadings IQ WA PP WC PS PO WP SA SL RP SC PR TD OA DC SQ S T RI WOM SR IQ1 0.919 0.546 0.489 0.596 0.554 0.501 0.536 0.462 0.471 0.421 0.468 0.495 0.496 0.503 0.442 0.593 0.542 0.526 0.380 0.565 0.436 IQ2 0.906 0.520 0.462 0.482 0.536 0.420 0.424 0.452 0.377 0.385 0.437 0.376 0.441 0.423 0.404 0.478 0.451 0.419 0.344 0.457 0.350 IQ3 0.842 0.583 0.453 0.551 0.462 0.373 0.279 0.336 0.214 0.305 0.321 0.310 0.355 0.330 0.278 0.392 0.389 0.328 0.296 0.359 0.240 WA1 0.547 0.877 0.410 0.661 0.545 0.328 0.266 0.333 0.235 0.258 0.222 0.255 0.304 0.332 0.270 0.341 0.301 0.278 0.260 0.298 0.208 WA2 0.522 0.921 0.310 0.594 0.426 0.354 0.288 0.351 0.246 0.263 0.276 0.261 0.303 0.301 0.247 0.352 0.298 0.293 0.216 0.233 0.160 WA3 0.594 0.910 0.391 0.618 0.512 0.375 0.299 0.388 0.238 0.270 0.294 0.292 0.335 0.324 0.248 0.384 0.325 0.315 0.299 0.347 0.238 PP1 0.411 0.302 0.861 0.466 0.506 0.220 0.251 0.235 0.106 0.196 0.196 0.186 0.257 0.243 0.100 0.254 0.249 0.212 0.171 0.191 0.111 PP2 0.448 0.398 0.868 0.519 0.510 0.215 0.205 0.255 0.083 0.182 0.178 0.164 0.214 0.184 0.102 0.234 0.232 0.197 0.209 0.200 0.145 PP3 0.458 0.327 0.775 0.512 0.512 0.232 0.231 0.201 0.132 0.159 0.182 0.164 0.181 0.189 0.100 0.250 0.233 0.196 0.168 0.264 0.155 WC1 0.579 0.740 0.502 0.908 0.597 0.355 0.297 0.294 0.189 0.246 0.283 0.266 0.281 0.299 0.181 0.373 0.353 0.286 0.249 0.313 0.210 WC2 0.535 0.593 0.590 0.931 0.639 0.262 0.250 0.260 0.208 0.198 0.226 0.229 0.247 0.270 0.165 0.307 0.294 0.244 0.207 0.275 0.189 WC3 0.546 0.543 0.539 0.882 0.695 0.263 0.244 0.319 0.251 0.212 0.238 0.220 0.254 0.295 0.207 0.282 0.268 0.253 0.198 0.285 0.200 PS1 0.417 0.461 0.438 0.522 0.750 0.181 0.183 0.222 0.207 0.219 0.221 0.262 0.210 0.244 0.155 0.251 0.201 0.263 0.172 0.230 0.134 PS2 0.540 0.488 0.552 0.631 0.902 0.347 0.286 0.263 0.259 0.306 0.237 0.262 0.297 0.314 0.213 0.366 0.332 0.277 0.250 0.332 0.209 PS3 0.532 0.467 0.567 0.659 0.908 0.335 0.332 0.277 0.257 0.263 0.236 0.244 0.279 0.310 0.194 0.334 0.297 0.310 0.235 0.356 0.256 PO1 0.382 0.335 0.239 0.273 0.254 0.779 0.436 0.455 0.324 0.311 0.316 0.240 0.419 0.422 0.330 0.335 0.402 0.364 0.340 0.333 0.301 PO2 0.406 0.315 0.220 0.290 0.284 0.876 0.549 0.484 0.359 0.350 0.357 0.345 0.448 0.474 0.321 0.511 0.462 0.428 0.367 0.463 0.381 PO3 0.432 0.329 0.209 0.252 0.318 0.845 0.603 0.497 0.308 0.439 0.495 0.446 0.452 0.531 0.396 0.545 0.589 0.539 0.471 0.602 0.475 WP1 0.433 0.308 0.239 0.235 0.294 0.581 0.817 0.454 0.450 0.428 0.515 0.454 0.487 0.563 0.466 0.570 0.546 0.569 0.493 0.582 0.487 WP2 0.398 0.218 0.198 0.226 0.240 0.563 0.904 0.476 0.516 0.425 0.422 0.332 0.533 0.497 0.378 0.478 0.522 0.613 0.437 0.483 0.488 WP3 0.394 0.290 0.272 0.295 0.290 0.515 0.878 0.483 0.563 0.471 0.440 0.365 0.504 0.484 0.285 0.534 0.507 0.583 0.441 0.475 0.493 SA1 0.314 0.250 0.173 0.186 0.149 0.447 0.446 0.781 0.350 0.365 0.432 0.311 0.487 0.488 0.233 0.428 0.454 0.497 0.424 0.362 0.409 SA2 0.415 0.331 0.256 0.287 0.268 0.536 0.511 0.903 0.338 0.351 0.518 0.336 0.560 0.552 0.401 0.539 0.547 0.510 0.488 0.468 0.475 SA3 0.430 0.393 0.249 0.310 0.306 0.440 0.395 0.796 0.294 0.252 0.396 0.395 0.564 0.531 0.554 0.502 0.460 0.524 0.414 0.470 0.451 SL1 0.330 0.247 0.039 0.175 0.273 0.251 0.435 0.286 0.779 0.448 0.332 0.316 0.367 0.344 0.283 0.306 0.287 0.359 0.268 0.304 0.324 SL2 0.353 0.258 0.150 0.233 0.243 0.320 0.462 0.311 0.863 0.496 0.368 0.380 0.496 0.379 0.338 0.320 0.314 0.441 0.268 0.285 0.379 SL3 0.328 0.163 0.122 0.183 0.194 0.403 0.561 0.375 0.846 0.578 0.370 0.344 0.435 0.378 0.246 0.331 0.340 0.435 0.331 0.329 0.348 RP1 0.409 0.294 0.233 0.238 0.315 0.432 0.468 0.323 0.573 0.908 0.514 0.466 0.376 0.449 0.337 0.421 0.506 0.471 0.379 0.422 0.447 RP2 0.358 0.259 0.209 0.189 0.257 0.389 0.465 0.302 0.551 0.923 0.581 0.536 0.389 0.449 0.269 0.452 0.483 0.445 0.391 0.420 0.444 RP3 0.359 0.232 0.130 0.223 0.255 0.366 0.437 0.417 0.525 0.853 0.576 0.461 0.416 0.483 0.387 0.491 0.491 0.516 0.359 0.444 0.517 SC1 0.418 0.246 0.175 0.244 0.230 0.401 0.513 0.548 0.405 0.502 0.903 0.568 0.517 0.647 0.496 0.681 0.670 0.628 0.452 0.600 0.579 SC2 0.391 0.262 0.182 0.230 0.217 0.443 0.493 0.477 0.363 0.589 0.913 0.587 0.469 0.594 0.443 0.636 0.630 0.584 0.409 0.544 0.493 SC3 0.399 0.255 0.223 0.244 0.256 0.381 0.377 0.390 0.354 0.529 0.790 0.676 0.323 0.441 0.340 0.387 0.500 0.434 0.329 0.400 0.353 PR1 0.441 0.295 0.196 0.270 0.286 0.447 0.422 0.371 0.386 0.529 0.727 0.921 0.443 0.533 0.357 0.502 0.574 0.581 0.339 0.483 0.405 PR2 0.422 0.280 0.195 0.271 0.284 0.375 0.388 0.411 0.375 0.511 0.637 0.947 0.462 0.554 0.334 0.479 0.560 0.548 0.317 0.455 0.387 PR3 0.352 0.237 0.166 0.170 0.235 0.304 0.402 0.366 0.383 0.443 0.537 0.859 0.423 0.508 0.307 0.424 0.491 0.580 0.372 0.460 0.380 TD1 0.448 0.300 0.239 0.288 0.300 0.473 0.503 0.513 0.501 0.322 0.326 0.367 0.880 0.610 0.419 0.564 0.484 0.557 0.390 0.389 0.351 TD2 0.430 0.311 0.229 0.253 0.255 0.478 0.539 0.629 0.461 0.420 0.517 0.433 0.923 0.758 0.483 0.622 0.591 0.632 0.482 0.519 0.512 TD3 0.454 0.339 0.242 0.249 0.290 0.489 0.556 0.628 0.469 0.448 0.517 0.521 0.925 0.749 0.487 0.657 0.582 0.664 0.491 0.492 0.517 OA1 0.399 0.295 0.181 0.276 0.275 0.478 0.494 0.574 0.367 0.420 0.629 0.538 0.678 0.918 0.616 0.670 0.681 0.603 0.463 0.552 0.557 OA2 0.449 0.354 0.228 0.305 0.345 0.540 0.565 0.579 0.406 0.508 0.589 0.505 0.744 0.925 0.611 0.730 0.663 0.635 0.473 0.596 0.541
22 OA3 0.430 0.299 0.254 0.272 0.292 0.522 0.540 0.550 0.421 0.451 0.513 0.532 0.669 0.841 0.428 0.610 0.671 0.734 0.635 0.688 0.524 DC1 0.338 0.222 0.099 0.182 0.175 0.204 0.250 0.326 0.195 0.260 0.299 0.191 0.278 0.349 0.813 0.312 0.330 0.297 0.261 0.302 0.354 DC2 0.368 0.256 0.130 0.168 0.206 0.484 0.517 0.493 0.379 0.390 0.541 0.461 0.573 0.683 0.820 0.586 0.591 0.594 0.492 0.549 0.541 DC3 0.303 0.185 0.042 0.138 0.134 0.237 0.181 0.301 0.204 0.180 0.257 0.135 0.285 0.356 0.766 0.357 0.297 0.235 0.165 0.242 0.281 SQ1 0.538 0.389 0.291 0.330 0.383 0.537 0.561 0.514 0.393 0.507 0.636 0.486 0.585 0.672 0.545 0.928 0.735 0.643 0.563 0.656 0.635 SQ2 0.489 0.346 0.289 0.343 0.348 0.503 0.557 0.522 0.345 0.467 0.558 0.454 0.618 0.711 0.458 0.925 0.709 0.660 0.570 0.673 0.626 SQ3 0.509 0.369 0.237 0.312 0.307 0.515 0.572 0.613 0.330 0.433 0.622 0.492 0.673 0.697 0.534 0.921 0.748 0.691 0.582 0.650 0.630 S1 0.500 0.363 0.248 0.324 0.316 0.551 0.580 0.578 0.461 0.546 0.655 0.542 0.651 0.796 0.647 0.819 0.912 0.750 0.701 0.751 0.747 S2 0.447 0.238 0.204 0.266 0.245 0.538 0.478 0.517 0.288 0.483 0.640 0.529 0.472 0.578 0.392 0.644 0.880 0.648 0.573 0.668 0.571 S3 0.425 0.287 0.303 0.297 0.300 0.445 0.536 0.453 0.224 0.415 0.520 0.506 0.462 0.574 0.357 0.599 0.846 0.694 0.621 0.629 0.570 T2 0.337 0.210 0.229 0.195 0.249 0.466 0.564 0.553 0.352 0.422 0.444 0.410 0.554 0.537 0.340 0.590 0.664 0.831 0.664 0.643 0.619 T3 0.433 0.299 0.201 0.277 0.293 0.463 0.626 0.524 0.490 0.449 0.520 0.539 0.622 0.662 0.438 0.609 0.683 0.887 0.560 0.621 0.559 T4 0.422 0.333 0.222 0.300 0.296 0.533 0.630 0.607 0.462 0.482 0.626 0.579 0.637 0.723 0.518 0.678 0.769 0.899 0.611 0.670 0.623 T5 0.453 0.277 0.234 0.228 0.291 0.418 0.565 0.421 0.488 0.508 0.502 0.522 0.516 0.546 0.465 0.553 0.614 0.805 0.515 0.575 0.598 T6 0.424 0.280 0.152 0.234 0.287 0.402 0.520 0.512 0.351 0.422 0.601 0.617 0.577 0.641 0.428 0.636 0.659 0.850 0.613 0.707 0.611 RI1 0.379 0.270 0.200 0.221 0.262 0.457 0.458 0.439 0.247 0.368 0.451 0.419 0.439 0.558 0.414 0.611 0.685 0.645 0.914 0.779 0.725 RI2 0.303 0.240 0.185 0.172 0.198 0.457 0.503 0.557 0.326 0.364 0.422 0.325 0.510 0.572 0.378 0.574 0.673 0.654 0.935 0.705 0.730 RI3 0.385 0.287 0.224 0.277 0.257 0.393 0.501 0.484 0.399 0.435 0.390 0.292 0.439 0.471 0.367 0.527 0.641 0.629 0.922 0.740 0.672 WOM1 0.537 0.334 0.261 0.324 0.341 0.561 0.573 0.518 0.394 0.485 0.625 0.503 0.523 0.681 0.482 0.705 0.773 0.747 0.762 0.951 0.741 WOM2 0.495 0.281 0.239 0.297 0.349 0.552 0.594 0.449 0.371 0.452 0.512 0.455 0.472 0.645 0.475 0.678 0.748 0.730 0.748 0.952 0.714 WOM3 0.434 0.302 0.233 0.280 0.329 0.468 0.497 0.521 0.263 0.404 0.529 0.483 0.453 0.579 0.421 0.620 0.667 0.641 0.751 0.910 0.651 SR2 0.321 0.161 0.101 0.149 0.163 0.416 0.559 0.520 0.369 0.507 0.524 0.371 0.478 0.562 0.426 0.634 0.696 0.672 0.749 0.705 0.937 SR3 0.409 0.261 0.209 0.266 0.285 0.452 0.492 0.485 0.420 0.466 0.496 0.431 0.472 0.562 0.545 0.637 0.651 0.641 0.681 0.694 0.927
Notes: IQ: Information Quality; WA: Website Aesthetics; PP: Purchase Process; WC: Website Convenience; PS: Product Selection; PO: Price Offerings; WP: Website Personalization; SA: System Availability; SL: Service Level; RP: Return Handling/Policies; SC: Security; PR: Privacy; TD: Timeliness of Delivery; OA: Order Accuracy; DC: Delivery Condition; SQ: Overall Service Quality;
23 Table 4. Heterotrait-monotrait (HTMT) ratio
IQ WA PP WC PS PO WP SA SL RP SC PR TD OA DC SQ S T RI WOM IQ WA 0.703 PP 0.639 0.491 WC 0.693 0.774 0.717 PS 0.688 0.648 0.760 0.830 PO 0.589 0.470 0.342 0.389 0.420 WP 0.545 0.365 0.339 0.336 0.378 0.787 SA 0.568 0.474 0.351 0.381 0.367 0.740 0.679 SL 0.487 0.324 0.170 0.287 0.359 0.504 0.729 0.510 RP 0.478 0.331 0.258 0.273 0.363 0.532 0.596 0.478 0.743 SC 0.539 0.340 0.275 0.318 0.328 0.578 0.634 0.675 0.535 0.727 PR 0.500 0.333 0.244 0.291 0.349 0.489 0.513 0.506 0.503 0.614 0.807 TD 0.550 0.390 0.311 0.323 0.360 0.631 0.677 0.778 0.628 0.493 0.574 0.540 OA 0.541 0.400 0.299 0.359 0.400 0.692 0.696 0.772 0.540 0.588 0.752 0.662 0.875 DC 0.517 0.339 0.148 0.249 0.274 0.504 0.501 0.602 0.428 0.430 0.577 0.399 0.576 0.709 SQ 0.615 0.441 0.348 0.392 0.430 0.658 0.696 0.704 0.457 0.568 0.746 0.569 0.745 0.836 0.632 S 0.599 0.386 0.350 0.383 0.385 0.708 0.715 0.721 0.452 0.633 0.813 0.681 0.683 0.855 0.617 0.883 T 0.539 0.365 0.288 0.320 0.386 0.631 0.781 0.734 0.596 0.601 0.722 0.694 0.752 0.822 0.571 0.787 0.898 RI 0.430 0.318 0.259 0.267 0.297 0.557 0.604 0.637 0.416 0.471 0.521 0.416 0.551 0.653 0.462 0.676 0.812 0.761 WOM 0.573 0.357 0.306 0.351 0.411 0.653 0.670 0.620 0.430 0.529 0.670 0.561 0.560 0.755 0.544 0.771 0.867 0.816 0.871 SR 0.450 0.260 0.204 0.255 0.284 0.569 0.670 0.665 0.522 0.607 0.648 0.494 0.580 0.700 0.618 0.774 0.838 0.802 0.870 0.842
Notes: IQ: Information Quality; WA: Website Aesthetics; PP: Purchase Process; WC: Website Convenience; PS: Product Selection; PO: Price Offerings; WP: Website Personalization; SA: System Availability; SL: Service Level; RP: Return Handling/Policies; SC: Security; PR: Privacy; TD: Timeliness of Delivery; OA: Order Accuracy; DC: Delivery Condition; SQ: Overall Service Quality;
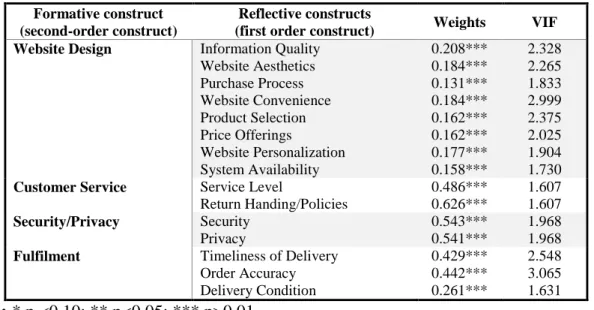
24 In this study, e-service quality dimensions: website design, customer service, security/privacy, and fulfilment were second order constructs with reflective-formative type (Ringle et al., 2012). Each of their first order constructs were reflective and the relationships between e-service quality attributes (first order constructs) and the e-service quality dimensions (second order constructs) were formative. Hence, multi-collinearity test as well as the significance and the sign of weights test were computed. Based on the test of significance and the sign of weights, all four e-service quality dimensions were statistically significant (p<0.01) and all of them had positive signs. Table 5 shows that all VIF values of first order constructs (ranging from 1.607 to 3.065) were below the threshold of 3.3 (Lee & Xia, 2010), the extent of multi-collinearity was concluded to be non-problematic. Thus, the formative construct could be used to test the structural model.
Table 5. Formative measurement model evaluation
Formative construct (second-order construct)
Reflective constructs
(first order construct) Weights VIF
Website Design Information Quality
Website Aesthetics Purchase Process Website Convenience Product Selection Price Offerings Website Personalization System Availability 0.208*** 0.184*** 0.131*** 0.184*** 0.162*** 0.162*** 0.177*** 0.158*** 2.328 2.265 1.833 2.999 2.375 2.025 1.904 1.730
Customer Service Service Level
Return Handing/Policies 0.486*** 0.626*** 1.607 1.607 Security/Privacy Security Privacy 0.543*** 0.541*** 1.968 1.968
Fulfilment Timeliness of Delivery
Order Accuracy Delivery Condition 0.429*** 0.442*** 0.261*** 2.548 3.065 1.631 Notes: * p <0.10; ** p<0.05; *** p>0.01.
25
Chapter 5. Data Analysis and Discussion
5.1. Hypotheses Testing
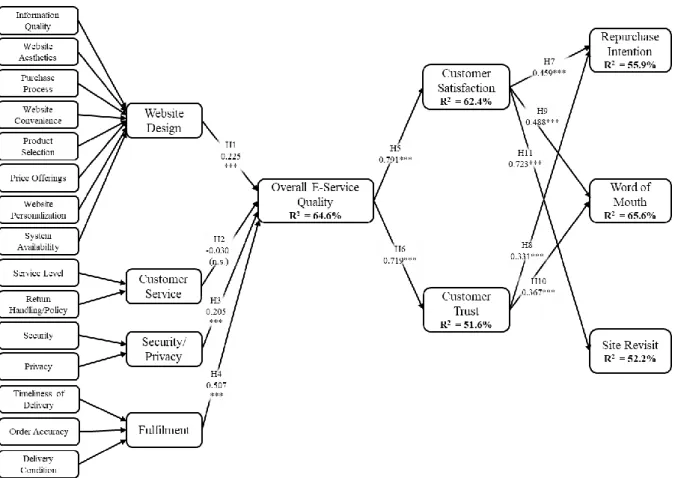
In the hypotheses testing, eleven paths were examined in the structural model. Hypotheses were tested based on the level of significance in the path coefficient using the bootstrapping technique (Hair et al., 2011) with 5000 iterations of re-sampling, and each bootstrap sample constituted by the number of observations (in this case 355 cases). The test showed that of the eleven path coefficients, ten hypotheses were supported, while one hypothesis failed to be confirmed. The result of hypotheses testing is shown in Figure 2.
Figure 2. Estimated Model
Notes: (n.s.) = not significant; * p <0.10; ** p<0.05; *** p>0.01.
The conceptual model explained 64.6% of the variation in overall service quality. The hypothesis of web design (𝛽̂ = 0.225; p < 0.01), security/privacy (𝛽̂ = 0.205; p < 0.01), and fulfilment (𝛽̂ = 0.507; p < 0.01) are statistically significant. Nevertheless, customer service (𝛽̂ = -0.001; p > 0.10) is not statistically significant. Therefore, hypotheses H1, H3, and H4 are supported, however H2 is not supported to explain overall e-service quality.
26 The conceptual model explained 62.4% of the variation in customer satisfaction and also explained 51.6% of the variation in customer trust. The hypothesis of overall service quality influence on customer satisfaction (𝛽̂ = 0.791; p < 0.01) and the hypothesis of overall service quality influence on customer trust (𝛽̂ = 0.719; p < 0.01) are statistically significant. Therefore, hypotheses H5 and H6 are supported.
The conceptual model explained 55.9% of the variation in repurchase intention. The hypothesis of customer satisfaction impact on repurchase intention (𝛽̂ = 0.459; p < 0.01) and the hypothesis of customer trust impact on repurchase intention (𝛽̂ = 0.331; p < 0.01) are statistically significant. Therefore, hypotheses H7 and H8 are supported to explain repurchase intention.
The conceptual model explained 65.6% of the variation in WOM. The hypothesis of customer satisfaction influence on WOM (𝛽̂ = 0.488; p < 0.01), and customer trust influence on WOM (𝛽̂ = 0.367; p < 0.01) are statistically significant. Therefore, hypotheses H9 and H10 are supported to explain WOM.
The conceptual model explained 52.2% of the variation in site revisit. The hypothesis of customer satisfaction impact on site revisit (𝛽̂ = 0.723; p < 0.01) is statistically significant. Therefore, hypotheses H11 is supported to explain site revisit.
5.2. Discussion
This study was designed to investigate e-service quality in online business and develop new knowledge to understand the most important dimensions of e-service quality. The study also aimed to enhance prior understanding of how e-service quality affected customer behavior, i.e. customer satisfaction, customer trust, repurchase intention, WOM, and site revisit.
Previous studies suggested to apply the e-service quality measurement to other countries to test whether the measurement worked equally well in a different country and culture setting. Through the conducted study, it was found that three out of four dimension of service quality (website design, security/privacy, and fulfilment) had positive impact on e-service quality, whereas customer e-service dimension did not have impact on e-e-service quality. Thus, a company needs to pay attention to these dimensions more specifically and seek breakthroughs that can improve its performance and e-service quality. Literature emphasizes the strong relation of e-service quality dimensions to build the perception of overall e-service quality. Website design has the highest impact on e-service quality while customer service has
27 the lowest impact (Blut, 2016). In this study, fulfilment had the highest impact on e-service quality. Website design and security/privacy had almost the same impact on e-service quality. Surprisingly, in the Indonesian context, customer service was not relevant to build the perception of overall e-service quality of an online store. According to Wolfinbarger & Gilly(2003), not all customer need customer service in each transaction, so customer service is only scantily related to quality. Contrary, in Blut et al. (2015) study, security was not relevant to overall e-service quality in the four-dimension e-service quality model. Meanwhile, Wolfinbarger & Gilly (2003) found that customer service and security were not significant to e-service quality.
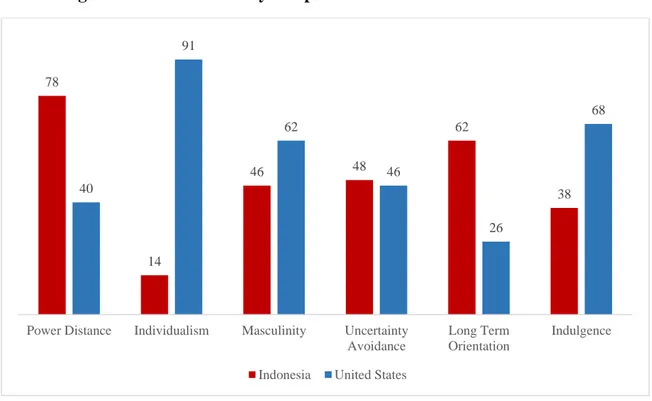
Figure 7. Hofstede country comparison: Indonesia and United States
Source: Hofstede Insight Website (n.d.)
Different country culture may give different outcomes on which attributes and dimension of e-service quality matters to create the perception of overall e-service quality. Thus, the result of this study compared with previous study that used same e-service quality measurements. The previous study done by Blut (2016) examined online shoppers is the U.S. Figure 7 shows that Indonesia and U.S. have different country culture in terms of power distance, individualism, and long term orientation. Blut et al. (2015) found that collectivism strengthen the association between fulfilment and overall e-service quality. In line with this
78 14 46 48 62 38 40 91 62 46 26 68
Power Distance Individualism Masculinity Uncertainty
Avoidance
Long Term Orientation
Indulgence