Universidade NOVA de Lisboa, NOVA Medical School / Faculdade de Ciências Médicas;
Addressing the Treatment Gap for
Children in Statutory Care:
Evaluating the effectiveness of the Psychological
Services Business Plan 2016/2017 using ACI
Framework
Student: Lucia Anna Britton
This work project is submitted in partial fulfilment of the requirements for the International Masters of Mental Health Policy and Services Academic Supervisor: Professor Miguel Xavier,
NOVA Medical School.
Key words: Service Evaluation - Children in Care - Treatment Gap - ACI Framework
Overview
This report is written in two parts. The first part of the report outlines the initial project proposal to conduct an internal formative and process evaluation to test the effectiveness of Psychological Services Business Plan and identify any changes or modifications that may be needed to enhance the probability or the service achieving their goals by end of 2017. Using the NSW Agency for Clinical Innovation (ACI) Framework and program logic, outcomes and outputs are identified and tested through impact measures.
The second part of the report outlines the finding of the evaluation on the identified impact
measures. Overall, the results indicate good progress towards the program outcomes and strategic goal, indicating utility of some of the changes made. A process review was also undertaken to evaluate how well the Business Plan was implemented and communicated to key stakeholders. The results are discussed in term of the strengths, weaknesses, opportunities and threats for achieving the desired change.
Resumo
Este relatório foi escrito em duas partes. Na primeira parte descreve-se a proposta inicial do projeto, mais concretamente a realização de uma avaliação interna formativa e de processo, com o objectivo de avaliar a efectividade de um programa de prestação de cuidados implementado em diversos serviços de saúde mental australianos. Esta proposta incluiu também a identificação de alterações potencialmente necessárias para aumentar a probabilidade de os serviços alcançarem os seus objetivos até ao final de 2017. A identificação da lógica processual, assim como a avaliação dos resultados e dos ‘outputs’ dos serviços, foi efectuada através de metodologia desenvolvida pela NSW Agency for Clinical Innovation (Australia).
Na segunda parte do relatório, descrevem-se os resultados desta avaliação a nível dos principais indicadores de impacto. Globalmente, os resultados indicaram uma boa efectividade no atingimento dos objectivos estratégicos do programa, sugerindo a utilidade de algumas das mudanças efectuadas. Descreve-se igualmente a análise de processo sobre a efectividade da implementação e da comunicação aos principais intervenientes directos. Os resultados são discutidos em função dos seus pontos fortes, fracos, oportunidades e ameaças para alcançar a mudança desejada.
Resumen
Este informe está escrito en dos partes. La primera parte del informe esboza la propuesta inicial del proyecto para llevar a cabo una evaluación interna formativa y de proceso para probar la efectividad del Plan de Negocios de Servicios Psicológicos e identificar cualquier cambio o modificación que pueda ser necesario para aumentar la probabilidad del servicio lograr sus objetivos al final De 2017. Utilizando el Marco de la Agencia de Innovación Clínica (ACI) de NSW y la lógica del programa, los resultados y productos se identifican y se prueban a través de medidas de impacto.
La segunda parte del informe esboza los resultados de la evaluación sobre las medidas de impacto identificadas. En general, los resultados indican un buen avance hacia los resultados del programa y del objetivo estratégico, indicando la utilidad de algunos de los cambios realizados. También se llevó a cabo una revisión del proceso para evaluar la forma en que el Plan de Negocios se implementó y se comunicó a los principales interesados. Los resultados se discuten en términos de fuerzas, debilidades, oportunidades y amenazas para lograr el cambio deseado.
Attestation
I declare that this work is original except where indicated by special reference in the text and no part of the dissertation has been submitted for any other degree. Any views expressed in the dissertation are those of the author.
The dissertation has not been presented to any other university for examination. This research was carried out through continuing work with the NSW Department of Family and Community Services, Psychological Services, Australia.
The views expressed are not necessarily those of the agency.
Signed: Lucia Anna Britton Date: 14/2/2017
Acknowledgements
Undertaking this report would not have been possible with the help and guidance of a number of people.
Firstly, I would like to thank my husband, David Britton, who has tolerated, an undergraduate degree and three dissertations. He has been a constant support from the time I have left High School and continues to encourage my ongoing learning and professional career. To The Director of Psychological Services, Alison Soutter, who has been a valuable support over the last seven and helped me grow professionally in my role as manager. Alison taught me “not to give people a stick to hit you with”. This is Alison’s last year of service and her consent to conduct this study is testimony to her commitment to ensure that we provide the highest level of service to the children in statutory care.
To my supervisor, Professor Miguel Xavier, thank you. You have provided ongoing support over the last 18 months. Studying long distance always has its challenges but your
responsiveness to email requests is more than impressive. I have always felt supported with you at the helm. Your encouraging words have helped me along the way and taught me not to doubt myself.
I would also like to thank my long term colleague and friend, Gaylene Griffiths, who has provided much support to me over the years and is always there when things get tough. My once intern, has demonstrated her mastery of skills.
Thank you. Lucia Anna
Lucia Anna Britton, Manager of Psychology Services – Western District Psychological Services, NSW Family and Community Services
NOVA Medical School, Masters of Mental Health Policy and Services 2017
Addressing the Treatment Gap for
Children in Statutory Care
Evaluating the effectiveness of the Psychological Services
Business Plan 2016/2017 using the ACI framework
Table of contents
Table of contents ... 2
Abbreviations ... 4
Overview ... 5
Part 1: Project Proposal ... 6
Evaluation of the Effectiveness of Psychological Services Business Plan 2016/2017 using the ACI Framework ... 6
1.1 Background ... 6
1.2 Purpose of the Evaluation ... 9
1.3 Parameters of the Evaluation ... 10
1.3.1 Formative Evaluation ... 12
1.3.2 Process Evaluation ... 12
1.4 Measuring the Impact of Change ... 13
1.5 Data Analysis ... 15
1.6 Communication of Findings ... 15
Part 2: The Evaluation Report ... 16
Formative and Process Evaluation of Psychological Services Business Plan 2016/2017 ... 16
2.1 Aim of the Current Study ... 16
2.2 FACS Approval and Ethics Application ... 16
2.3 Data Sampling ... 17
2.3.1 Monthly Statistics ... 17
2.3.2 Consultation Records ... 17
2.3.3 Discharge Summary Reports ... 17
2.4 Formative Evaluation of Outcome Measures ... 18
Outcome measure 1: Increase accessibility to CYP and their parents/carer to psychological services ... 19
Outcome Measure 2. Increase time psychologists spend providing intervention to CYP over the next 12 month ... 22
Outcome Measure 3.0 Increase use of evidence based therapies against identified problem area in next 12 months. ... 25
Outcome measure 4. Increased use of outcome data to demonstrate treatment effectiveness over the next 12 months. ... 26
2.5 Process Evaluation ... 27
2.5.2 Evaluation of the Process ... 29
3.0 Discussion ... 32
4.0 Recommendations ... 37
5.0 References ... 38
Abbreviations
ACI Agency for Clinical Innovation BSP Behaviour Support Plan CEFCM Ethics Research Committee
CS Community Services
CSC Community Service Centres
CW Case Worker
CYP Children and Young People FACS Family and Community Services FaCSAR FACS Analysis and Research FTE Full-time Equivalent
OCG Office of Children Guardian OOS Occasions of Service
OoHC Out of Home Care
NSW New South Wales
SPSS Statistical Package for Social Sciences TRIM Total Records and Information Management
Overview
This report is written in two parts. The first part of the report outlines the initial project proposal to conduct an internal formative and Process Evaluation to test the effectiveness of Psychological Services Business Plan and identify any changes or modifications that may be needed to enhance the probability or the service achieving their goals by end of 2017. Using the NSW Agency for Clinical Innovation (ACI) Framework and Program Logic, outcomes and outputs are identified and tested through impact measures.
The second part of the report outlines the finding of the evaluation on the identified impact measures. Overall, the results indicate good progress towards the program outcomes and strategic goal, indicating utility of some of the changes made. A process review was also undertaken to evaluate how well the Business Plan was implemented and communicated to key stakeholders. The results are discussed in term of the strengths, weaknesses, opportunities and threats for achieving the desired change.
1.1 Background
Children in statutory Out of Home Care (OoHC) have well documented higher levels of traumatic experience, multiple reports of abuse, acute mental health symptoms and behavioural problems compared to the general population (Milne, Collin & Vezina, 2015). These issues are further complicated by the removal from their families, peers and communities, together with a high degree of uncertainty around their future (Milne, et. al., 2015). Despite the known difficulties and poor lifelong outcomes for children/young people (CYP) in OoHC, previous studies report that there is a significant treatment gap with few CYP receiving appropriate level of intervention and support (Chambers, Saunders, New, Williams and Stachurska, 2010). In New South Wales (NSW) alone there are approximately 18,500 CYP in OoHC. The most common reason CYP entered care over the last three years was due to neglect followed by actual physical/sexual harm and emotional abuse (Family and Community Services, FACS, 2015).
In a recent survey of CYP entering OoHC in NSW (Smart, 2015), foster carers were asked to complete a Child Behaviour Checklist (CBCL) to identify the rates of
emotional and behavioural symptoms of CYP in their care. The CBCL provides cut-off scores to identify those CYP in the normal, borderline or clinical range for total, externalising and internalising behaviours. The results showed that according to care-giver responses one fifth of children aged three to six years had scores in the clinical range for internalising, externalising or total behaviour problems. Similarly, one third of children aged seven to 11 years had clinical levels of externalised and total behavioural problems but only 18% were in the clinical range for internalising behaviours. In the older age group, 12-17 year olds, 45% displayed externalised behaviours in the clinical range and 47% were in the clinical range for total problems while less than quarter of young people were in the clinical range for internalised problems (Smart, 2015).
Meeting the psychological and mental health needs CYP in OoHC is a challenge for FACS NSW due to the high prevalence and severity of the conditions identified. The FACS Statewide Psychological Services key objective as stated in their Business Plan is to “Improve the outcomes of our most vulnerable children and young people in care” (CS Psychological Services, 2014). Despite ongoing efforts to increase referrals to the service, less than 10% of CYP in OoHC are referred by their Caseworkers (CW) to Psychological Services for assessment and or ongoing
Part 1: Project Proposal
Evaluation of the Effectiveness of Psychological Services Business Plan
2016/2017 using the ACI Framework
intervention. This finding represents a significant gap in the delivery of mental health services for CYP and young people in care.
As part of State-wide Services, Psychological Services has a Director and Assistant Director with eight managers of district-based Psychological Services. Each
manager has up to seven full-time equivalent (FTE) psychologists. Each team of psychologist is different. Some teams have both full-time and part-time (or shared positions). Most teams are responsible for a specific geographical area or districts. Each psychologists works in a Community Service Centre and acts as a consultant to several teams of CWs. The exception to this, is the Intensive Service Support (ISS) psychologists who work more intensively with CYP as part of the Community Services ISS Teams and while located in Sydney may work across directorates.
The key role of Psychological Services is to provide consultation, assessment, intervention and training (for CW and Carers). Psychologists work with CYP and their families in both Child Protection and OOHC. In some centres they are engaged in Practice First Group Supervision and often provide visiting services to other Community Service Centres.
Referrals to Psychological Services are currently made via a clinical consultation with the CWs. CWs initiate a referral by first requesting a consultation in which they provide information regarding a child’s behaviour/clinical issue and relevant
background information. The consult allows the psychologist and CW to decide if a referral for assessment or intervention is warranted and assist the CW to refine the referral question. The psychologist then completes the consultation record and sends this to the CW for signing requesting that the form is attached to the child’s electronic record. The signature of the CW is required to verify that the written record was an accurate summary of the information discussed and recommendations
tendered as this becomes part of the child’s record of care and is often used to guide CW practice and decision-making. If a referral is recommended, the CW will then complete a referral form, outlining the specific reason for referral and related background. The referral form is countersigned by the Casework Manager as
delegates of the Minister to provide appropriate parental consent for assessment and treatment. The referral is then sent to the psychologist and/or Manager of
Psychological Services for allocation either to a departmental or external psychologist.
This process is very time consuming for psychologists and CWs alike. While most psychologists try to complete the consult within three days, there are often delays in getting all parties to agree to the content and then countersign. Not all
recommendations for referrals are followed-up by CWs and those that are may be delayed in being appropriately allocated due to waiting lists and service capacity issues (both internally and externally). If CYP cannot be seen by the CS
Psychologist, FACS guidelines direct CWs to explore other government, non-government agencies prior to referring to a private provider. There are not always services available, especially in rural areas.
In October, 2014, a survey of psychological consultations in the Western NSW District, Psychological Services Team, showed that less than half of the
child’s electronic file. Of those completed and placed on the electronic records system, less than half were formally referred to the CS Psychology Services.
Similarly, in 2015, Psychological Services commissioned a state-wide service review of clinical consultations to assess the nature and outcomes of consultations provided by CS Psychologists. While it was a selected sample, it showed few consultations with CWs resulted in the identified child being referred to Psychological Services, supporting the earlier findings (by the Western District). These surveys highlight the inefficiencies of the referral process and raised questions regarding the utility and timeliness of the recommendations provided by psychologists to CW to influence and effect child’s overall care plan.
The aspired goal of CS Psychological Services is that “Children and young people are protected from abuse and neglect and have the best possible lives”. In January 2016, the Director of Psychological Services was given a clear directive from the NSW Minister of Family and Community Services to increase intervention/treatment to CYP in statutory care. In February 2016, the Psychological Services Executive Team met to develop their annual business plan and identify key strategies to
achieve these goals. The executive team consisted of the Director, Assistant Director and nine Managers of Psychological Services.
The strategic goal of the 2016/2017 FACS Psychological Services Business Plan is “focussed on delivering significantly more therapeutic interventions with children, young people and families” (p.4). To achieve this goal a number of key initiatives were identified including:
Increase psychological interventions for children, young people, families and carers
Focussed assessment activities, in order to assist case planning and evaluate need for ongoing therapeutic interventions
Streamline consultations and Practice First to make the process more time efficient and allow CWs to make direct referrals to the service
Centralise staff training to enable better collaboration with FACS Learning and that each regional team provide no more than six training days per year.
The Business Plan outlines a number of key strategies to be employed to facilitate change and provides CS psychologists with “guidance and clear actions that are aligned with current objectives of FACS and the Statewide Services Directorate. The plan also addresses the Premiers’ Priority to reduce the number of re-reports
through therapeutic work with children and birth parents. It is designed to help promote consistent and equitable practice the across the state” (p.2).
The plan includes a communication strategy outlining the level of consultation with FACS, Departmental Psychologists (p.14), Psychological Services Vocation Advisory Group of the PSA (Union) and District Directors/ CSCs (p. 15).
The service demonstrates its commitment to excellence through ongoing evaluation and service improvements agreeing to undertake a Formative and Process
Evaluation to ensure that the service is progressing towards its goals and are able to use evaluative feedback to make ongoing improvements if indicated (p. 16).
Service evaluation has traditionally focused on how the customer perceives or evaluates service delivery (Bradley, Carlson, Gallo, Scinto, Campbell, & Krumholz, 2005). In FACS, there is no standard model of service evaluation and the evaluation frameworks tend to be fit for purpose depending on the type of evaluation required and the intended audience. In CS Psychological Services, the Executive Team are driven by a scientist-practitioner framework to ensure that the changes made can be evidenced through our work practices. This is often difficult due to the complexity of the systems in which it operates.
McKenzie (2014) reviews the difficulties in identifying and making changes in a complex adaptive system. Within FACS there are a number of different Directorates, or parts of the system, that work interdependently with a collective aim of providing
best outcomes for kids. The complexity of the system is in the patterns of interaction
between its different components or parts. Change in one area of the organisation can often lead to changes in other parts. Results are often counter intuitive to what was expected. As such, traditional measures that assess change in its individual components are too simplistic and inadequate.
The NSW Agency for Clinical Innovation (ACI) defines program evaluation “as a systematic process designed to examine the worth of a program or project in terms of effectiveness, efficiency and appropriateness” (ACI, 2013). This model of
assessment has been endorsed by the NSW Premiers Department and Cabinet and provides a good framework for evaluating clinical health services such as those provided by the FACS CS Psychological Service. The ACI identifies a number of different types of evaluations. While summative data assists to evaluate the overall outcomes of the Business Plan, Formative Evaluation provides valuable “data that can be used to determine the early impact of the project implemented. As such this information helps refine the Model of Care, establishing early outcomes and areas requiring improvements” (ACI, 2013 p.6) and enhance the probability of achieving the overall outcomes by 2017. Process Evaluation is used to assess the extent to which the program is implemented according to the improvement plan. It aims to clarify feedback on the quality of the implementation with regard to its
appropriateness, acceptability and sustainability over time (ACI, 2013).
The ACI model uses Program Logic to inform the evaluation process in terms of what indices or measures are to be used. It identifies key inputs, activities, outputs and outcomes of the improvement project to clarify the logic of what will be assessed and how. Developing a Program Logic assists to maintain the focus of the outcomes (behavioural intentions) through measuring the outputs (performance indicators that are measureable). The evaluation cycle is conceptualised as a continuous process to ensure the evaluation data is used as part of the ongoing implementation and communication plan to enable information to be fed back to executive team to allow modification to be made in their plan/strategies to ensure that the overall goals are achieved.
1.2 Purpose of the Evaluation
The purpose project is to evaluate the 2016/2017 Psychological Services Business Plan and assess the effectiveness of the strategies identified in meeting their
intended goals. The Agency for Clinical Innovation defines program evaluation “as a systematic process designed to examine the worth of a program or project in terms of effectiveness, efficiency and appropriateness (Agency for Clinical Innovation, ACI, 2013). While summative data will assist in evaluating the overall outcomes of the Business plan, a formative evaluation will provide valuable “data that can be used to determine the impact of the project implemented, refine the Model of Care,
establishing early outcomes and areas requiring improvements” and enhance the probability of achieving the overall outcomes by 2017 (ACI, 2013 p.6).
In addition, a process evaluation will be conducted to assess the extent to which the program is implemented according to the Business Plan. It aims to seek feedback from psychologists and their Managers regarding their overall satisfaction with the implementation of the Business Plan with regard to its appropriateness, acceptability and sustainability over time.
1.3 Parameters of the Evaluation
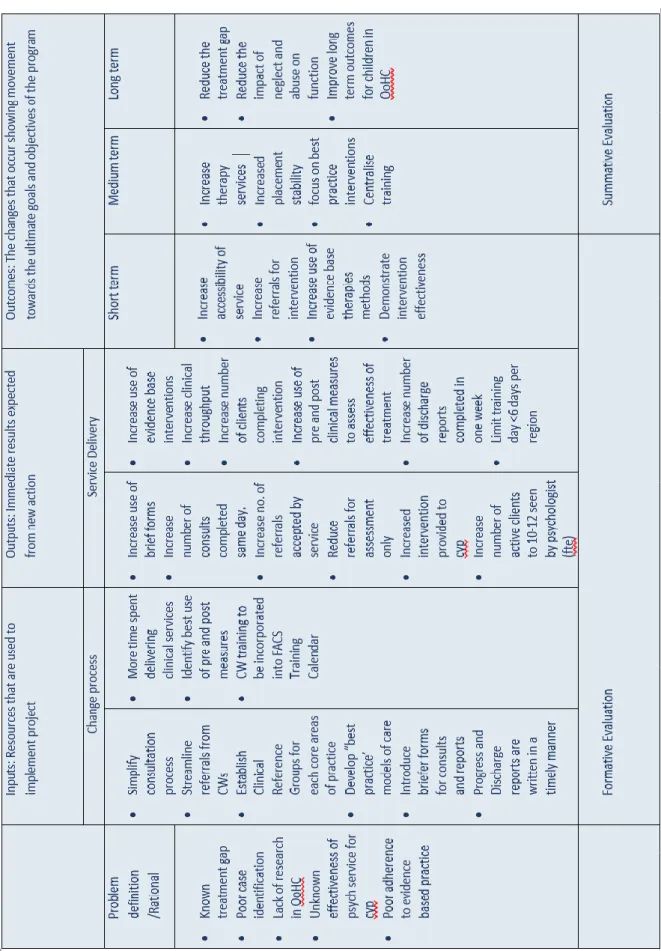
The scope of the evaluation will be limited to conducting a Formative and Process Evaluation of the Business Plan for FACS Psychological Services 2016/2017. The measures for assessment are derived from the Program Logic. Table 1 illustrates the links between the service goal, long term and short term outcomes, service outputs (directly assessing the Business Plan action) and program improvement inputs. The definition of short-term goals while not prescriptive would generally be achieved in two to five years while the program outputs are expected to be more immediate as a result of the actions employed. Outcome measures could be defined as:
Increase service accessibility of CYP and their parents/carer in CP and OoHC (12 months)
Increase psychologist’s time spent providing intervention services in next 12 months
Increase use of evidence based therapies against identified problem area in next 12 months
Increase use of outcome data to demonstrate treatment effectiveness over next 12 months
1.3.1 Formative Evaluation
The data used to assess the service outputs will be derived from a number of
different sources including departmental monthly statistics collected by each region, data from clinical audits of consultation records and discharge summary reports. Improvements in service will be assessed by measuring changes between pre and post data collated prior to changes being implemented and six months following (May 2016 and October 2016 respectively).
Monthly statistics are collapsed across FACS Districts and give a good indication of level of client access and service type. More specifically, the monthly data includes, number of total consultations provided to CWs, number of new referrals (for
assessment and or intervention), total number of active cases, waiting list, total direct/related client contact and number of reports completed. The service also records data regarding number of clinical meetings attended and total number of training hours provided.
Information from the clinical audits of reports will yield information on consultations and services provided. More specifically consultation reports will provide information regarding reason CWs consulted with psychologist and whether a referral to
Psychological Services for assessment/intervention was recommended. The consultation forms will also provide the date of consultation and when the
consultation was signed to measure the efficiency of the consultation process in terms of time and finally if the new form was being adopted.
Similarly, the audit of discharge reports will provide the service with information regarding the reason for referral, type of and duration of intervention provided. These reports will also provide information regarding the reason for discharge, number of sessions, duration of therapy (days) and the date of report to calculate the time taken to complete report following discharge.
All data will be collated across Districts with no inter-regional comparison as agreed by the Executive Team.
1.3.2 Process Evaluation
In order to assess the extent of the Business Plan being implemented as planned, managers, with input from their teams, will be asked to provide information with regard to how the changes were communicated and implemented.
1.4 Measuring the Impact of Change
The Psychological Services Business Plan provides a summary document linking it strategic goal to key initiatives, actions, how and measures (Page 10). This plan has been redefined to fit with the ACI framework and language to “ … illustrate a
program and assessing what should be measured and when” (ACI, 2013). Table 1 outlines the Program Logic for this review.
While the language of the ACI is different to that used in FACS plan the constructs are similar. The ACI model links outcomes (short, medium and long term movement towards the stated goal) with the outputs (or product) of an action defined. The ACI framework advocates for appropriate indicators or measures to assess the impact of the program being implemented. These measures should also be sensitive enough to detect changes through the project life cycle.
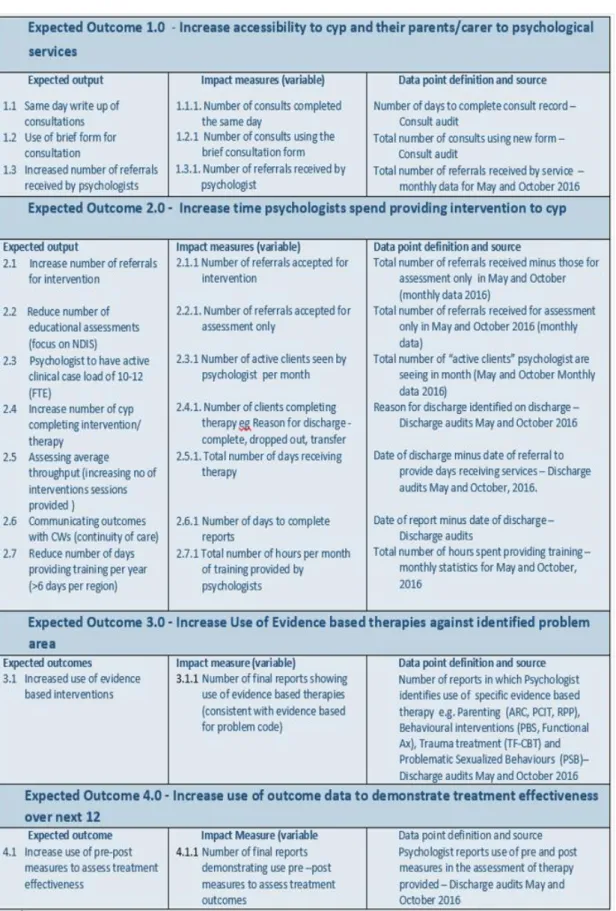
Impact measures should be expressed as a quantitative change to test whether the program goals (outcomes) have been achieved. The impact measures are directly related to the outputs and outcomes derived from the Program Logic. The impacts measures for this evaluation are set out in Table 2.
The monthly service data is currently collected by managers in each district. There are nine teams of psychologists across the state (n=9). In May and October 2016, managers will be asked to add one additional data point to
Their routine statistics to separate those referrals that were made for assessment only (as opposed to intervention).
The consultation audits will review consultation records from psychologists
completed prior to when the Business Plan was activated in May 2016. This was a selected sample that was collected as part of the regular service quality
improvement program in 2015. The consultations collected in October will be collected directly from the electronic records system to ensure a broader sample of consultations.
Similarly the discharge summary report audit conducted in May will utilise those reports submitted for a previous internal audit by Psychological Services (selected sample). For the October audit, the discharge summaries will be harvested from the electronic record keeping system (TRIM).
Information for the Process Evaluation will be gathered via a questionnaire with managers, and their teams, being asked to provide an open dialog of their
experiences in relation to the implementation of the Business Plan and how this was communicated.
1.5 Data Analysis
A summary of the data will be provided to Psychological Services to assist with ongoing monitoring and improvements to their Business Plan.
Inferential statistics will assist in comparing mean scores of pre and post measures (May and October) with the aim of identifying any significant improvement towards identified expected outcomes. All data will be analysed using SPSS.
1.6 Communication of Findings
The results of this evaluation will be made available to the Director of Psychological Services and the Psychological Services Executive to discuss the benefits and risks of dissemination to a broader audience due to the expected political sensitivities of the findings.
The formative and Process Evaluation report will be completed by February, 2017 by Anna Britton, Manager of Psychological Services Western NSW and submitted as part of the requirements for Masters of Mental Health Policy and Services with Nova University (under the supervision of Alison Soutter, Director of Psychological
2.1 Aim of the Current Study
The purpose of this current study was to conduct a formative and Process Evaluation of the Business Plan for FACS Community Services, Psychological Services. The evaluation process was conducted as planned (please see project proposal, Part 1). The assessment measures were derived from the Program Logic to elicit specific test variables for assessment. Using the ACI framework, the identified output measures were assessed by the impact variables to test the effectiveness of the Business Plan in achieving its goals. The impact measures were collated from departmental monthly statistics and clinical audits of consultation records and
discharge summaries in May and then again in October to measure if there were any improvements over time. It is expected that this evaluation will assist Psychological Services in refining its Business Plan, by identifying the strategies are working well and or need modifying to achieve their outcome goals over time. The aim of the Process Evaluation is to determine if the Business Plan was implemented as intended and identify any barriers/issues for review.
2.2 FACS Approval and Ethics Application
In April, 2016 FACS Community Services, Psychological Services Executive Team consented to an evaluation of the Psychological Service Business Plan 2016/2017. As part of this consent from FACS, the Legal Branch were consulted to clarify if an ethics approval was required. They advised that given that the information was collated as part of the day to day quality assurance activities within Psychological Services and no recording of individual client data were reported, permission from FACS Analysis and Research, FaCSAR was not needed (6th May, 2016).
As part of the requirements for Nova Medical School, an application for ethics approval was lodged with the university Ethics Research Committee in April 016 (nr.06/2016/CEFCM). The university granted consent on the 31st May 2016 stating the evaluation is “ being conducted according to the ethical guidelines of the
NMS|FCM-UNL’s Ethics Research Committee (CEFCM).
Part 2: The Evaluation Report
Formative and Process Evaluation of Psychological Services
Business Plan 2016/2017
2.3 Data Sampling
2.3.1 Monthly Statistics
FACS Psychological Service collates monthly statistics from each of the nine
Regional Managers for May and October. These months were selected to identify a baseline prior to changes being implemented (May) and then a few months later to assess the early inputs of change (October).
While the monthly data includes number of referrals received by each group it does not currently separate out those referrals received for assessment compared with intervention. As such, an additional data point was added to the May and October statistical profile to identify those referrals received for assessment only. The aggregated state-wide data has been reported as opposed to separate regions in accordance with the conditions of the study set out by the Psychological Services Executive.
2.3.2 Consultation Records
Prior to the implementation of current service changes, a service audit of
consultation records was conducted in October 2015. This information was used for the audit of consultation records at Time 1 (May 2016). This audit included 115 records that were submitted by psychologists at the request of their managers. Each psychologist selected the consultation records submitted for review.
A different approach was taken for Time 2, October 2016. The October records were initially harvested off the TRIM data base (record keeping system) under title search ‘consult’ with date parameters limited to the months of August to October 2016. This search yielded a total of 58 records. Of these, a number of consultation records were missing dates making it difficult to calculate days to completion (n =.12) resulting in 46 that met criteria. This number was lower than expected; it appears a number of the records had not been placed on the TRIM system. After consulting with the Director of Psychology, in areas of low compliance a decision was made obtain the records from psychologists via their managers to provide additional samples for review. This resulted in further 26 records being sent for review that met the study criterion. A total of 72 consultation records were included in the October audit.
2.3.3 Discharge Summary Reports
Discharge reports for Time 1 were also from a previous service audit conducted in 2015. The reports reviewed as a sample of psychologist’s work with regard to reason for referral, intervention type, rational and outcome. The audit included a total of 36 discharge summaries submitted by psychologists at the request of their managers.
The discharge reports for Time 2 were harvested from the TRIM using the search parameter “psychologist’s name” and created between August 2016 and October
2016. A total of 18 reports were found. Once again the number of reports was lower than expected and the Director of Psychology then requested that psychologists provided copies of discharge reports for review. A further 39 reports were received that met the study criterion resulting in a total of 57 reports being included in the October audit.
2.4 Formative Evaluation of Outcome Measures
Using the Program Logic outlined in Part 1, key outcomes were assessed by testing differences in the impact measures pre and post program implementation (Table 2). The outcomes measure provides a statement around the desired change. The effectiveness of the strategies used (outputs) are tested through their corresponding impact measures.
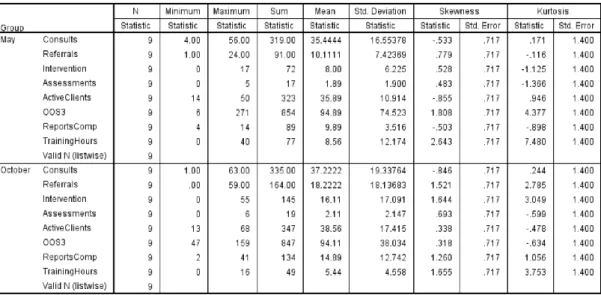
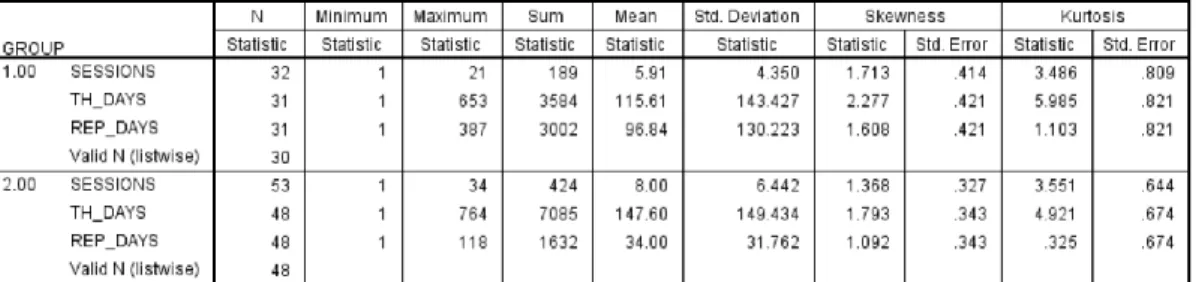
Monthly data was obtained from each district (n=9) for May and October, 2016.
The summary data for both May and October monthly statistics are provided in Table 3. A review of the data shows that the distribution of scores for most measures do not meet the assumptions for parametric testing due to the level of skewness and kurtosis. There is also a high degree of variability of scores within the group as measured by the standard deviation (sd). The high level of variability together with the small sample size (n=9) makes it difficult to compare groups using inferential statistics with any degree of confidence (or statistical power). There is a risk of making a Type I error, rejecting the null hypothesis when it is true and/or a Type II error, failing to detect a difference that is present. As such, we will use the
descriptive statistics to assess changes on the impact measures.
Outcome measure 1: Increase accessibility to CYP and their
parents/carer to psychological services
A number of strategies were identified to increase accessibility of clients to the service. The outputs were identified as increasing the use of the brief consultation form, increasing the number of consultations completed same day and accepting more referrals to the service. Overall results showed that more psychologists were completing consultation records the same day and using the new short consultation form. While the number of consultations remained stable, the number of referrals notably increased suggesting that receipt of direct referrals to the service was increasing service accessibility.
Impact Measure 1.1 - Number of consults completed same day (T1/T2)
Overall, comparison of the two months showed a slight increase (5%) in the number of consultations provided by Psychological Services. In May, there were 319
consultations provided (m = 35.44, sd = 16.55) with the range varying between four and 56 per region. The total number of consultations provided in October was 335 (m = 37.22, sd = 19.34) with a larger range of number of consultations completed from one to 63 per region.
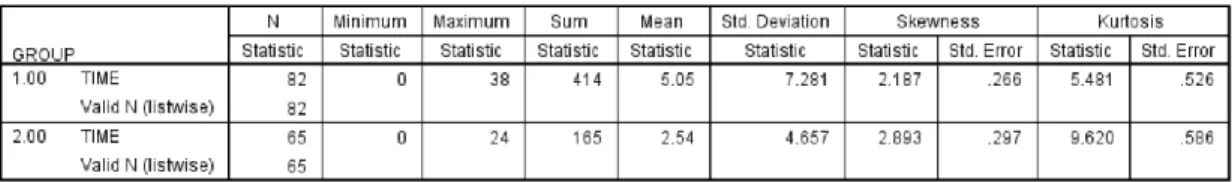
There were 115 consultation records reviewed in May. Table 4 shows the average time taken for psychologists to complete consultations record. Missing data for either date of consult or date consult was signed meant the number of days to complete record could not be calculated. Of those reviewed, in May 33 had missing values and in October, seven values were missing reducing the sample size to n=82 and n=65 respectively. The time calculation was based on a seven day week as excluding weekends. Results show in May the mean time to complete a consultation record was 5.05 days (sd =7.28). In October the mean time to complete consultation records was reduced to 2.54 days (sd = 4.66).
A review of the frequency data for time taken to complete consultation records showed an increase of the number of records completed the same day and or within 3 days. In May, 31.7% of consultations were written on the same day and in October this number increased to 52.3%. After three days the cumulative totals were 53.3% for May and 78.5% for October respectively. Overall these results reveal that
consultations records were being completed more quickly and that there was a 21 % increase in number of consults being completed on the same day in October.
.
Impact Measure 1.2 - Number of consults using brief form (Oct sample only)
The use of a brief consultation form was introduced to psychologists in February, 2016 (as part of the Business Implementation Plan). None of the baseline
consultation reports were recorded on the abbreviated form. A review of the October consultation records showed that a total of 58 of the 72 (80%) had used the new form.
While the introduction of the brief consultation forms did not appear to impact on the number of consultations completed in October 2016 it did appear to significantly reduce the time taken to complete consultation records. (Impact Measure 1.1).
Impact Measure 1.3 - Number of referrals received (m.s)
A review of the monthly statistics showed that the total number of referrals received by Psychological Services had increased from May to October. In May, a total of 91 referrals were received (m = 10.11, sd = 7.4) ranging from one to 24 per grouping. The referrals received increased in October to 164 being made by the CWs (m = 18.22, sd = 18.13), with a range of zero to 59 new referrals received per district.
These findings show an 80% increase in the total number of referrals received by Psychological Services from May to October, indicating a notable increase in accessibility to the service.
In May 2016 there were 319 consultations provided to CWs with 91 new referrals received. While the number of consultations remained relatively stable in October (n = 335), the number of referrals received increased to 164 (48.9%). It is difficult to know what proportion of referrals had an earlier consultation as opposed to direct referral. This finding may be due to direct referrals being accepted by psychologist (that previously were required to go through a consultation process).
The outcome of consultation with the psychologists does not always result in a referral or recommendation for ongoing assessment and intervention. A review of the consultation records data showed that there was an reduction in the number of cases being recommendations for referral to CS Psychologist and an relative
increase in the number of consultations not being recommended for ongoing referral. There was one missing datum for this variable for group 2.
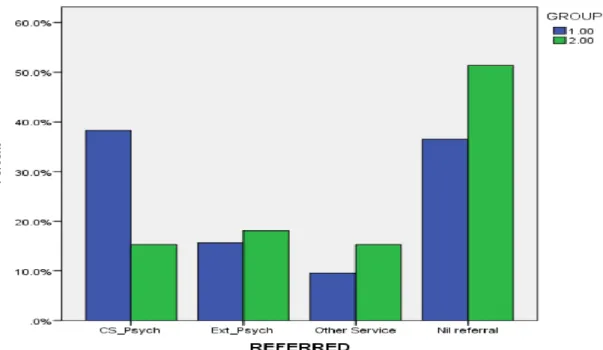
Diagram 1 shows a summary of consultation records and the recommendations made by psychologists for May and for October (group 1 and group 2 respectively). In May psychologists recommended that 38.3% of cases be referred to internal CS Psychological Service for specialist assessment or treatment. In October, this number was reduced to 15.3%. The recommendations for referral to external providers was relatively stable with 15.7% in May compared to 18.1% in October, while recommendations for referral to other services appeared to increase from 9.6% to 15.3%. Interestingly, in May 36.5% of consultations did not result in any ongoing recommendation for referral compared to those in October at 51.4%. This 14.9% reduction of recommendation for ongoing clinical support suggests that the either the issue discussed in the consult was not clinically appropriate or that it was resolved in the single session.
Diagram 1. Referral recommendations following consult (either referred, internally, to external services, or nil)
These later findings may be more related to the reason CW requested a consultation in the first instance. When we looked at problem type, most of the consultations to be for behavioural issues.
The Problem ID or types of issues recorded on the consultation forms were for CYP with identified behavioural problems, parenting issues, trauma history
/symptomatology, problematic sexualised behaviours, request for assessment only, assistance with transition planning, and family contact. These categories aim to describe the main reason for consultation with CW and may not be independent of each other. For example, it is possible that a CYP identified with challenging
“behaviour” by one CW may be identified as having symptoms “trauma” by another. Similarly, service requests for carers/parents might be related to difficulties with behaviour.
Problem ID had one missing data point for consultation information collected in October resulting in a total of 71 of the 72 being included in the analysis. May data was complete.
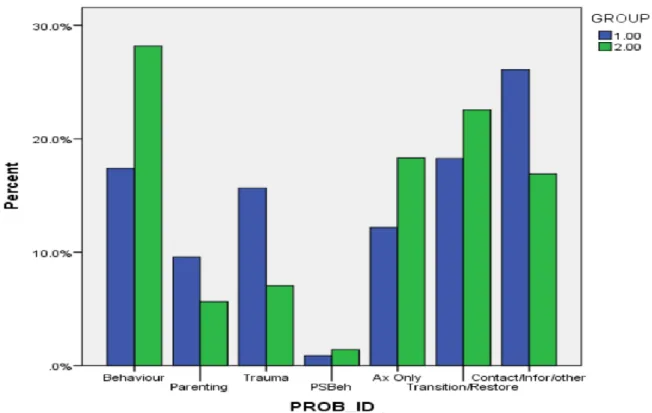
Diagram 2 illustrates the reason that CWs consulted with psychologists by
percentages as indicated on the consultation record. In May 17.4% of consultations were for a behavioural concern and this increased to 28.2% by October.
Consultations for parenting reduced from 9.6% to 5.6% of the totals as did those in relation to trauma, from 15.7% to 7.0%. Consultations in relation to problematic sexualised behaviour remained stable with 0.9% to 1.4% respectively. An increase was noted in consultations for assessment only 12.2% to 18.3%. Similarly there was a slight increase in the number of consultations provided around placement transition and or restoration from 18.3% to 22.5% from May to October respectively.
Diagram 2. Main reason for consultations in May (group 1) and October (group 2) by percentage.
Outcome Measure 2. Increase time psychologists spend providing
intervention to CYP over the next 12 month
Analysis of data shows improvement in the impact measures with the number of referrals to the service for intervention being doubled; with only marginal increases in referrals for assessment only. These results were also reflected in the slight increase in the number of active clients being seen by psychologists.
Impact Measure 2.1. Number of referrals accepted for intervention (m.s)
Table 3 shows that the total number of referrals to psychologists for intervention increased from 72 to 145. This is relative increase of 101% for referrals for intervention between May and October 2016.
Further analysis shows that in May, psychologists accepted a total 72 out of 91 (79.1%) referrals for intervention. In October, the number of referrals received for intervention increased 145 of 164 (88.4%) demonstrating a proportionate increase of 9.3% overall.
Impact Measure 2.2. Number of referrals accepted for assessment only (m.s)
The total number of referrals to psychologists for assessment only is shown in Table 3. In May, 17 of 91 referrals were received for assessment only compared with 19 of 164 in October. While this numeric indicates an increase in referrals for assessment it is proportionately lower (compared with the total number of referrals received). In
May, 18.6% of referrals were received for assessment only while in October, 11.5% of the referrals were for assessment. This is a reduction of 7.1% relative referrals received.
Impact Measure 2.3. Number of active clients seen by psychologists per month (m.s).
In May, the total Psychological Services had a total of 323 active clients (m=35.89, sd=10.91) they were seeing. In October the number of active clients increased to 347 (m =38.56, sd=17.41). The difference is negligible.
Another indicator of service activity is measured by the number of occasions of service (OOS) the client were seen or provided a direct service. Table 3 shows total number of OOS recorded by Psychological Services. In May, the service reported a total of 854 occasions of service provided to clients (m=94.89, sd =74.5). In October, the occasions of service was 847 (m= 94.11, sd 38.03). As such, the client activity appeared to be relatively stable from one reporting period to the next.
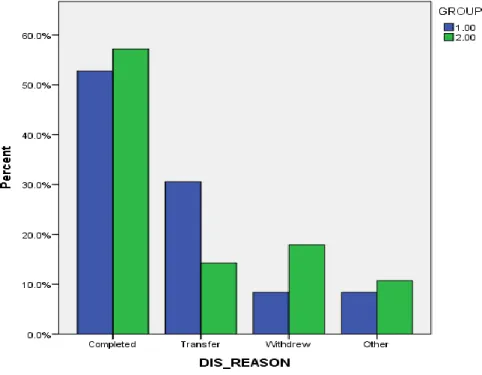
Impact Measure 2.4. Reason for discharge
This measure compares the number of clients completing therapy, withdrawing or transferred to other areas (or agency) between May and October (Time 1, T1 and Time 2, T2 respectively,). The results are reported in Diagram 3. Our baseline assessment showed that 52.8% of clients were reported to have completed therapy and had a planned discharged compared with 56.1% in October (slight increase). The number of clients discharged due to “Transfer” fell from 30.6% to 14.1%, while the number of clients who “Withdrew” from treatment increased from 8.3% to 17.5%. Other reasons for client’s discharging from treatment rose from 8.3% to 10.5%. This latter category included CYP that may have absconded or incarcerated (8.3% to 10.5%).
Impact Measure 2.5 Time from allocation to discharge
The date of first session to last session provides a measure of treatment throughput. This variable was measured as a seven day week. At baseline, number of days ranged from zero to 653 days with 96.8% of therapy days concluded within 408 days (approximately 13 months). The review data showed that the majority of clients (97.3%) were seen within one to 422 days (or 13 months).
The mean number of days to discharge for clients in May was 155.00 days (sd = 143.43). In October the mean number of days was slightly reduced to 147.60 days (sd = 149.00). There was one case where a client was seen over a 764 days (24.6 months). This was an obvious outlier.
Treatment dose or intensity was also measured. Table 5 summarises data relating to the amount of sessions across the number of therapy days to give an indication of treatment frequency (dose) over time. In May psychologists provided a total of 189 sessions over 3584 days (1 session to 18.96 days). In October the frequency of sessions were slightly increased with 424 sessions over 7085 days (1 session to 16.71 days). That is clients were seen slightly more often during the course of therapy with the psychologist in October.
Table 5. Descriptive data for report audits for May (group 1) and October (group 2)
Impact Measure 2.6 Date of final session and date of final report (audit T1/T2)
Table 5 also provides information as to the number of days taken to complete reports following treatment. The time taken to write Discharge Reports is an important
indicator regarding continuity of care to ensure that ongoing recommendations are communicated and followed-up by CWs.
The summary baseline data shows that discharge reports took on average 96.84 days to complete reports. The time ranged from one to 387 days, with 29% being completed within two weeks (compliance period). On review in October reports took an average 34 days to complete reports, ranging from one to 118 days. While psychologists were completing reports in less time, only 33.3% of reports were completed within the two week compliance period.
Impact Measure 2.7 Reduce the number of training hours per month
In order to increase direct client activity, psychologists were asked to reduce the amount of training provided to CWs, carers etc. The data for training is reflected in the monthly statistics in Table 3. In May, across the state psychologists provided a total of 60 hours training (m = 6.67, sd = 6.83). In October, this number was reduced
to 49 hours (m = 5.44, sd = 4.56), representing an 18% reduction in time providing training.
Outcome Measure 3.0 Increase use of evidence based therapies
against identified problem area in next 12 months.
Psychologists reported using a variety of different intervention strategies in their discharge summaries. Where possible from the treatment types were grouped in “like” categories. For example, when psychologist stated they “provided carer with trauma education” this was coded as “parenting” unless there was specific reference made to difficulties managing their behaviour (coded as behaviour) or reference to difficulties managing trauma symptoms (trauma).
Impact Measure 3.1 Number of final reports showing the use of evidence based therapies (consistent with evidence based therapies audit T1/T2).
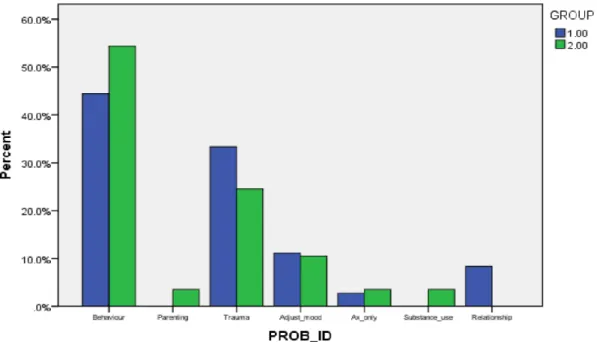
Diagram 4 shows a summary of the reason for referral noted in the reports. In both May and October, the most common reason for referral was behavioural concerns (44.4% and 54.4%). Trauma was ranked the second most common reason for referral with 33.3% for May and 24.6% for October. Referrals for adjustment/mood difficulties were 11.1% and 10.5% for May and October respectively. Other referrals types were not easily comparable with for example parenting, substance abuse and relationship issues identified as present in one period but not the other.
Diagram 4. Report audit showing reason for referral by problem for May and October by percentage.
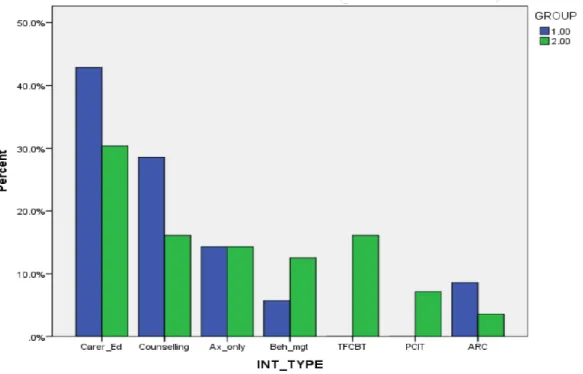
Diagram 5 shows the type of intervention provided by psychologists in May and October by percentage of total intervention provided. While some reports stated using TF-CBT, ARC, PCIT etc., it was unclear if these therapies were also being used (in part or in full) when psychologists stated they provided “counselling” or
“parent education”. The groups have been allocated into nominal categories for the purpose of comparison.
In May and October, psychological reports showed psychologists were primarily working with carers/parents providing parenting education (38.9% and 29.85% respectively). General counselling was provided to clients 27.8% and then 15.8% of clients in May and October while treatment using specific therapies generally
increased. Frequency of Behavioural Therapy rose from 5.6% to 12.3%, TF-CBT increased from zero to 15.8% and PCIT increased from zero to 7%. ARC based intervention reduced from 8.3% to 3.5%.
Qualitatively a review of reports indicated that most intervention appeared consistent with best practice models with regards to the presenting problem of concern. Despite this, minimal information was provided regarding the rational for one treatment being provided over another and/or information regarding adherence to the nominated treatment model. That is they did not articulate how they report adhered to the model in use.
Diagram 5. Report audit showing intervention type for in May and October by percentage
Outcome measure 4. Increased use of outcome data to demonstrate
treatment effectiveness over the next 12 months.
As scientist-practitioners, registered psychologists are required to assess the
effectiveness of their intervention/treatment using pre and post behavioural or clinical measures. Overall results show a slight increase in use of either one or both pre and post assessment measures.
Impact Measure 4.1. Number of final reports demonstrating use of pre and post measures to assess treatment outcomes between May and October 2016
This measure sought to identify improvements in measuring treatment outcomes. A summary of the frequency data shows that in May of the 25 of the 36 reports
reviewed 69.4% did not provide any quantitative clinical measures, 11.1% (7 of 36) used one measure and 11.1% used both pre and post. In October, 57% did not provide any measures, 26.3% used one and 15.8% used both. These results are represented in Diagram 6. These results demonstrate a marginal improvement reporting outcome measures.
It should be noted that of the four reports stated that they used pre and post measures but did not provide actual data. These were counted as positive as they demonstrated movement towards the desired change.
Diagram 6. Percentage of final reports with reported pre and post measures
2.5 Process Evaluation
2.5.1 Consultation, Implementation and Communication Plan
In February 2016 the Psychological Services Executive Team first met to discuss future directions and identify key strategies for change. A draft Business Plan was developed outlining the plan for consultation and communication with CS
psychologist and the agency more broadly. This plan specifically set out steps to how the Psychological Service would implement changes with FACS Departmental Psychologist, Psychological Services Vocational Advisory Group and the District Directors. This review focuses on the communication and implementation strategies with the psychologists working in the department.
Following the development of the Business Plan, managers were asked to consult with their respective teams about the “possible implications for change in their day to day work”. Between February and May the Director and Assistant Director met with
each district team to “discuss the need to provide more intervention services”. The Director and Assistant Director collated these comments and forwarded them to Managers for information and additional feedback.
Overall the reported comments from the feedback sessions in March/April was relatively positive. There was a general consensus that psychologists were
agreeable to most of the changes. With regards to consultations, one psychologist indicated agreement saying “consults have become too unwieldy and the
simplification of the process was welcomed”. Psychologists “early feedback tells us that where a new version of the form (consultation record) has been trailed, it has reduced time taken and allowed more time for other activities”. While most
psychologists appeared happy with the brief form there were concerns that they would still need to document background information on prospective referrals. As such, they did not think it would save time.
With regards to receiving referrals, there was agreement around CWs being able to make direct referrals; even so psychologists felt that a brief conversation with CWs would still be needed to clarify and “confirm(ing) the issue/s of concern”. There were several comments with regards to referrals for Behaviour Support Plans (BMPs) as psychologists felt these referrals needed monitoring and more “liaison with CWs”. While psychologists understood that behaviour management was part of their
everyday work and “should be treated as any other” referral there was a concern that the mandatory requirements for BMP for CYP being prescribed psychotropic
medication placed additional demands on the service.
Overall, psychologists stated that they welcomed an increase in clinical interventions to CYP but there were concerns from some psychologists that an increase in active clients to a caseload of 10-12 was not realistic. Further, psychologists welcomed seeing more clients in their office (reducing travel There were mixed feelings about centralising CW training and reducing the time provided for training in the districts. One of the issues of concern was that non-metro staff would not have access to training leading to some disadvantage for regionally based staff. Also, psychologists reported that they liked training as it is a break from their day to day work.
As a result of the Director/Acting Directors discussions with the team, a number of additional strategies were identified and adopted including: revision of the brief consultation form: psychologists not requiring CW’s signature on consultation record to simplify the process and save time, and a recommendation to review CW training needs and develop e-learning packages.
The CS Psychological Services Business Plan was expected to be launched at the Psychology Conference in May 2016. The conference provided training around the four core areas of practice and psychologists were informed about the purpose and function of the clinical reference groups being invited to submit an expression of interest to participate.
Following the Annual Conference the Director and Assistant Director met with each team on two separate occasions (either by phone or face to face) requesting
an opportunity for psychologists across the teams to raise specific questions or issues.
A final draft of the plan was sent to psychologists for feedback. Subsequently, the final plan was approved by the Director of State-wide Services and the District Directors were all informed about the Business Plan by the Director of Psychological Services in May 2016.
2.5.2 Evaluation of the Process
In order to assess how well Psychological Services implemented their Business Plan, regional managers were asked to complete a questionnaire to survey their opinions about the implementation phase (Appendix A). Only six out of eight managers responded. It should be noted that in January 2017 the service was reduced to eight managers with two were on leave at this time.
A sample of the responses provided are list below to help identify the main
theme/thought expressed. Managers/teams were asked to rate the statements using a five point Likert scale (1= Strongly Disagree; 2= Disagree; 3 = Neither Agree nor Disagree; 4 = Agree; and 5 = Strongly Agree) with the opportunity to make
comments. Due to the low numbers, these rating were not analysed but have been included to provide transparency and quantify the response given.
Overall the communication and implementation plan articulated in the Business Plan was followed. Records from the Director and Assistant Director showed that they consulted with psychologists to ensure that they understood the intention of the plan and were mostly in agreement with the strategic goals identified.
When reviewing manager and team comments there appears to be some variance within their scoring and support of qualitative statements surveyed. Some managers felt the Business Plan was very clear and resulted in more interventions being
delivered. Others felt there was a lack of clarity between the “outcomes and actions”. Despite this most managers appeared to have a clear understanding of the purpose or intention of the plan and strategies used.
With regard to communication, again the responses were varied. While the Director and Assistant Director met with teams to ensure understanding of implementation, there was some disagreement with regard to the level of “true consultation” with some managers reporting they were strongly engaged discussing plan with their teams and other managers feeling that “consultation was more a communication of directives”. Another reported that they felt the communication to the District Directors was not well co-ordinated and had to take on individual responsibility to talk with local CWs and to implement changes in their CSCs. It is unclear if these differing perspectives impacted the way the changes were discussed and implemented between districts. One of strategies recommended was that the Business Plan could be more broadly disseminated and provide a frame of reference for engaging with the service.
Most managers were not sure if the implementation of the Business Plan has led to improvements in service accessibility and or if the changes were acceptable to field psychologist and CW and would like more information around this.
With regards to sustainability, there was some acknowledgement that psychologists were working differently but were concerned that the service was focused on
numbers rather than quality of service. This comment was interesting as the Business Plan promotes best practice through CRGs and evidence based treatments.
Generally there was a strong sense that the changes could be sustained over time especially if full establishment of staff was reinstated and maintained. This was needed to increase number of clients seen. They felt it was important to remain realistic about the type of training that would be required e.g. to have all psychologist trained in PCIT. Some managers felt that it would be helpful for Psychological
Services to develop a training plan that ensured training was prioritise and co-ordinated.
Process Evaluation Questions and How Managers Responded 1. The actions identified in the Business Plan were clear related to the program and
quality improvements.
Frequency of scores show that Managers/teams mostly agree with this statement while two neither agreed or disagreed and one disagreed
Comments agreeing with this statement said they were pleased with the streamlining of forms and that this had “reduced significantly the time taken to write out the forms.”
Comments disagreeing with this statement felt there is a lack of “clarity between the actions and the outcomes (eg page 12 action increase in frequency of intervention is a desired outcome).”
2. The Business Plan was implemented as planned.
Frequency scores showed that half the managers agreed with this statement and half disagreed
Comment agreeing with this statement felt that the evidence was in the increase in caseload for intervention” while those that disagreed said the plan in my District was not clearly communicated stating that they did not received clear direction that the draft Plan had been endorsed by the Executive Director of State-wide Services”
3. The consultation communication strategies were helpful in the implementation of the Business Plan.
Only one Manager agreed with this statement, two neither agreed nor disagreed and three disagreed.
Comments supporting this statement said that the plan was very helpful and psychologists have discussed this in depth at the Team’s Group Supervision”
Comments not agreeing state report that there was more a ” communication of directives as opposed to true consultation with the field Psychologists”
4. The Business Plan resulted in more interventions being received by CYP.
Most Managers/teams report that they neither agreed nor disagreed with this statement. One strongly agreed and one disagreed.
Those that neither agreed nor disagreed stated said that “the barriers to providing this service were related more to priorities of the CSCs, the mobility of the client population, CYP and vulnerable families going directly to NGOs and the geographical distances. One said they weren’t sure reporting “they don’t have access to the data that would allow me to make a more informed statement.” (as to whether more CPY were being seen.
Manager that strongly agreed said that “Definitely from my supervision with members but may not be reflected on the data collection, why?”
5. The service changes are acceptable to Psychologists and Caseworkers.
Half the managers/teams agreed while two neither agreed or disagreed and one disagreed.
The managers that agreeing said the changes are impacting more on the psychologists in terms of moving away from old ways of working” reporting the current changes are about increasing quantity rather than quality “to justify Psychological services”.
The managers that disagreed said “I cannot answer this question although I think it would be useful if we asked them”.
6. What unexpected outcomes occurred throughout the program either adverse or positive?
“Positive feedback from caseworkers and managers re: consultation when the Plan had focused on reducing consultation as it had been wrongly assumed that consultation was not a valuable function.
“Writing up consult records ‘as we go’ is not conducive to building rapport with clients and is inconsistent with the principles of MI; that we are identified as leaders of in the field.
The communication to CSC’s was not implemented as planned and therefore it fell to the individual psychologist to make changes within their sphere of practice; it created a sense of it being the psychologist responsibility.”
7. What unexpected outcomes occurred throughout the program either adverse or positive?
“Positive feedback from caseworkers and managers re: consultation when the Plan had focused on reducing consultation as it had been wrongly assumed that consultation was not a valuable function.
“Writing up consult records ‘as we go’ is not conducive to building rapport with clients and is inconsistent with the principles of MI; that we are identified as leaders of in the field.
The communication to CSC’s was not implemented as planned and therefore it fell to the individual psychologist to make changes within their sphere of practice; it created a sense of it being the psychologist responsibility.”
8. ’What improvements can be made to the Business Plan?
Method of data collection and Business Plan need to be better aligned.
“More consultation to occur with the field in the development phase (i.e., psychologists AND the casework teams).”
“More review and communication with whole of Psychological Services at regular periods during review and implementation of current and future Business Plans.”
“It would be of benefit to have a document that was able to be disseminated more broadly and that provides a frame of reference for engaging with PS.”
“All aspects should be in place in order to implement or have a staged implementation with clear indicators of progress towards stated goals e.g. what constitutes a significant increase in therapeutic interventions?”
“Clarity around provision of training and coordinated approach to providing training”. “Be realistic – Business Plan indicated that psychologist will use evidence based practices such as PCIT; however, training is not made available in this area.”
“I would suggest that the How and the Measure columns need to be reviewed as some of the ‘measure’ items I think belong in the ‘How’ column. I would also like an action to review our current assessment measures for pre and post assessments and perhaps develop a test library where psychs can borrow current but less used assessment tools such as the CAPI for those occasions when we need to refine or clarify our formulations.”
9. Any other comments
” Allocate time in the Psychological Services Conference to adequately discuss the plan and share concerns, feedback etc.
“Accreditation – limited guidance from PS regarding completion of BSP (a core area of practice) and where responsibility lies when they are not clients of PS.
“Not all CRG’s have sufficient members to function effectively”
“Is a client load of 10-12 clients per FTE an overall increase in caseload/service provision? “Given a 12 month follow-up was planned for June 2017, is it currently too early to evaluate the impact of implementation of (the) Business Plan?