UNIVERSIDADE DA BEIRA INTERIOR
Ciências
Assess of catechol-O-methyltransferase soluble
isoform by multiple reaction monitoring mass
spectrometry
Joana Margarida Santos Diogo
Dissertação para obtenção do Grau de Mestre em
Bioquímica
(2º ciclo de estudos)
Orientador: Prof. Doutor Luís António Paulino Passarinha
Co-Orientador: Profª. Doutora María Eugénia Gallardo Alba
Somewhere, something incredible is waiting to be known.
Carl Sagan
1. Acknowledgments
Em primeiro lugar, gostaria de agradecer ao professor Doutor Luís António Paulino Passarinha e à professora Doutora María Eugénia Gallardo Alba, por toda a orientação, disponibilidade e partilha de conhecimento. Obrigado pela confiança depositada em mim.
A todos os membros e colaboradores do CICS, principalmente ao grupo “Biotechnology and Biomolecular Sciences”, quero agradecer a grande entreajuda e bom ambiente proporcionado. Particularmente, à Margarida Grilo e à Fátima Santos agradeço a imprescindível ajuda que me deram ao longo do ano. À Carla Pereira, minha fiel parceira de laboratório, um enorme obrigado por estar sempre presente em todos os momentos e por me ajudar a ultrapassar todas as dificuldades que surgiram.
Finalmente, agradeço à minha família e amigos que sempre me acompanharam e apoiaram incondicionalmente, com um agradecimento especial ao João pelo constante e incansável apoio e carinho.
2. Resumo
A catechol-O-metiltransferase (COMT) é uma enzima que cataliza a transferência de um grupo metilo da S-adenosil-L-Metionina para um grupo hidroxilo de uma grande variedade
de substratos com estrutura catecólica, incluindo estrogénios e neurotransmissores como a dopamina e a noraepinefrina. A proteína é expressa na forma solúvel (SCOMT) e na forma membranar que contém 50 resíduos adicionais na extremidade N-terminal (MBCOMT). Numa elevada percentagem dos tecidos humanos, a COMT encontra-se presente sob a forma solúvel e apenas uma pequena fração como MBCOMT. O gene humano da COMT tem um polimorfismo comum num resíduo que resulta numa substituição de uma metionina por uma valina no resíduo 108 da proteína solúvel e no resíduo 158 da forma membranar. Os dois alelos têm sido associados a diversas doenças neurológicas, como esquizofrenia, anorexia nervosa e transtorno obsessivo-compulsivo. Assim, devido ao papel da COMT em várias desordens mentais, medições precisas e seletivas são requisitos essenciais para o melhoramento da investigação clínica da COMT. Deste modo, neste trabalho é desenvolvido uma metodologia seletiva e de baixo custo para quantificar a proteína COMT em lisados de Pichia pastoris por cromatografia líquida acolpada à espetrometria de massa (LC-MS/MS). O método foi validado de acordo com orientações internacionais, avaliando a seletividade, linearidade, precisão e exatidão, limite de deteção e limite de quantificação, carry-over e efeito de matriz. Todos os parâmetros avaliados encontraram-se dentro nos limites estabelecidos. O método foi capaz de quantificar as duas isoformas em amostras complexas como lisados celulares, demonstrando a sua aplicabilidade. A versatilidade do método analítico proposto poderá permitir a sua aplicação em análises de rotina laboratorial de SCOMT e MBCOMT em diversas matrizes biológicas como sangue, tecidos mamários, hepáticos ou cerebrais.
Palavras-chave
Pichia-Pastoris, catechol-O-metiltransferase solúvel, catechol-O-metiltransferase membranar,
VIII
3. Resumo alargado
A enzima catecol O-metiltransferase (COMT) cataliza a transferência de um grupo metilo da S-adenosil-L-Metionina (SAM) para o grupo hidroxilo de um substrato catecólico, na
presença de um catião divalente como o magnésio. Entre os inúmeros substratos fisiológicos da COMT encontram-se as catecolaminas neurotransmissoras (epinefrina, norepinefrina e dopamina), hormonas (como os estrogénios com estrutura catecólica), ácido ascórbico e catecóis xenobióticos.
Nos seres humanos, o papel fisiológico mais relevante da enzima é a eliminação de catecóis tóxicos ou biologicamente ativos. Para além disso, a COMT é um importante metabolizador de fármacos catecólicos (como L-DOPA, metildopa e isoproterenol). Apenas
existe um gene da COMT que codifica as suas duas isoformas, a solúvel (SCOMT) localizada no citosol e outra associada a membranas plasmáticas (MBCOMT), que contém 50 resíduos adicionais no N-terminal. A sua expressão é controlada por dois promotores distintos, P1 e P2. Apesar de a COMT existir em múltiplas formas polimórficas, existe um polimorfismo bastante comum em humanos que leva a mudanças da actividade enzimática. Esta alteração é causada pela transição de uma guanina para adenina (G -> A), no codão 108 da SCOMT e 158 da MBCOMT, resultando na substituição de uma valina para uma metionina. O gene da COMT tem sido fortemente associado a várias doenças psiquiátricas (esquizofrenia, anorexia nervosa, transtorno obsessivo-compulsivo) e mudanças na ativação cerebral. Devido a isto, o desenvolvimento de técnicas para uma rápida, económica e precisa quantificação das diferentes formas da COMT é crucial para a investigação clínica da enzima.
Primeiramente, neste trabalho, foi feita a produção das proteínas de interesse (SCOMT e MBCOMT) a partir de Pichia Pastoris X-33 Mut+. De seguida, de modo a obter um padrão da
enzima, a forma solúvel da COMT foi purificada através de cromatografia de afinidade por iões metálicos imobilizados (IMAC).
Posteriormente, neste trabalho foi desenvolvido e validado um método analítico de MRM capaz de detetar e quantificar a enzima COMT em amostras complexas, como lisados celulares de Pichia pastoris. O método foi validado de acordo com critérios internacionalmente aceites, da Food and Drug Administration (FDA) e da International Conference on
Harmonization (ICH). O método demonstrou ser seletivo para o analito e linear na gama de 25
a 200 µg mL-1, com coeficientes de determinação (R2) superiores a 0,99. Os limites de deteção
e quantificação foram, respetivamente, de 3,3 e 25 µg mL-1 e a precisão e exactidão intra-dia
apresentou-se abaixo dos 15%. O método não apresentou efeito de matriz nem carry-over. A aplicabilidade do método foi avaliada por aplicação da metodologia a amostras digeridas de lisados de Pichia pastoris contendo SCOMT e MBCOMT. Globalmente, foi possível detetar e quantificar as duas isoformas nestas amostras complexas. Em conclusão, o método
desenvolvido é eficaz para a determinação da enzima COMT e poderá ser extrapolado em análises laboratoriais de rotina em matrizes como sangue, tecidos mamários, hepáticos e cerebrais .
X
4. Abstract
COMT is an enzyme that catalyses the transfer of the methyl group from S-adenosyl-L-methionine to the hydroxyl group of a large variety of catechols, including catechol-estrogens and the neurotransmitters dopamine and norepinephrine. The protein is expressed in both a soluble form (SCOMT) and a membrane-bound form with additional 50 residues at the N-terminal (MBCOMT). In most human tissues, the majority of COMT is present in soluble form and only a small fraction as MBCOMT. The human COMT gene has a common single-nucleotide polymorphism that results in substitution of methionine for valine at residue 108 of soluble protein and residue 158 of the membrane bound enzyme. The two alleles have been associated with several neurologic diseases, such as schizophrenia, anorexia nervosa and obsessive-compulsive disorder. Thus, due to the COMT's role in several mental disorders, accurate and selective measurements are essential requirements for improvement the COMT clinical investigation. Thus, in this work a specific and low-cost methodology is developed in order to measure COMT protein in Pichia pastoris lysates by liquid chromatography-multiple reaction monitoring (MRM) mass spectrometry. The method was validated according to international guidelines evaluating selectivity, linearity, precision and accuracy, limit of detection and limit of quantification, carry-over and matrix effects. All the evaluated parameters were found within the established confines. The method was able to quantify small amounts of both COMT isoforms in complex samples such as cell lysates, showing its applicability. The versatility of the analytical method proposed may allow its application in routine laboratory analysis of SCOMT and MBCOMT in various biological matrices such as blood, breast tissue, liver tissue or brain tissue.
Keywords
Pichia pastoris, Soluble methyltransferase, Membrane bound
5. Table of Contents
Chapter 1 - Introduction --- 1
1.1. Catechol-O-methyltransferase (COMT) --- 1
1.1.1. Physiological role of COMT --- 1
1.1.2. COMT isoforms, structure and kinetics mechanisms --- 2
1.1.3. COMT gene and polymorphisms --- 3
1.1.4. Distribution of human COMT --- 5
1.2. Relationship of COMT and human disorders --- 6
1.2.1. Parkinson’s disease --- 7
1.3. Recombinant hSCOMT biosynthesis and purification --- 8
1.4. Methods for protein quantification --- 9
1.5.1.1. Multiple reaction monitoring mass spectrometry --- 12
1.5.1.1.1. Target peptide selection --- 13
1.5.1.1.2. MRM transition selection and optimization --- 14
Chapter 2 – Aims --- 16
Chapter 3 – Materials and Methods --- 17
3.1. Materials --- 17
3.2. Methods --- 17
3.2.1. Plasmid and bacterial strain --- 17
3.2.2. Recombinant human SCOMT and MBCOMT production and recuperation --- 17
3.2.3. Immobilized metal affinity chromatography for SCOMT purification --- 18
3.2.4. SDS-PAGE and Western Blot --- 18
3.2.5. In-gel digestion --- 19
3.2.6. Total protein quantification --- 20
3.2.7. In-solution digestion --- 20
3.2.8. Total peptide quantification --- 20
3.2.9. Peptide sample preparation --- 20
3.2.10. Determination of the ideal MRM transition using skyline program --- 20
3.2.11. Liquid chromatography tandem-mass spectrometry (LC-MS/MS) operation conditions 21 Chapter 4 - Results and Discussion--- 22
4.1. Production and purification of hSCOMT-His6 --- 22
4.2. Peptide and MRM transition selection --- 25
4.3. Method optimization --- 32
4.3.1. High-performance liquid chromatography (HPLC) --- 32
XII
4.3.2.1. Temperature --- 32
4.3.2.2. IonSpray voltage --- 33
4.3.2.3. Nebulizer gas (GS1) and heater gas (GS 2) --- 33
4.3.2.4. Curtain gas (CUR) --- 34
4.3.3. Compound parameter --- 35
4.4. Method validation --- 35
4.4.1. Selectivity --- 36
4.4.2. Linearity and limits of detection and quantification --- 37
4.4.3. Precision and accuracy --- 39
4.4.4. Carry-over --- 40
4.4.5. Matrix effects --- 41
4.5. Quantification of COMT isoforms in Pichia pastoris lysates --- 43
Chapter 5 – Conclusions and future perspectives --- 44
6. List of Figures
Figure 1 - The crystal structure of human catechol-O-methyltransferase complex with
S-adenosyl-L-methionine. ... 2
Figure 2 - Genomic structure of the COMT gene and the relative location of the Met/Val polymorphism. ... 4
Figure 3 - Effects of the two alleles of COMT Val/Met in enzymatic activity and dopamine levels. ... 5
Figure 4 - Activities of SCOMT and MBCOMT in human tissues. ... 6
Figure 5 - Metabolisms of levodopa in blood-brain barrier. ... 8
Figure 6 - Components of a Mass Spectrometer. ... 11
Figure 7 - Typical quantification strategies. ... 12
Figure 8 - Functional outline of a MRM equipment. ... 13
Figure 9 - SDS-PAGE (A) and Western-blot (B) analysis shows of the hSCOMT presence in crude P. pastoris lysates. ... 23
Figure 10 - SDS-PAGE 15% (A) and Western blot analysis (B) of samples collected on chromatographic profile of figure 10. ... 24
Figure 11 - A typical chromatographic profile of SCOM_6His by HisTrap HP 5mL. ... 24
Figure 12 - Chromatograms obtained after analysis of SCOMT (A) and blank sample (H2O + 1% AF) (B). ... 28
Figure 13 - The SMR Collider results for the ion precursor 840.998. ... 29
Figure 14 - Chromatograms obtained after analysis of Glu1-Fibrinopeptide B at 500 fmol µL-1 (A) and blank sample (H2O + 1% AF) (B). ... 31
Figure 15 - Chromatograms obtained after analysis of blank sample matrixes spiked with SCOMT at 100 µg mL-1 and Glu1-Fibrinopeptide B at 150 fmol µL-1 (A)(B) and blank matrix without spike - mobile phase A (C); digested lysate (D). ... 37
Figure 16 - Graphical example of a calibration curve. ... 39
Figure 17 - Chromatograms obtained after analysis of a high concentration SCOMT standard at 200 µg mL-1 with Glu1-Fibrinopeptide B at 150 fmol µL-1 (A)(B)(C) and blank samples (D)(F)(G)(H)(I)(J)(K)(L). ... 41
Figure 18 - Chromatograms obtained after analysis of SCOMT at 100 µg mL-1 with Glu1-Fibrinopeptide B at 150 fmol µL-1 spiked in mobile phase A (A) and in digested lysate (C). The chromatograms (B) and (D) show the extract 840.998/485.308 ions from the chromatograms (A) and (C), respectively. ... 42
Figure 19 - Chromatograms obtained by the extract 840.998/485.308 ions after analysis of unknown SCOMT (A) and MBCOMT (B) in digested P. pastoris lysates. ... 43
XIV
7. List of Tables
Table 1 - Advantages and disadvantages of E. coli; yeast; insect cells and mammalian cells in
the biosynthesis of recombinant human proteins. ... 8
Table 2 - Conditions of MRM transitions evaluated in this work. ... 21
Table 3 - The exclusion reasons applied of each COMT peptide. The chosen peptides are underlined. ... 25
Table 4 - MRM transitions, declustering potential and collision energy precursor (Q1) of selected peptides exported from Skyline (91). ... 27
Table 5 - Conditions (DP and CE) of Glu1-Fibrinopetide B obtained from infusion optimization. ... 30
Table 6 - Signal value obtained at each temperature. ... 33
Table 7 - Signal value obtained at each IonSpray voltage. ... 33
Table 8 - Signal value obtained at each GS1 measure. ... 34
Table 9 - Signal value obtained at each GS1 measure. ... 34
Table 10 - Signal value obtained at each curtain gas measure. ... 35
Table 11 - Criteria of the relative abundance applied with different percentages of relative area. ... 36
Table 12 - Absolute area, relative abundance and retention time of transitions. ... 36
Table 13 - Linearity data and limits (n=5). ... 38
Table 14 - Within-run precision and accuracy (n=5). ... 40
8. List of Acronyms
18O Oxygen-18
2DE Two-dimensional gel electrophoresis
3-OMD 3-O-Methyldopa
A Adenine
AADC Aromatic amino acid decarboxylase
ACN Acetonitrile
AQUA Absolute quantitation
Asn Asparagine
Asp Aspartic acid
BA Ammonium bicarbonate
BCA Bicinchoninic acid assay
BMGY Buffered Glycerol Complex Medium
BMMY Buffered Methanol Complex Medium
BSA Bovine serum albumin
CE Collision energy
CID Collision induced dissociation
COMT Catechol-O-methyltransferase
CUR Curtain gas
CV Coefficient of variation
DIGE Difference gel electrophoresis
DP Declustering potential
DTT Dithiothreitol
ELISA Enzyme-Linked Immunosorbent Assay
ESI Electrospray ionization
FDA Food and Drug Administration
FIA Flow Injection Analysis
FT Fourier transformer
G Guanine
GS1 Nebulizer gas
GS2 Heater gas
HCl Hydrochloric acid
hMBCOMT Human MBCOMT
HPLC High performance liquid chromatography
hSOMT Human SCOMT
ICAT Isotope-coded affinity tag
ICH International Conference on Harmonization
IMAC Immobilized metal affinity chromatography
IS Internal standard
IT Ion trap
LC Liquid chromatography
L-DOPA L-3,4-dihydroxyphenylalanine
LLOQ Lower limit of quantification
LOD Limit of detection
LOQ Limit of quantification
Lys Lysine
m/z Mass-to-charge ratio
MALDI Matrix-assisted laser desorption/ionization
MBCOMT Membrane bound
catechol-O-methyltransferase
Met Methionine
MgCl2 Magnesium chloride
MRM Multiple reaction monitoring
mRNA Messenger RNA
MS Mass spectrometry
OD600 Cell density at 660 nm
XVI
PD Parkinson’s disease PFC Prefrontal cortex Pro Proline PVDF Polyvinylidene difluoride Q Quadrupole Q1 First quadrupole Q2 Second quadrupole Q3 Third quadrupole QC Quality controls R Correlation coefficient R2 Coefficient of determination RE Relative error RT Retention timeSAH S-adenosyl-L-homocysteine
SAM S-adenosyl-L-methionine
SCOMT Soluble catechol-O-methyltransferase
SDS Sodium dodecyl sulphate
SDS-PAGE Sodium dodecyl sulphate-polyacrylamide gel electrophoresis
SILAC Stable isotope labeling by amino acids
SRM Selected reaction monitoring
TIC Total ion current
TOF Time of flight
Tris Tris(hydroxymethyl)aminomethane
Trp Tryptophan
Val Valine
1
Chapter 1 - Introduction
1.1. Catechol-O-methyltransferase (COMT)
Catechol-O-methyltransferase (COMT, EC 2.1.1.6) was described for the first time by Axelrod and co-workers in 1958 (1). Since then, COMT has been seen as an important enzyme in catecholamine biochemistry and pharmacology. More recently, this enzyme has shown a significant role in genetic mechanisms of variation in catechol metabolism and its clinical implications (2).
1.1.1. Physiological role of COMT
COMT is an enzyme that catalyzes the transfer of the methyl group of S-adenosyl-L
-methionine (SAM) to the hydroxyl group of the catechol substrate in the presence of a divalent cation such as Mg2+. The result of this reaction is the O-methylated catechol and
S-adenosyl-L
-homocysteine (SAH), a known COMT inhibitor, representing a negative feedback loop (3). After methylated, the substrate is inactivated and is no longer capable of performing its physiological function and becomes susceptible to additional conjugation reaction (4). The O-methylation occurs primarily at the 3-hydroxyl (meta position), but depending on the experimental conditions and the nature of the side chain of the catechol substrate, also varying the amount of the 4-methylated (para position), catechol are produced (5). Physiological substrates of COMT include catecholamine neurotransmitters (epinephrine, norepinephrine and dopamine), hormones (such as catecholestrogens), ascorbic acid, some indolic intermediates of melanin metabolism and xenobiotic catechols (4, 6, 7). COMT is regulated by steroids, estrogen and thyroid hormone analogs (8, 9). Besides, COMT expression is changed during normal brain development and in response to environmental (10) as well as its activity is different between genders (11). The major physiological role of COMT is the elimination of biological active or toxic catechols (12). COMT is also an important metabolizer of catechol drugs (e.g. L-DOPA,
methyldopa and isoproterenol) (4, 13) and has been suggested that plays a relevant role in modulating prefrontal cortex (PFC) dopamine neurotransmission (14-16). Besides, it protects the placenta and the developing embryo from activated hydroxylated compounds formed from aryl hydrocarbons by hydroxylases (17). The physiologically important role played by this enzyme has been widely demonstrated by several pharmacological studies indicating that in
vivo inhibition of this enzyme by a variety of inhibitors or competitive substrates potentiates
the physiological actions of catecholamines, which exert an innumerable of effects in a large variety of tissues (8).
1.1.2. COMT isoforms, structure and kinetics mechanisms
There are two COMT isoenzymes: a soluble form (SCOMT) and a membrane bound form (MBCOMT), with different roles in the metabolism of catecholamines and other catechol compounds (18). These isoforms share similar affinities for SAM (5) such as similar magnesium dependency, inhibition by calcium and a similar optimal pH for the activity (12). On the other hand, they differ from each other in their molecular weight, net surface charge (8), specificity and affinity for substrate (5), heat stability, response to a cation and enzymatic and kinetic properties (8). While SCOMT contain 221 amino acid residues and a molecular weight of 24.7 kDa, MBCOMT has an additional 50 amino acid residues in its amino terminal, a molecular weight of 30 kDa (19) and has a more negative charge (8). This extra peptide contains a stretch of 21 hydrophobic amino acid residues function as membrane anchor region (19) and contributes to the higher binding affinity of its substrates (5). MBCOMT has 10 to 100-fold higher affinity for catechol substrates than SCOMT (13) and a 10-fold higher binding affinity for the methyl donor SAM than the soluble form (6). However, SCOMT has much higher capacity (17). This means that at physiological low substrate concentration, MBCOMT would have much more preference for the O-methylation of catecholamines over SCOMT (5, 6). Both COMT isoforms favour 3-O-methylation (5).
Figure 1 - The crystal structure of human catechol-O-methyltransferase complex with S-adenosyl-L-methionine (20).
3
Vidgren and co-workers (1991) were the first to resolve the tree-dimensional structure of the rat SCOMT (21). Although there was no high-resolution structure of human COMT described, the human enzyme is probably similar to a rat structure because the amino acid sequence is 81% similar (14).
COMT has one-domain α/β containing seven-stranded β-sheet sandwiched between two sets of α-helices, five helices on one side and three on the other side. The strands are arranged in the order 3-2-1-4-5-7-6, where strand 7 is antiparallel to the others (Figure 1) (22, 23). This topology is characteristic of the SAM-dependent methyltransferase fold family (22). The active side of the enzyme is formed in the vicinity of the Mg2+ by residues from the amino terminal
helices, through the SAM-binding fold (Rossman fold) to the loop in the C-terminal β-strands (7, 21), which binds one magnesium ion and the catechol substrate, and the SAM-binding region. While SAM is buried within the structure of the enzyme, the catalytic site is a shallow groove located on the outer surface (12).
Methylation reaction follows a sequentially ordered mechanism (5). Firstly, SAM bound to COMT, followed by Mg2+, which converts the hydroxyl groups of the catechol substrate to be
more easily ionisable. The proton from that hydroxyl group is accepted by a COMT lysine residue (Lys144) which is close to those substrate groups. Then, the methyl group from SAM is transferred to the hydroxyl group. Lysine acts as a general catalytic base in this base-catalysed nucleophilic reaction. The Mg2+ has an octahedral coordination among two aspartic acid
residues (Asp141 and Asp169), one asparagine residue (Asn170), one water molecule and among two catechol hydroxyls of the substrate (12, 17). Then, the “gatekeeper” residues (Trp38, Trp143 and Pro174) that form the hydrophobic “walls” join directly in the methylation reaction, by keeping the planar catechol ring in the correct position. These also define the selectivity of COMT toward different substrates (12, 17). Human COMT contains seven cysteines residues that probably exist as free thiol groups in vivo, but three of them are located in surface loops with their sulfur atoms exposed to solvent, making a potential site for intermolecular disulfide bond formation and protein aggregation (22).
1.1.3. COMT gene and polymorphisms
There is one single COMT gene, which encodes both SCOMT and MBCOMT. This gene is localized on the chromosome 22, band q11.2 and spans 28 kb (24) and contains six exons with the first two being noncoding. The expression of the COMT gene is controlled by two distinct promoters located in exon 3 (6). The distal 5’ promoter (P2) regulates synthesis of 1.5 kb mRNA (Figure 2). This mRNA can code for both MBCOMT and SCOMT proteins by using the leaky scanning mechanism of translation initiation. The shorter transcript, 1.3 kb mRNA, is regulated by P1 promoter, which is located immediately before its start codon S-ATG and overlaps the start codon for MBCOMT. Furthermore, it can only code for SCOMT (6, 17). The regulation of the COMT gene expression seems to occur at transcription initiation, at translation initiation
and at mRNA splicing (7). Silencing gene through methylation may be a further regulatory mechanism (25).
Figure 2 - Genomic structure of the COMT gene and the relative location of the Met/Val polymorphism (26).
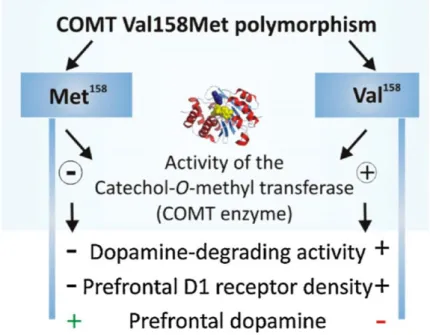
COMT exist in a multiple polymorphic forms due to the present of occasional mutations in the gene (27). Withal, there is an extensively studied polymorphism of COMT gene that leads to changes in the enzymatic activity. This functional and common polymorphism is caused by transition from guanine to adenine (G -> A), at codon 108 of SCOMT or 158 of MBCOMT, resulting in a substitution of valine by methionine (Val108/158 -> Met108/158). Although the structures and catalytic activities of the two enzymes were similar, the Met108/158 form of COMT has a lower thermal stability and therefore a lower activity at physiological temperature (37 ºC), is more prone to inactivation through oxidation and has decreased protein levels in vivo. Thus, Val108/158 homozygotes have greater COMT activity and thermal stability and this genotype shows approximately one third more activity than Met108/158 homozygotes. Because the alleles are codominant, heterozygotes have intermediate levels of COMT activity (12, 13, 22, 25). The different activities of this COMT polymorphism result from the different thermal stability of the two enzymes forms and not from their kinetic properties, because that residue 108/158 does not contribute to the active site of COMT. It is located in the α5-β3 loop, completely buried within a hydrophobic pocket, about 15-20 Å from the binding side of SAM on the opposite side of COMT molecule (5, 22). COMT Val/Met due to differences in enzyme activity, alters dopamine levels in the prefrontal cortex. The Val108/158 homozygotes have an upregulation of dopamine D1 receptor densities which is a compensatory response for a lower dopamine tone, in cortical and limbic areas including prefrontal cortex. In contrast, Met108/158 homozygotes exhibit higher rates of prefrontal dopamine turnover, and thus higher dopamine availability and dopamine dependent signalling, which in turn contributes to differences in neural functioning (Figure 3) (28).
5
Figure 3 - Effects of the two alleles of COMT Val/Met in enzymatic activityand dopamine levels (adapted from (28)).
No equivalent polymorphism has been found in any other species and therefore, the Met108/158 may be specific to humans and it appears that COMT activity has decreased during evolution (2, 25). None of the other polymorphism reported for COMT appeared to have any physiological significance (27, 29).
1.1.4. Distribution of human COMT
COMT is present in prokaryotes and eukaryotes, namely bacteria, yeast, plants and animals, invertebrates and vertebrates (12). COMT is an intracellular enzyme and is widely distributed throughout the organs of the body, being found in practically all mammalian tissues investigated (17). However, the highest levels of COMT activity were found in liver, followed by kidney and the gastrointestinal tract, while the cardiac tissue has the lowest activity and skeletal muscle has none. In most tissues, COMT is larger present as SCOMT and only a small fraction as MBCOMT. Conversely, in the human brain (adrenal medulla), nearly 70% of the COMT activity is contributed by MBCOMT and only 30% by SCOMT (Figure 4), likely reflecting its higher affinity for the catecholamine neurotransmitters (6, 12, 18, 30, 31). In brain, COMT is located at the nerve ending region, central nervous system, cytoplasm of neurons, around the blood-brain barrier (ventricular ependymal cells, choroid plexus, leptomeninges, etc.) and in glial cells (13, 32). Besides that, COMT activity is mainly in the prefrontal cortex (16). In clinical studies, COMT activity is most conveniently determined in erythrocytes (18, 33). Also, changes in the level of COMT activity have been observed during mammalian development, along with ageing and in connection with the oestrus cycle (4).
About the subcellular localization, MBCOMT resides in intracellular membranes oriented on the cytoplasmic side of the rough endoplasmic reticulum, while SCOMT is mainly located in the cytoplasmic compartment and, also in the nuclei. The different distribution of S- and MBCOMTs in different subcellular compartments suggest that the contribution of each COMT to the methylation of a substrate in a given cell or tissue will not only depend on the kinetic properties of the enzymes of each substrate but also depend on the intracellular distribution characteristics of the enzymes as well as the substrate (6, 7, 34, 35).
Figure 4 - Activities of SCOMT and MBCOMT in human tissues (adapted from (18)).
1.2.
Relationship of COMT and human disorders
The catechol-O-methyltransferase gene has attracted strong neuroscientific interest due to its implication in dopaminergic neurotransmission. In particular, the literature has focused on the association between polymorphisms in the COMT gene and various cognitive phenotypes, psychiatric disorders and changes in brain activation and structure (26, 28). Despite many studies have failed, there are several works that have established significant correlations between the COMT genotype and human disorders (12). For example, studies in Chinese and Taiwan population (36) and Caucasian families (37) did not find a significant association with the developing schizophrenia. In contrast, two separate studies in European (38) and Asian population (39) indicated an effect of the Val158-allele for increasing the risk of
7
developing schizophrenia. In spite of many controversial results, the low allele (Met108/158) appears to have some association with aggressive and highly antisocial impulsive schizophrenia (40, 41), late-onset alcoholism (17), development of obsessive-compulsive disorder (9, 42), breast cancer (3, 4) and rapid cycling bipolar manic-depressive disorder (40). The high allele (Val108/158) was also associated with nervosa anorexia (43) and psychotic symptoms in Alzheimer’s disease (44). Beyond that, higher proteins levels of soluble COMT in cancerous endometrium were found, in contrast with higher levels of membrane-bound COMT in controls endometrium (45). The importance of the COMT gene for the risk of psychiatric disorders like schizophrenia is strengthened by pathologies like the 22q11.2 deletion that includes the COMT gene and causes velocardiofacial syndrome, which has been associated with brain abnormalities including reduced overall brain volume, midline defects and regional grey matter reductions in parietal and frontal lobes, as well as impairments in executive functions and psychotic symptoms (9, 28, 42).
Succinctly, conflicting results might be due to the complex nature of the diseases under study, being constructs of different anatomical, physiological, endocrinological and psychological endophenotypes with regards to brain function (28).
1.2.1. Parkinson’s disease
Parkinson’s disease (PD) is the most common neurodegenerative movement disorders, affecting 1-2% of the population over the age of 60 years and above 6 million people worldwide (46). Consequences resulting from the unknown of certain mechanisms underlying the condition with the poor diagnostic accuracy, absence of valid biomarkers and difficulties to elaborate therapeutic interventions that might significantly influence disease progression (47). PD has been essentially regarded as a disorder of motor function, producing a variable, asymmetric and progressive combination of resting tremor, bradykinesia, rigidity and postural instability (47). The core motor feature of Parkinson’s disease result from cell loss in the substantia nigra pars compacta and the degeneration of the nigrostriatal dopaminergic pathway (32, 48).
The main clinical interest in COMT relies on the possibility of using COMT inhibitors as adjuncts in the therapy of PD with L-3,4-dihydroxyphenylalanine (L-DOPA), precursor of
dopamine (23, 32). Unlike dopamine, L-DOPA crosses the blood-brain barrier and is then
decarboxylated to dopamine by aromatic amino acid decarboxylase (AADC) and released by presynaptic terminal in the striatum replenishing the dopaminergic deficiency. Inhibition of COMT stops conversion of L-DOPA to its metabolite 3-O-Methyldopa (3-OMD) which helps to
increase the L-DOPA extracellular level. Thus, L-DOPA can be available for transport into the
brain which causes symptomatic dopamine relief (Figure 5) (12, 32). Nowadays, the dopamine replacement therapy with L-DOPA together with an inhibitor of aromatic amino acid
becomes clear the importance of developing more effective drugs for an effective COMT inhibition (19, 48).
Figure 5 - Metabolisms of levodopa in blood-brain barrier (adapted from(21)).
1.3.
Recombinant hSCOMT biosynthesis and purification
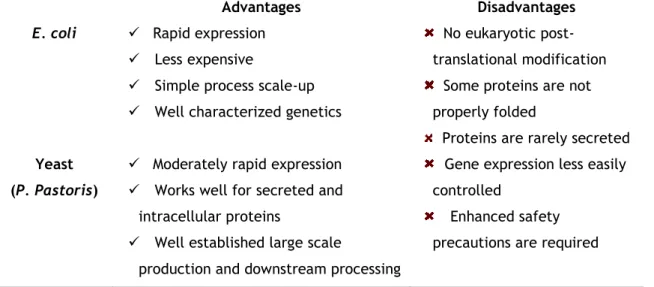
Recombinant technology is the best strategy to obtain large amounts of human proteins. Over the years, recombinant human SCOMT (hSCOMT) has been produced via different expression systems, such as transfected mammalian cells (35, 49), insect cells (baculovirus) (50), prokaryotic cells (E. coli) (6, 51, 52) and yeast (P. pastoris) (53). Each one has advantages and drawbacks (Table 1) to be taken into consideration in the selection of optimal expression system. The capacity of producing proteins at high levels, either intracellular or extracellular, and produce complex biomolecules that need to undergo posttranslational modification such as glycosylation, disulfide bridges formation and proteolytic processing, makes Pichia pastoris an ideal expression system for hSCOMT (54, 55).Table 1 - Advantages and disadvantages of E. coli; yeast; insect cells and mammalian cells in the biosynthesis of recombinant human proteins (56).
Advantages Disadvantages
E. coli Rapid expression
Less expensive
Simple process scale-up Well characterized genetics
No eukaryotic post-translational modification
Some proteins are not properly folded
Proteins are rarely secreted
Yeast (P. Pastoris)
Moderately rapid expression Works well for secreted and
intracellular proteins
Well established large scale
production and downstream processing
Gene expression less easily controlled
Enhanced safety precautions are required
9
Less expensive
Most proteins folding and post-translational modifications are possible
Insect cells (baculovirus)
Moderately rapid expression
Works well for secreted, membrane and intracellular proteins
Most protein folding and post-translational modification are possible
Expensive Difficult to scale-up Lack of information on glycosylation mechanism Mammalian cells
Works well for secreted and membrane proteins
All proteins folding and most authentic post-translational modifications are possible
Expensive
Yields of intracellular proteins are low
Difficult to scale-up
Typically, a high degree of COMT purity is a prerequisite for several laboratory applications, namely, kinetics trials, structural resolution and docking simulation. During the last decades, several purification procedures were been described to COMT. Usually, COMT protein has been isolated by chromatography procedures, such as size exclusion (57), anion (57-59) or cation exchange chromatography (60, 61), reversed-phase (57), hydrophobic interaction chromatography (51, 62) and by affinity chromatographic methods (14, 63). More recently, Immobilized Metal Affinity Chromatography (IMAC) was described by Pedro and co-workers (53) as an extremely efficient and selective strategy for the direct capture of hexahistidine tagged SCOMT with a great degree of purity and a high percentage of protein recover from recombinant
P. pastoris lysates. Therefore, this methodology was selected as purification strategy of target
proteins.
1.4.
Methods for protein quantification
Precise and exact quantification of proteins is essential for understanding, detecting and controlling many diseases. In the specific case of COMT, due its role in several mental disorders, accurate and selective measurements are essential requirements for COMT clinical investigation.
The difficulty in purifying proteins makes its quantification an analytical challenge (64). Spectrophotometric methods such as ultraviolet absorption, Bradford, Lowry and bicinchoninic acid (BCA) assays are usual used to quantify total protein content of a solution. The ultraviolet absorption methods estimates the amount of protein by measuring the characteristic absorption of tyrosine and tryptophan at 280 nm or peptide bond at 205 nm (65). The principle of Bradford assay involves the binding of Coomassie Brilliant Blue G-250 to protein at acid pH that causes a
shift in the absorption maximum of the dye from 465 to 595 nm (66). Both Lowry and BCA assays depends on the reduction of Cu2+ to Cu+ by proteins in alkaline solutions (Biuret reaction). While
BCA is one step assay and results of an intense purple colour with an absorbance maximum at 562 nm (67), Lowry assay requires one more step after Biuret reaction, which is the reduction of the Folin-Ciocalteu reagent producing a characteristic blue colour with absorbance maxima at 750 nm (68). These spectrophotometric methods are sensitive, simple, inexpensive and fast, but they are not protein specific and require an appropriate protein standard or constituent amino acid sequence information to make an estimate of concentration value (64, 65).
On the other hand, proteins and peptides in biological matrices have been quantified by enzyme-linked immunosorbent assay (ELISA) and Western blot, which works by applying antibodies, with high specificity and sensitivity. However, these methods are limited by the considerable time and cost invested in the development of antibody reagents for each target protein. Also, they have an insufficient selectivity and not enabling distinction between the peptide and its derivatives or degradation fragments (69, 70).
Beyond immunological methods one can also achieve protein quantification using gel-based approaches (DIGE) where quantification is achieved following 2DE and relies on pre-electrophoretic labelling of samples with one of three spectrally resolvable fluorescent CyDyes (Cy2, 3 and 5), allowing multiplexing of samples into the same gel (71). Although the method can provide the ability to detect many post-translational modifications and detecting hundreds to thousands of spots in one single gel, these assays have some limitations: they are expensive since many gels are required to achieve statistically valid results. Furthermore, it takes a long time for gel perform and analysis and it is difficult to determine low abundance proteins which makes unfeasible to look for smaller changes (71, 72).
Thereby, mass-spectrometry-based quantification methods have gained increasing popularity over the last years. The advantages of these methods are precision, sensitivity, throughput and convenient automation (73).
1.5.
Mass spectrometry for protein analysis
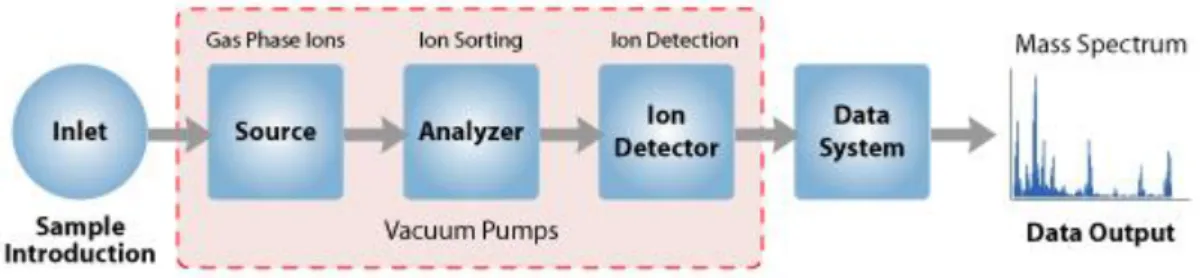
Mass spectrometry (MS) is commonly used for identification and quantification of a wide range of analytes such as drugs, lipids, proteins and peptides (74). It is an analytical technique that measures the mass-to-charge ratio (m/z) of ions based upon their motion in an electric or magnetic field. The instrumentation consists of three parts: an ionization source, a mass analyzer and a detector (Figure 6). Sample molecules are converted into ions in the gas phase by an ionization source formed positively or negatively charged ions which then are separated according to their m/z ratio using a mass analyser and finally detected (75). Proteins or peptides can be ionized by electrospray ionization (ESI) or matrix-assisted laser desorption/ionization (MALDI). The difference between both is that the MALDI sublimates and ionizes the samples out of a dry, crystalline matrix via laser pulses, while ESI ionizes the samples
11
out of a solution and are usually coupled to liquid-based separation tools. MALDI-MS is normally used to analyse relatively simple peptide mixtures, whereas integrated liquid-chromatography ESI-MS systems (LC-MS) are preferred for the analysis of complex samples. Usual mass analyzers for detection and analysis of biomolecules are the time of light (TOF), quadrupole (Q), ion trap (IT), Fourier transformer (FT) and orbitrap mass analyzers (73).
Figure 6 - Components of a Mass Spectrometer (52).
The traditional way for analysis of proteins is managed on the peptide level (bottom-up). Proteins are digested by a protease such as trypsin (cleavage after lysine or arginine) and the resulting peptides can be analyzed directly in a mass spectrometer or after separation common via liquid chromatography (69, 74). Although not usual, is also possible to obtain sequence information directly from full-length proteins (top-down) (76). The intact protein mass is first obtained by the mass spectrometer and isolated for MS/MS analysis by dissociation techniques (e.g. CID) to provide sequence information (69). Compared to full-length proteins, peptides are more easily ionized in the mass spectrometer leading to an increased sensitivity [57].
Protein quantification can be done by peptide labelling or using label-free methods (Figure 7). The first approach uses stable isotopes to label peptides, introducing a mass difference between the labelled and unlabelled peptides that can be recognized by a mass spectrometer leading to a relative quantification (77). These mass tags can be introduced into proteins or peptides metabolically (SILAC), by chemical means (ICAT, iTRAP), enzymatically (18O), or provided by spiked synthetic peptide standards (AQUA)(78). On the other hand,
label-free quantification (PAI, TIC) aims to provide quantitative information without introducing any form of labelling. These methods present many advantages over labelled strategies: they are fast, cost-effective and uncomplicated since no additional sample preparation is required (72, 77).
Figure 7 - Typical quantification strategies (Adapted from (77)).
1.5.1.1. Multiple reaction monitoring mass spectrometry
In addition, Multiple Reaction Monitoring (MRM) or Selected Reaction Monitoring (SRM) is a targeted MS/MS method that has been used in analysis of small molecules before being used in proteomics. It has emerged as a very promising technique for protein and peptide quantification in alternative to immunoassays (70, 77). Quantitative study of a specific set of,
à priori, known proteins is the aim of MRM. Selected peptides for these proteins are featured
by monitoring transitions, which are the precursor-fragment ion pairs isolated by MS (77). Thus, this method requires only knowledge of the masses of the selected peptide and its fragments ions (70).
Relating to logistics, triple quadrupole mass spectrometers are typically used for MRM experiments, which have three serially placed quadrupole mass analyzers (Figure 8). The first (Q1) and the third quadrupole (Q3) are used to scan for ions, while the second quadrupole (Q2) is worn as a collision cell and to transmit all fragment ions to Q3. Only the specific m/z ratio(s) of the pre-selected precursor ion(s) is transmitted through the Q1, whilst all others ions are ignored. The precursor ion(s) is fragmented by collision-induced dissociation (CID) in Q2, and thereafter all resulting fragment ions (daughter ions) are transmitted to the Q3. In third quadrupole, only ions corresponding to the pre-set m/z rations of selected fragment ion(s) are transmitted to the detector, while all ions will be excluded (74).
The great advantages of these techniques are the ability to quantitative a large number of analytes in a single scalable measurement process, low limit of quantification, cost-effective, high throughput and analytical reproducibility (70). These overcomes ensure high
13
accuracy, sensitivity and specific detection of analytes in complex matrices, including wholes blood, plasma and cell lysates, since a signal is registered only when a pre-selected fragment ion is produced by a pre-selected precursor (70, 74, 79, 80).
Figure 8 - Functional outline of a MRM equipment (81).
1.5.1.1.1. Target peptide selection
During the design of MRMs trials, it is recommended to use specific peptides from each protein. The selection of proteotypic or signature peptides is the first and most critical step in MRM analysis of target proteins (70, 74).
These peptides must have several intrinsic characteristics. Foremost, selected peptides must be unique to the protein(s) which will be monitored and be distinguishable from matrix ions. They should ionize and fragment well, providing abundant ions in the mass spectrum and more sensitive assay. Also they must ensure that the mass to charges ration (m/z) of the selected peptides is compatible with the mass range of the instrument used (70, 74). Beyond that, peptides that contain amino acids that are prone to post-translational modifications and with potential artefactual modifications during samples preparation should be avoided. Whereby peptides containing cysteine and methionine should not be used, since cysteine is typically modified during sample preparation and due to methionine ability to undergo oxidization. Moreover, peptides containing histidine should be discarded because the possibility of alterations in the side chain charge. Because asparagine and glutamate are prone to deamination and N-terminal glutamine or glutamate form pyroglutamate, peptides containing these characteristics should also not be included. Furthermore, peptides with missed cleavages or non-tryptic cleavage sites should also not be used (70, 74, 82).
Finally, when it is not possible to avoid these peptides, it will be crucial to monitor both the modified and the unmodified versions of the peptide (70, 74).
1.5.1.1.2. MRM transition selection and optimization
After the selection of peptides, the most sensitive and robust transitions of target peptides must be chosen. Due to formation of multiple charged ions when peptides are protonated during ESI, the m/z rations have a large variation. Beyond that, multiple peaks can be observed from each peptide, since different degrees of protonation will coexist. Therefore, it is crucial the selection of transitions specific for the fragment which reveal the better signal (70). In general, fragmentation results in the production of two complementary peptide ion series: y-ions and b-ions. While y-ions retains a positive charge at its C-terminal end, b-ions retains the charge at the N-terminal end (70). The y-ions are typically the better choices because are more stable during fragmentation (74).
Usually, the best two to four transitions per peptide are chosen and for each precursor peptide (precursor ion) two or more peptide fragments (fragment ions) are selected for quantitative assays (70, 74).
Due to differences in fragmentation patterns between mass spectrometers, it is important to optimize each peptide individually to set the best balance of signal to noise. The parameters that can be optimized to improve instrument performance and sensitivity in an MRM assay include source-dependent and scan-based parameters (74). The first holds parameters such an IonSpray voltage, temperature and gas settings (CUR, GS1 and GS2). The IonSpray parameter controls the voltage applied to the sprayer, which ionizes the sample in the ion source. It depends on the polarity, and affects the stability of the spray and the sensitivity (74, 83). With regard to gas settings, curtain gas (CUR) prevents ambient air and solvent droplets from entering and contaminating the ion optics, while allowing the input of sample ions. Nebulizer gas (GS1) helps generate small droplets of sample flow, while the heater gas (GS 2) aids in the evaporation of solvent, which helps to increase the ionization of the sample. The optimal temperature is the lowest temperature at which the sample is vaporized completely. These parameters tend to be constant from day-to-day, but can vary gradually over time (70, 74). Scan-based parameters are specific to each of the transitions included in the method that include, besides the ion transitions, the transmission windows for Q1 and Q3, the collision energy (CE) and the dwell time for each transition. The transmission window sets the mass range that is transmitted through Q1 and Q3 for a transition. The CE parameter controls the potential difference between Q0 and Q2 (collision cell), and it is the amount of energy that the precursor ions receive and fragment. Finally, dwell is the time in milliseconds that the system takes to scan a particular transmission (70, 74).
Sophisticated bioinformatics tools have been developed for MRM method optimization and data analysis including MRMpilot, Pinpoint, and Skyline (84). More specifically, Skyline is an open-source platform for data interpretation that provides and generates critical information for experimental design and analysis of MRM. Peptide transition lists are generated
15
by refinement of proteomic peptide lists from protein sequences or database entries, both by utilizing online MS/MS spectral repositories and by supporting the generation of custom-built libraries. It has an advantage over the other options being freely available for academic and commercial use(84, 85).
Chapter 2 – Aims
2.
Owing to role of the COMT into several disorders, a fast, low-cost and precise measurement of this protein in complex samples are essential for COMT clinical investigation. Thus, this work is divided into three main objectives, which are:
Produce recombinant SCOMT_6His and MBCOMT_6His and purify the soluble form. Develop and validate a high specific methodology for detection and assessment of
SCOMT by liquid chromatography-multiple reaction monitoring (MRM) mass spectrometry.
Evaluate the applicability of the propose methodology in Pichia pastoris lysates containing one or both COMT isoforms.
17
Chapter 3 – Materials and Methods
3.1.
Materials
Ultrapure reagent-grade water was obtained with a Mili-Q system (Milipore/Waters). Acetonitrile and water (MS-grade) from Fisher were acquired from Enzymatic (Santo Antão do Tojal, Portugal). Zeocin were obtained from Invitrogen (Carlsbad, CA). Yeast nitrogen base (YNB), glucose, agar, yeast extract, peptone, dithiothreitol (DTT), glycerol, glass beads (500 μm), ureia, tripsin and formic acid (for mass spectrometer) were purchased from Sigma Chemical Co. (St. Louis, MO). The NZYcolour Protein Marker II used for estimation of subunit molecular weight was purchased fromNZYTech (Lisboa, Portugal). Bis-Acrylamide 30% was obtained from Bio-RAD (Hercules, CA). The High-Range Rainbow molecular weight markers used for estimation of subunit molecular weight and iodoacetamide and anti-rabbit IgG alkaline phosphate secondary antibody were purchased from GE Healthcare Biosciences (Uppsala, Sweden) while monoclonal rabbit COMT antibody was purchased from Abcam (Cambridge, England). The Glu1-Fibrinopeptide B was purchased from AB Sciex (Framingham, USA). All chemicals used were of analytical grade, commercially available, and used without further purification.
3.2.
Methods
3.2.1. Plasmid and bacterial strain
The plasmid pICZαA-hSCOMT_His6 (Invitrogen Corporation, Carlsbad, CA, USA) was used for recombinant SCOMT production on Pichia pastoris X-33 Mut+ strain. For recombinant
MBCOMT production, it was used the plasmid pICZαA-hMBCOMT_His6 (Invitrogen Corporation, Carlsbad, CA, USA) on Pichia pastoris X-33 Mut+ strain.
3.2.2. Recombinant human SCOMT and MBCOMT production and
recuperation
P. pastoris cells were grown for 72 hours at 30 ºC in YPD medium plates (1% yeast
extract, 2% peptone, 2% glucose and 2% agar) containing 200 μg mL-1 Zeocin. A single colony
was inoculated in 100 mL of BMGY (100 mmol-1 potassium phosphate buffer (pH 6.0), 1.34%
yeast nitrogen base, 4 × 10⁻⁴ g L−1 biotin and 1% glycerol) in 500 mL shake-flasks and grown
overnight at 30 ºC and 250 rpm to a cell density at 600 nm (OD600) typically 6. Then, an aliquot
of the fermentation in the medium BMGH was collected and centrifuged (500 xg, 5 min) to remove glycerol and was added to 125 mL of BMMY medium (100 mmol L−1 potassium phosphate
shake-flasks to an initial OD600 fixed to 1.0 unit. After a 24 hours growth at 30 ºC and 250 rpm,
cells were harvested by centrifugation (1500 xg, 10 min, 4 ºC) (53).
Thereafter, cells were lysed in equilibrium buffer (150 mmol L−1 NaCl, 10 mmol L−1 DTT,
50 mmol L−1 Tris, 1 mmol L−1 MgCl
2, pH 8.0) at a ratio of 1:2:2 (1 g cells, 2 mL lysis buffer and
2 g glass beads). Lysis was accomplished through the application of a sequential procedure with glass beads of 7 cycles of vortexing for 1 min with 1 min of interval on ice. Subsequently, the mixture was centrifuged (500 g, 5 min, 4 ⁰C) and the pellet obtained was resuspended in the chromatographic binding buffer (500 mmol L−1 NaCl, 50 mmol L−1, Tris 1 mmol L−1 MgCl
2 and 5
mmol L-1 Imidazol at pH 7.8) (53).
3.2.3. Immobilized metal affinity chromatography for SCOMT
purification
Chromatographic experiments were performed in an ÄKTA Avant system with UNICORN 6.1 software (GE Healthcare, Uppsala, Sweden). The chromatographic experiments were performed on HisTrapTM FF crude (5 mL), a prepacked IMAC stationary phase with nickel ions (GE Healthcare, Uppsala, Sweden). All buffers pumped into the system were prepared with Mili-Q system water, filtered through a 0.2 µm pore size membrane (Schleicher Schuell, Dassell, Germany) and degassed ultrasonically. The column was initially equilibrated with 500 mmol L−1
NaCl, 50 mmol L−1 Tris, 1 mmol L−1 MgCl
2 and 5 mmol L-1 Imidazol at pH 7.8. Aliquots of
resuspended pellet in equilibration buffer at a ratio of 1:5 (1 g cells to 5 mL buffer), were injected onto the column using a 2 mL loop at a flow rate of 0.5 mL min−1. After elution of the
unretained species, the flow rate rise to 1 mL min−1 and imidazole concentration was increased
from 0 to 50 mmol L−1 at for 5 column volumes (CVs), followed by a step at 70 mmol L−1 of
imidazole (5 CVs), other at 300 mmol L−1 of imidazole (5 CVs) and finally at 500 mmol L−1 (5
CVs) (53).
In all chromatographic runs, the conductivity, pH, pressure and absorbance at 280 nm were continuously monitored. The target hSCOMT fractions were collected at 300 mmol L−1 of
imidazole, pooled according to the chromatograms profile obtained and concentrated and desalted with Vivaspin concentrators (10.000 MWCO).
3.2.4. SDS-PAGE and Western Blot
Reducing Sodium Dodecyl Sulphate-Polyacrylamide Gel Electrophoresis (SDS-PAGE) and western blot were performed according to the method of Laemmli (86) and as previously described (87). Samples were prepared in loading buffer (500 mmol L−1 Tris-CL (pH 6.8), 10%
(w/v) SDS, 0.02% bromophenol blue (w/v), 0.2% glycerol (v/v), 0.02% 2-mercaptoethanol (v/v)) at ratio of 3:1 (30 µL sample to 10 µL loading buffer) and were denatured at 100 ⁰C for 5 min. The run was performed on 4% stacking gel and 15% resolving gel containing 0,1% SDS with a
19
running buffer (25 mmol L−1 Tris, 192 mmol L−1 glycine, 0.1% SDS (w/v)) at 120 V for 1 h 40 min.
Then, gel was stained by blue Coomassie (87).
For Western Blot, the gel was transferred to a polyvinylidene difluoride (PVDF) membrane. In this case, proteins were transferred over a 40 min period at 750 mA at 4 ºC in a buffer containing 10 mmol L−1 CAPS and 10% (v/v) of methanol. After the blotting, the
membranes were blocked with TBS-T (pH 7.4) containing 5% (w/v) non-fat milk for 60 min at room temperature, washed 3 times during 15 min and exposed overnight at 4 ºC to a rabbit anti-rat SCOMT polyclonal antibody, that cross reacts with the human protein, at 1:1000 dilution in TBS-T 1%. The filters were washed three times during 15 min with TBS-T and adherent antibody was detected by incubation for 1 h with an anti-rabbit IgG alkaline phosphatase secondary antibody at 1:40000 dilution in TBS-T 1%. The PVDF membranes were air dried, incubating with 1 ml of ECL for 5 min and enhanced by exposure to chemiluminescence’s detection (87).
3.2.5. In-gel digestion
In-gel digestion was performed only for the development of SCOMT standard. This protocol was implemented and adjusted from Shevchenko and co-workers (88).
After cut the SCOMT protein band, the gels pieces were washed three times in wash solution (50% acetonitrile (ACN), 25 mmol L−1 ammonium bicarbonate (BA)) at 37 ⁰C in constant
agitation during 15 min each. Then, acetonitrile was added to the gels and incubate at room temperature until gel pieces become white and shrink. All acetonitrile was removed by speed vacuum. After that, the gel pieces suffer reduction by adding 10 mmol L−1 DTT in 25 mmol L−1
BA and incubated 60 min at 56 ⁰C. Then, the liquid is removed and the gels were alkylated by adding 55 mmol L−1 IAA in 25 mmol L−1 BA and incubated in dark at room temperature during 30
min. The gel pieces were washed again three times in wash solution and saturated with trypsin (20 ng µL-1), 40% BA and 9% ACN during 60 min in ice. Subsequently, the gel pieces were
incubated overnight at 37 ⁰C for protein digestion. Thereafter, the liquid was removed to new tubes and the peptides were extracted by adding 0.1% AF, 0.1% AF in 50% ACN and 0.1% AF in 80% ACN. Between each addition, gel pieces were incubated for 15 min at 37 ⁰C and the resultant liquid was removed to the new tubes. Finally, the resultant liquid of the new tubes was dry by speed vacuum and stored at -20 ⁰C until used (88).
3.2.6. Total protein quantification
Protein content in complex samples (cell lysates) was measured by the Pierce BCA Protein Assay Kit (Thermo Scientific, USA), using BSA as the standards (0.025 – 2.0 mg ml-1),
according to manufacturer’s instructions.
3.2.7. In-solution digestion
In-solution digestion was performed for the digestion of complex samples, such as cell lysates, containing SCOMT and MBCOMT. This protocol was adjusted from Medzihradszky (89).
The sample was dissolved in a buffer with 50 mmol L−1 Tris-HCl (pH 8), 5 mmol L−1 DTT
and 8 mmol L−1 Urea to a final concentration of approximately 1 mg mL-1 and incubated 60 min
at 37 ⁰C. After cooling to room temperature, iodoacetamide was added to a final concentration of 50 mmol L−1 and the sample was incubated 40 min at room temperature. To reduce the urea
concentration, the sample was diluted 10 times in buffer 50 mmol L−1 BA. Then, the sample
was digested by adding a trypsin solution (20 ng µL-1) with 40% BA and 9% ACN in ratio 1:10 (v/v)
to a final ratio of 1:20 between tripsin:protein in sample; and incubated for 16 hours at 37 ⁰C. To stop the digestion, formic acid was added to a final concentration of 5% (v/v).
3.2.8. Total peptide quantification
Peptide content in samples was measured by the Pierce™ Quantitative Colorimetric Peptide Assay Kit (Thermo Scientific, USA), using Peptide Digest Assay Standard as the standards (0.0156 – 1.0 mg ml-1), according to manufacturer’s instructions.
.
3.2.9. Peptide sample preparation
The samples were concentrated and desalted by using reversed-phase C18 Zip-Tips ™ (Millipore, Bed- ford, MA, USA) according to the manufacturer's recommendations. Peptides were eluted in 10 µL of 80% ACN with 0,1% formic acid and made up with water with 0.1% formic acid until achieved a final volume of 40 µL. Then, every samples were spiked with 5 µL of Glu1-fibrinopeptide B 1350 fmol µL-1 (Intern Standard - IS).
3.2.10.
Determination of the ideal MRM transition using skyline
program
It was used an in silico method utilizing the Skyline program to determine the optimal MRM transition precursor (Q1) and fragment (Q2) ions. The FASTA file for COMT was acquired from a well-known freely accessible database of protein sequences, called UniProt (90). Then, this file was imported into the Skyline program (91) and its precursor and fragment ions were generated by performing in silico trypsin digestion. The peptides were used according to the rules described above and the precursor length range was set at 8 to 25 amino acids. Beyond
21
that, it was used an online tool SRM Collider for compare transitions to all others in a given background proteome and find interferences. This approach is currently applied for identify characteristic transitions. The Skyline transitions were imported into SRM Collider (92) and the conditions were pre-selected with the exception of the genome which was selected as Human PeptideAtlas (tryptic).
3.2.11.
Liquid chromatography tandem-mass spectrometry
(LC-MS/MS) operation conditions
This protocol was adjusted from Chen and co-workers (93) and Kay and co-workers (94). Absolute quantification was performed using a JASCO X-LC™ system (3167CO, 3080DG, 3159AS, 3185PU) connected with a 4000 QTrap (AB Sciex) equipped with a Turbo V™ Ion Source operating in the positive ion mode. The software used for controlling this equipment and analyzing the data was Analyst Version 1.6.1 (AB Sciex). Samples were detected in a multiple reaction monitor (MRM) mode. For the optimization of MRM parameters of Glu1-Fibrinopeptide B, the peptide was infused with mobile phase at a flow-rate of 10 µL min-1 using a syringe pump
(Harvard Apparatus, Holliston, MA, USA). The optimization of MRM parameters of COMT was done through the Flow Injection Analysis (FIA) compound optimization. For each run was injected a total of 5 µL of sample and the peptide separation was achieved in 20 min on Synergi 4U Fusion-RP 80A column (50 × 2.0 mm, 4 μm, Phenomenex) at a flow rate of 100 μL min-1. The
mobile phases were (A) 0.1% formic acid in water and (B) 0.1% formic acid in acetonitrile. After an isocratic step of 2 min at 2% phase B, a linear gradient from 2% to 30% B was run over the next 8 min, then was an isocratic set of 4 min at 80% phase B followed by a linear gradient from 80% to 2% B and finally a 4 min of an isocratic gradient at 2%. All source (temperature, IonSpay, GS1, GS2 and CUR) and compound parameters (DP, CE) were subjected to optimization. The 4000 QTrap optimal instrument source parameters were ion spray voltage at 5000 V, the heater gas temperature at 550 ⁰C, a nebulizer gas (GS1) of 80 Pa, a heater gas (GS2) of 50 Pa and a curtain gas of 20 Pa. Optimal conditions of final MRM transitions, declustering potential (DP), collision energy (CE), Dwell are shown in Table 2. Peak areas were integrated using the MultiquantTM 2.1.1 software (ABSciex).
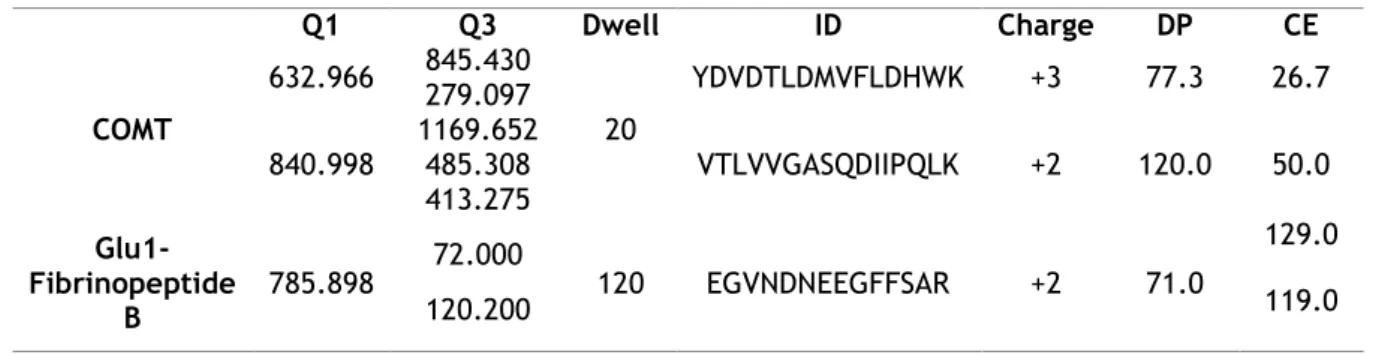
Table 2 - Conditions of MRM transitions evaluated in this work.
Q1 Q3 Dwell ID Charge DP CE COMT 632.966 845.430 20 YDVDTLDMVFLDHWK +3 77.3 26.7 279.097 840.998 1169.652 485.308 VTLVVGASQDIIPQLK +2 120.0 50.0 413.275 Glu1-Fibrinopeptide B 785.898 72.000 120 EGVNDNEEGFFSAR +2 71.0 129.0 119.0 120.200
Chapter 4 - Results and Discussion
Nowadays, quantitative information of the expressed proteins is needed and constitutes a key-step to completely understand functions of organelles, cells, organisms as well as biochemical processes of modern society diseases. For this purpose, approaches for rapid, highly reproducible and accurate quantification of therapeutic proteins are crucial (95).
There is a large interest of COMT quantification due to its association with several neurological diseases. This work aims to develop a rapid, inexpensive, sensitive and accurate method capable of quantifying both COMT isoforms in complex samples. Thus, it was developed and applied a MRM method. Therefore, it was required to produce the COMT protein recombinantly and purifies it in order to create a COMT standard. Subsequently, this target fraction should be used in the calibration curves in order to determine quantitatively the COMT protein in complex samples such as cell lysates.
4.1.
Production and purification of hSCOMT-His6
The first part of this work involved hSCOMT production and purification.To obtain hSCOMT it was applied the same conditions previously described (53), since their production has succeeded in a Pichia pastoris expression system, using as a construct the plasmid pICZαA-hSCOMT_His6. In this approach, the protein is produced with a hexahistidine in its carboxyl-terminal, which will facilitate subsequent purification. Typically, P. pastoris have the capacity to secrete soluble proteins, however our target protein was retained intracellularly. Indeed, SDS-PAGE and western blot analysis indicate the presence of hSCOMT in the lysis pellet (Figure 9).
23
Protein purification is carried out in two steps. First, an Immobilized Metal Affinity Chromatography (IMAC) was used with the same conditions earlier described in section 3.2.3. (53) with a different purpose of creating a COMT standard. This strategy was used because it was proved to be exceptionally efficient and selective for the isolation of hexahistidine tagged SCOMT.
As was described, the protein of interest is eluted with 300 mmol L−1 imidazole in a
stepwise gradient previously optimized (53) (Figure 10). This behaviour, this was confirmed by SDS-PAGE and western- blot analysis (Figure 11).
Figure 9 - SDS-PAGE (A) and Western-blot (B) analysis shows of the hSCOMT presence in crude P. pastoris lysates. MW – molecular weight standards; L – lysis pellet. The molecular weight of 25 kDa is indicated by red box and human SCOMT position by the red arrow.
hSCOMT_6His
Figure 11 - A typical chromatographic profile of SCOM_6His by HisTrap HP 5mL with 2 mL loop and flow of 1 ml min-1. Absorption was made with 500 mmol L−1 NaCl, 50 mmol L−1 Tris, 1 mmol L−1 MgCl
2, and 1 mmol L−1 imidazole, pH 7.8. Elution by stepwise gradient of 0%, 10%, 14%, 60% and 100% of imidazole in the buffer composes: 500 mmol L−1 NaCl, 50 mmol L−1 Tris, 1 mmol L−1 MgCl
2 and 500 mmol L−1 imidazole, pH 7.8. The peak elution of COMT is indicated by the red arrow.
Figure 10 - SDS-PAGE 15% (A) and Western blot analysis (B) of samples collected on chromatographic profile of figure 10. MW – molecular weight standards; 1 – fraction obtained at 300 mmol L−1 imidazole. The molecular weight of 25 kDa is indicated by red box and human SCOMT position by the red arrow.