Universidade do Algarve
Faculdade de Ciências e Tecnologia
Ana Flor Torres Vidal
Mestrado em Biologia Marinha
Trabalho efetuado sob orientação de: Prof. Doutor Duarte Duarte
Prof.ª Doutora Margarida P. Reis
Universidade do Algarve
Faculdade de Ciências e Tecnologia
Ana Flor Torres Vidal
(Licenciada em Biologia Marinha)
Faro 2015
Tese de Mestrado em Biologia Marinha Orientada por:
Prof. Doutor Duarte Duarte Prof.ª Doutora Margarida P. Reis
CIMA – Laboratório de Ecologia Molecular e Microbiana (No bench fees required)
Acknowledgements
This part of the work can be the most challenging to write, not because it’s hard to acknowledge others, but because it’s hard to do so adequately.
It has no doubt been a journey up until now, one of many and nonetheless a long lasting one, filled with many challenges and undertakings.
I have more than many regards to present to all of you, though I don’t seem to have enough pages to write them on, and so in a global sense… Thank You!
I have a wonderful bunch of friends who provide unwavering support for my writing endeavors, and whatever craziness would cross my mind at the moment. A magnificent family always ready to maintain my livelihood and spirit. Some great colleagues who where always eager to aid in any momentary lack of memory, clouding my judgment. And without a doubt not one but two amazing supervisors, who endured many non inspired moments and even then manage to encourage me a while more without any kind of pressure, which I’m not actually sure I totally deserved. And thought they were tireless in their teachings and managed to mitigate some of my ignorance, I asserted some personal character to a certain extent, so please know that any errors are of my own doing.
Working in the Microbial and Molecular Ecology Lab., under the supervision of Professor Margarida Reis has been very gratifying, and help me gain all sorts of knowledge, and develop my techniques.
I would like to thank everyone who has been through this lab, and in one-way or another has help me go forward with all the work. Special thanks to Sandra Mesquita, Filipa Esteves, Diana António, Cristina Costa, Sandra Caetano, Carla Freitas, Telma Valente and Catarina Diniz, for all their assistance and shared knowledge.
were also a way to catch some fresh air and exercise in the amazing scenario, that is the Ria Formosa.
A particular thanks is due to Maria Rodrigues, who was kind enough to assist us in fieldwork, when both Duarte and me were affected by injuries, and for all her assistance in the lab.
The conclusion of this work wouldn’t be possible without the indispensible help of Rodrigo Costa, Gianmaria Califano and Elham Karimi, for all their assistance, and for allowing me to use their equipment in the Microbial Ecology and Evolution Lab., when our systems failed.
Greetings are due, to Rita Andrade, Paulo Santana and Sónia Oliveira, for all their assistance with the sediment analysis, without which I would have struggled to find the correct way to treat and analyze my samples.
To all those who I assisted during this period, and helped me remember all the basic concepts, one sometimes tend to discard, Gisela Serrão, David Catita, Billy Hill, Nuno Magalhães, Fábio Anastácio, Nuno Soares, André Soares, Gonçalo Figueira… Very special thanks to all my friends, and in particular to Ana Raposo, Alexandra Alves, Ricardo Alves, Pétala Almeida, Diana Rocha, Maria José Guedes, Patricia Silva and Micaela Justo, who endured most of my bad mood.
Never forgetting my family, and in particular my parents who were always supportive of all my choices, a unique acknowledgement is due.
Finally, to Cima and UAlg, for providing me with the infrastructures and opportunity to develop such project, and to all companies with whom I worked and who were essential for my ability to endure all this long period: Aquaexam, SeaExpert, FormosaMar, Lands.
Abstract
The number and variety of species present in an area and their spatial distribution is the common definition for diversity. In order to reveal eventual bacteriobenthos diversity patterns associated to the different origins of the surface layers from sediments of several environments, different sets of environments within the inlet boundaries of a coastal lagoon (Ria Formosa) were studied, taking in major account the hydrodynamics and temporal variation and how it might affect the different sediment environments, and it’s biology. The general idea was to analyse the surface layer of given sets of sediments, and extract bacterial DNA that was aggregated to them, in the distinct locations. By doing so, the aim was to describe bacterial diversity in these environments, and find out how it could be related to different sediment origins. Are the bacterial populations the same in the different environments, or are there distinct pattern in their diversities? To ascertain the diversity of bacterial groups of different sediment environments, in the Ria Formosa Coastal Lagoon, a Nested PCR-DGGE (denaturing gradient gel electrophoresis) approach was used. Specific 16S cDNA primers were chosen according to the literature. After a first PCR (polymerase chain reaction) amplification, a second PCR was run in a more specific range within the first PCR product to produce a second PCR product, which was scattered by Denaturant Gradient Gel Electrophoresis (DGGE), creating specific group-patterns for further analysis. Statistical comparison between replicates and between different environments provided enough information to recognize specific bacteriobenthos diversity patterns.
Resumo
A diversidade pode ser definida como o número e variedade de espécies e a sua relação espacial, numa determinada área. De forma a observar eventuais padrões de diversidade bacteriobentónica associados com as diferentes origens das camadas superficiais de sedimentos de diferentes ambientes, pretendeu-se estudar diferentes conjuntos de ambientes sedimentares localizados nas imediações das barras do sistema lagunar da Ria Formosa, tendo em consideração o hidrodinamismo e a variação temporal e como poderão afectar os diferentes ambientes sedimentares e a sua biologia. Num contexto geral, pretendeu-se analisar a camada superficial de sedimentos, e proceder à extração de DNA das bactérias aderidas, nos diferentes locais. Pretendeu-se assim, avaliar a diversidade bacteriana nestes ambientes, e a forma como poderá estar relacionada com os diferentes ambientes sedimentares. Serão as populações bacterianas as mesmas nos diferentes ambientes, ou existirá um padrão distinto na sua diversidade? De forma a obter a diversidade dos grupos bacterianos de diferentes ambientes sedimentares, na Ria Formosa, procedeu-se à aplicação da técnica de “Nested PCR-DGGE” (electroforese desnaturante de amplicões obtidos em sucessivas reacções de PCR – reacção em cadeia da DNA polimerase). De acordo com a literatura, foram escolhidos fragmentos iniciadores («primer») específicos do 16S cDNA. Após a primeira amplificação, foi efetuada uma segunda com os produtos da anterior, resultando em amplicões mais específicos que foram subsequentemente separados por electroforese em gel desnaturante - DGGE, da qual se obtiveram perfis característicos. A comparação estatística entre os replicados e entre as amostras dos diferentes ambientes sedimentares, produziu informação suficiente para identificar padrões específicos de diversidade bacteriobentónica.
Palavra(s)-Chave: Diversidade, Bacteriobenthos, Ambientes Sedimentares, DGGE, Ria Formosa.
Contents
Abstract Resumo Acknowledgments Contents Introduction 1 Aims 1 Importance 1 Theoretical framework 2 Ria Formosa 6 Sediment environments 7 Benthic Prokaryotes 9 Diversity 11
Functional groups and their sediment interactions 14
Bacteriobenthos study limitations 15
Type of analysis and procedures 17
Organic matter 21 Statistical analysis 22 Procedures 23 Fieldwork 23 Sampling 25 Laboratory procedures 28 Geological analysis 29 Fine Sediments 29 Coarse Sediments 30 Mixed Sediments 31 Gradistat 33
Organic Matter determination 34
DNA extraction form sediments 34
Quantitative analysis of nucleic acids 36
Primers 36
PCR Amplification Protocols 37
Electrophoresis 39
Purification 39
DGGE and TTGE of 16S rDNA amplicons 39
Genetic Diversity Data Analysis 42
Other Techniques 42
Results & Discussion 43
Grain size analysis 44
Organic matter determination 51
Principal Component analysis 55
DNA extracted form sediments 57
Nested-PCR Amplification 57
Reference Marker from Bacterial strains 58
DGGE Analysis 60
Statistical Analysis 62
Principal Component analysis 67
Modifications and Incomplete analysis 69
Data comparison - Diversity/sediments relation 69
Conclusion 72
Practical applications 74
References 75
Annexes
I. Gradistat data analysis I
II. Organic Matter Protocol II
III. MoBio Extraction Procedures III
IV. ZipRuller(TM) Express DNA Ladder Set IV
V. NZYGelPure Procedures V
VI. DGGE Setup VI
VII. Silver Staining Protocol VII
VIII. Similarity Coeficients results VIII
IX. Optimized Band-matching Matriz IX
“As the oceans cover 70% of the earth’s surface, marine sediments constitute the second largest habitat on earth, after the ocean water column, and yet we still know more about the dark side of the moon than about the biota of this vast habitat.”
Gray & Elliott.
Introduction
Aims
The aim of this project was to establish a correlation between the type of surface sediment intertidal environments of two natural inlets surrounding in Ria Formosa, and the general prokaryotes encountered, by the application of molecular methods for its detection and identification, and the evaluation of the effect of barrier islands dynamics in the microbial composition of the surface sediment environments, in a spatial-temporal context.
Importance
This project was performed by the collection of data, from intertidal environments in Ria Formosa Coastal Lagoon, sampling its inlet surroundings. It contributes to the increase of knowledge about this vast system, through the molecular detection of prokaryotes present on specific surface sediment environments and by the
evaluation of the effect of the barrier dynamics on the microbial composition of such environments, according to its spatial distribution.
Through the integration of different field methods, a correlation between the type of sediments and organisms encountered in the environments was obtained, by applying molecular methods as analytical tools for its detection.
Theoretical Framework
As stated by Gray & Elliot (2009) marine sediments constitute the second largest habitat on earth. Within coastal sedimentary environments, coastal lagoons represent more than 10% of the world’s shoreline (Falcão & Vale, 1990), being defined by Kjerfve (1994) as, “shallow coastal water bodies separated from the ocean by a barrier, connected at least intermittently to the ocean by one or more restricted inlets, and usually oriented shore-parallel”.
The formation and maintenance of coastal lagoons is due to sediment transport processes. Being carried by rivers, waves, currents, winds, and tides (Nichols & Boon, in Anthony et al., 2009). Coastal lagoons trap inorganic sediment and organic matter, serving as physical sinks or filters (Kjerfve, 1994). The sediment accumulates in river and tidal deltas, on marshes and flats where submerged aquatic vegetation slows the currents, and allows deposition (Anthony et al., 2009). The process of sedimentation can eventually fill lagoons (Nichols & Boon, in Anthony et al., 2009). Lagoons from humid temperate zones are refreshed by rainfall and run off from their catchments, typically having estuarine regimes (Bird, 1994). They often exhibit very high primary and secondary production rates and are valuable for fisheries and aquaculture, and sometimes for salt extraction (Kjerfve, 1994).
Accordind to Kjerve (1994), the hydrological characteristics of a coastal lagoon are determined partly by its configuration and the nature and dimensions of the connections to the sea, and partly by the balance between freshwater and saltwater
inflow. This balance depends on one hand on evaporation, precipitation and
freshwater input from rivers, effluents and ground water aquifers and on the other hand on seawater inflow and its relation to tidal range and tidal ventilation of the lagoon. Sea-level history, shore-face dynamics, and tidal range are three main factors that control the origin and maintenance of sandy barriers, and therefore coastal lagoons (Martin & Dominguez, 1994). Although seldom considered the wind also plays an important role in these environments.
Marine sediments can be classified by their source, size (Wentworth, 1922), shape, texture or composition and distribution. Sediment composition, in each environment, is mainly dependent on sediment source; sediment transport or deposition processes; and chemical processes occurring in the sediment environment and surrounding water column (Perry & Taylor, 2007). According to their source or origin, sediments can be lithogenous, biogenous, hydrogenous and cosmogenous (Goldberg, 1963). Lithogenous (terrigenous) sediments are rock-derived sediments formed by weathering processes, and transported from continent’s soil and volcanoes, by wind, rivers, and currents. Their particles are deposited when the currents are too slow to keep them suspended. Wave action sorts the particles by size, moving the smaller ones further offshore, usually forming bands of sediments parallel to the shore.
Biogenous (biogenic) sediments are of biological origin, as a result of organism’s
calcareous, siliceous, or phosphate-rich skeletal debris. Being scattered across a wide range of marine environments, biogenic sediments are mainly derived from planktonic organisms, when perished, settle throughout the water column till the
bottom, accumulating into layers. Others are a product of large organism’s shells, coral reefs or plant-derived material, being the later mostly common in salt marshes and other coastal surroundings. Hydrogenous (authigenic) sediments are formed by the inorganic precipitation of seawater components as a consequence of chemical reactions favored by differences in geochemical and physical conditions, like the increase in pressure or temperature, proximity to hydrothermal vents, presence of chemical active substances, water properties, element saturation, oxidation state variation, among others. Because of authigenic slow accumulation rates they are more prompted to form within zones with little terrigenous and biogenic gathering, representing only a small portion of the total ocean sediments, although spread in various environments. Cosmogenous (cosmogenic) sediments, being of outer space origin are less abundant and the least significant part of ocean sediment. Resulting either from microscopic cosmic dust, pulled into Earth atmosphere or in less frequent cases from macroscopic meteor debris, most of which dissolves before reaching the ocean bottom. The composition of the sediment substrate is influenced by its location and respective environmental conditions; hence in deep sea sediments the
predominance is of carbonate oozes, covering a large part of the ocean floor
,
whilst in costal and intertidal settings it is common to find biogenic production flooded by terrestrial inputs.Despite its origin, sediments are mostly described according to their shape and size. Ranging from coarse gravels in areas exposed to considerable wave and current action, to mud characteristic from low-energy estuarine areas or fine silts and clays in deep-sea sediments (Gray & Elliott, 2009).Grain size is an important parameter both from a descriptive perspective and in relation to understanding sediment transport and deposition. For larger particles, measurements of three orthogonal axes are typically made and are used to calculate a
mean diameter. For smaller particles, grain size is typically determined by grading the samples through a set of sieves (see McManus 1988). A number of schemes have been devised to describe and measure grain size, but one of the most widely used is the Udden–Wentworth scheme (Fig. 1.4a).
Descriptions of sediment shape are somewhat more complex and may be taken to comprise elements of a particle’s form, roundness and texture. Roundness is usually described on the basis of comparisons with visual identification charts. Form is also usually quantified by describing grains in terms of one of four standard classes: oblate, equant, bladed or prolate, which reflect the relationship between the short, intermediate and long axes of grains (Fig. 1.4b). Other useful schemes combine elements of both roundness and sphericity in visual comparison charts (e.g. Powers 1982). Particle sorting describes the range of grain sizes that occur within a sedimentary deposit (Fig. 1.4c) and can be calculated by measuring the dispersion of grain size around the mean. This is again a useful parameter as it can be used, along with grain size data, to infer information about the environments of sediment deposition and the history of sediment reworking (e.g. McManus 1988).
A wide range of sediment environments is usually found within coastal lagoons, among which fauna and flora have been widely researched. Yet, there is still a lack of knowledge on the complex interactions between the microbiota and its environment, be it the fauna, the flora or the sediment compartment (Gamito, 2006; Mirto et al., 2004; Gomes & Mendonça-Hagler, 2004; Bertics & Ziebis, 2009; Pringault et al., 2009; Palínska et al., 2012).
Prokaryotes within coastal and shelf sediments play an important role in
global biogeochemical cycles, and are the ultimate sink of most terrestrially derived compounds and a high proportion of marine particle flux (Hewson et al., 2007).
Studying microbial diversity associated with different types of sediments, especially bacteriobenthic diversity, should enlighten the contribution of different sediment environments to ecosystem dynamics. Nevertheless, despite their high abundances and reports of high diversity (Hewson et al., 2003), little is known about characteristic association of bacterial populations to different sediments. In fact, the marine sediment microbiome has been object of several studies; nevertheless no studies about
bacteriobenthic diversity have been found for Ria Formosa coastal lagoon. Thus, the
present study aims to be a first contribution to understand how bacteriobenthic diversity correlates to sediment characteristics and origin.
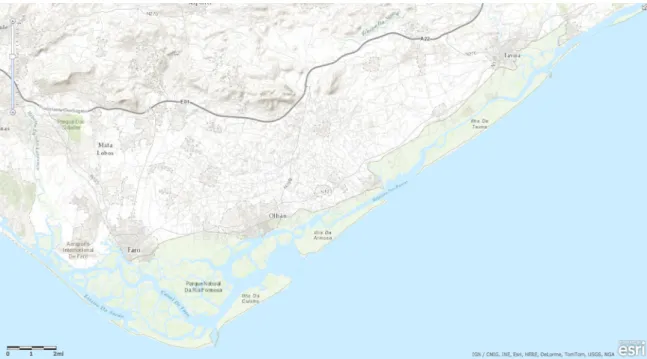
Ria Formosa
The Ria Formosa, (Figure 1) is a large shallow mesotidal coastal lagoon, with a multi-inlet barrier system, extending along approximately 55km of the eastern part of Portugal’s southern coast, being permanently connected to the sea through 6 narrow inlets, it has a high renewal rate, little freshwater or coarse sediment input, and therefore high values in salinity can be observed throughout the year. It is comprised of five barrier islands enclosed by two peninsulas, in the midst a system of sand flats and marshlands composed by tidal mud flats, salt marshes and partially dredged channels, of which only 14% are permanently flooded (Andrade et al., 2004).
Washed by a semi-diurnal tidal period, with an average tidal range of 2,8 meters in spring tides and 1,3 meters in neap tides, it can reach a maximum range of 3,7 meters. Wave dominance is on 68% of the time from W-SW and 29% from E-SE, with a medium period of 4,7s.
Figure 1- Ria Formosa coastal lagoon 36º56’N 8º02’W to 37º03’N 7º32’W (Source: Esri, DigitalGlobe, GeoEye, Earthstar Geographics, CNES/Airbus DS, USDA, USGS, AEX, Getmapping, Aerogrid, IGN, IGP, swisstopo, and the GIS User Community).
Sediment environments
Like most global systems, the Ria Formosa multi-barrier islands system, is actively migrating towards the mainland, probably as a response to the current rise in mean sea level (Ceia, 2009). Due to littoral drift and wave dynamics, the ocean inlets can occasionally be sealed off by sediment deposition. In the Ria Formosa coastal lagoon, the natural inlets are continuously migrating towards east, until they reach a limit position in which they begin to be silted (São Luís, Armona, Fuseta and Lacém inlets). This is concomitant to the opening new inlets around the initial site, obligating this dynamic to restart west, where it originally begun (Weinholtz in Ceia, 2009) or where some inlets were fixed by rocky groins (Barra Faro-Olhão and Tavira inlets).
The beaches along the barrier islands are typically narrow and their behavior varies between being reflective through the western end (Martins et al. in Ceia, 2009) and intermediate to dissipative at the eastern end (Matias et al. in Ceia, 2009).
Figure 2 - (In Environmental Sedimentology, Temperate coastal environments by Andrew Cooper, 2007).
It is a large multi-inlet barrier island system, including mainland,
back-barrier lagoons, inlet deltas, back-barrier islands, back-barriers platforms and shore-face
(Pilkey et al., 1989 in Gamito, 2006). Due to the intense morphodynamics regime, climate and tidal currents, the growth /erosion rates of the barrier islands are very intense, making the system very unstable and vulnerable, under continuous change (Dias, 1988 in Ceia, 2009).
The type of vegetation and hydrodynamics of the unit constrict the several sediment environments. Numerous levels of intertidal platforms can be distinguished in Ria Formosa system. The high marshes are well established and secured by the vegetation, receiving sandy inputs coming from wash-over fans. Mediterranean saltmarsh scrubs dominate this environment. Sediment outputs are derived mainly
from the dismantling of high marshes by micro-depressions and minor tidal channels. The upper-middle marsh is covered by stands of the shrub sea-purslane (Halimione
portulcaoides) and woody glasswort (Sarcocornia fruticosa), while the lower-middle
marsh supports either flat- leaved Spartina swards or creeping glasswort (Sarcocornia
perennis). Populations of glasswort (Sarcocornia perennis) and cord grass (Spartina maritima) colonize the lower levels (low marshes). With stronger dynamics, are the
watts and tidal channels found (Rodrigues et al., 2005).
The tidal channel, ebb-delta and saltmarsh constitute the main depositional sub-environments of the barrier platform (Arnaud-Fassetta et al., 2006). The high-energy hydraulic conditions favor the strong transport capacity of the channel, limiting the deposition of fine-grained sediments in the adjacent fringe marshes. Thus, Ria Formosa inlet dynamics continuously changes sediment deposits of exposed channels. In a neap tide slack water phase the first millimeters of the surface layer sampled, are newly deposited.
An ongoing study of the morphodynamics of the floods tidal deltas of S. Luís and Fuseta inlets in Ria Formosa, focusing on the mass transport of water, sediments and nutrients in coastal systems (Alves, 2013) defines the following sediment environment units: marshland environments, tidal channels, tidal flats and lagoon beaches.
Benthic Prokaryotes
The term benthos has its origin in the ancient Greek word βάθος (vathos), meaning depth. It refers to organisms living associated to the bottom of aquatic environments, be it oceans, lakes or rivers. In oceans, the benthic environment, or
benthal, extends from the shoreline (intertidal or eulittoral zone), descending along the surface of the continental shelf to the deepest oceanic trenches and submarine ridges, characterizing different ecosystems according to substrate composition and depth zonation. It ranges from organisms that live in and on sediments, those that inhabit rocky substrata, up to those residing on coral reefs, as well as on any other benthic organism (Steele, 2009). The composition, spatial distribution, and temporal variability of the benthos are profoundly affected by the nature of the substratum, being the result of a complex range of bio-physical-chemical interactions. In consequence, biological diversity may vary enormously between and within different types of sediments (Danovaro, 2010).
Sediments do not only represent shelter for benthic organism but are also feeding grounds for them, and due to the vast diversity of microbial populations (Kirk et al. 2004), the most complex and perplexing interactions can be uncovered. Distinctive types of macro- and microorganisms cohabit and interact in these complex and variable environments, where the role of plants within the substratum interactions should not be forgotten.
Marine sediments are extremely dynamic and interact continuous with the subjacent water column, being an important biological matrix, with high relevance in marine ecology. Organic matter deposition and degradation strongly influence sediment chemical composition. Prokaryotes take part in the oxidation, degradation and remineralisation of organic matter and consequent nutrient regenerations. They are capable of using the available organic matter in its dissolved form, which is essentially inaccessible to other heterotrophic groups. These organic compounds are incorporated into the bacterial biomass and reintroduced into food chains when bacterial cells serve as food for superior organism. Due to high quantities of DOM
(dissolved organic matter) and POM (particulate organic matter) in the estuaries water column and sediments, the bacterial processes have a primordial importance in these systems ecology. When these constituents are of high amount, the bacterial respiration causes oxygen depletion, resulting in hypoxic conditions, which may bring consequences into the ecosystem.
In general, in shallow coastal lagoons the water column does not present a lack of oxygen, due to its great interface with the atmosphere, and due to the high productivity from photosynthetic organisms. The turbulence triggered by the wind and high current dynamics increases the gas exchange and oxygen renewal, which is promoted by the overall shallow depth of the system. However, in sediments anaerobic conditions can be presented, as a result of the difficult renewal of interstitial water. On top sediments, organic matter is used by prokaryotes for respiration and biomass production (Danovaro et al. 2008), leading to oxygen depletion in subsurface layers. Prokaryotes are able to oxidize organic matter under these conditions, by processes of fermentation and sulfate reduction, from which many estuaries get the characteristic smell and color as a result of the production of sulfidric gas.
Diversity
The two taxonomic domains of Prokaryotes, Bacteria and Archaea, can be found in marine sediments, thus impairing the general use of the word bacteriobenthos. In fact, benthic prokaryotes include benthic archaea as well as benthic bacteria. In this context, the concept of bacteriobenthos has also included archaea, especially since they are undistinguishable under light microscopy or general
cultivation methods. Actually, Archaea have been treated as other bacteria, until the development of molecular techniques, which revealed significant genetic distance between Archaea and Bacteria. Bacteriobenthos studies such as Roh et al. 2010, which did not use molecular methods providing taxonomic information, have in fact included all Archaea cell counts and activities in their bacteriobenthos results.
The Bacteria domain is sub divided in phyla: Acidobacteria, Actinobacteria, Aquificae, Armatimonadetes, Bacteroidetes, Caldiserica, Chlamydiae, Chlorobi, Chloroflexi, Chrysiogenetes, Cyanobacteria, Deferribacteres, Deinococcus-Thermus, Dictyoglomi, Elusimicrobia, Fibrobacteres, Firmicutes, Fusobacteria, Gemmatimonadetes, Lentisphaerae, Nitrospinae, Nitrospirae, Planctomycetes, Proteobacteria, Spirochaetes, Synergistetes, Tenericutes, Thermodesulfobacteria, Thermomicrobia, Thermotogae, Verrucomicrobia. (Benson, 2008)
As for Archaea, which comprise phyla: Crenarchaeota, Euryarchaeota, Korarchaeota, Diapherotrites, Geoarchaeota, Nanoarchaeota, Nanohaloarchaeota, Parvarchaeota, Thaumarchaeota, as well as the not yet classified archaea groups (Klenk, 2010).
A wide scope of archaea are found in extreme environments, forming sub categories established by the type of environment in which they are found. Extremophylic archaea include thermophiles, halophiles, acidophiles and alkilinophiles.
Nevertheless Archaea are not constrained to extreme settings, as they are growingly recognized as rather abundant within sea plankton, and can also be found as part of many animals microbiota. Extremely important in sediments are methanogens, which bear a type of metabolism exclusive to a group of Archaea, that
are strictly anaerobic and chemolithotrophs, generating methane as an outcome of CO2 reduction.
As shown, in Table I, amongst the phyla included in the Bacteria domain the
Choloflexi and Gammaproteobacteria are common in sediments, while recognition of
Archaea in sediments only encompasses the phyla Crenarchaeota, Euryarchaeota (Schaechter, 2009).
Table I – Phyla encountered in sediment environments according to Bai (2012).
Bacteria in sediments Actinobacteria Acidobacteria Bacteroidetes Chloroflexi Firmicutes Planctomycetes Alphaproteobacteria Betaproteobacteria Deltaproteobacteria Epsilonproteobacteria Gammaproteobacteria Uncultured or unclassified Bacteria
To date, most studies examining prokaryote population’s diversity within sediments have focused upon functional groups of bacteria, on single locations or environment types, as well as on effects of biological and chemical factors upon microbial assemblage’s composition (Hewson et al., 2007). Microbes as
macroorganisms in an ecosystem are structured by temporal and spatial variability of physicochemical and biotic parameters (Hewson et al., 2007). It is well known that dense aggregations of bacteria colonize clean surfaces of hard or soft substrates fairly and promptly, through a succession that leads to a biofilm of adsorbed organic molecules and particles, thus being pioneers in the biofouling process (Thiyagarajan et al., 2010). In fact, each sediment particle provides clean surfaces for colonization and biofilm development, which might be limited by changing environmental factors such as abrasion, hydrodynamics, as well as nutrient and oxygen flow.
Functional groups and their sediment interactions
Diverse functional groups of prokaryotes are known to live in sediments, including aerobic heterotrophs, chemolithotrophs (like hydrogen oxidizing bacteria, sulfur-oxidizing bacteria, iron-oxidizing bacteria, nitrifying bacteria, methanogens and methanotrophs), fermentative bacteria (acetogens), anaerobic heterotrophs (nitrate-respiring bacteria, sulfur- and sulfate- reducing bacteria) and syntrophic bacteria (Zhang et al. in Thiyagarajan et al., 2010).
Surface sediment prokaryotes play an important role, due to their high abundance relatively to the overlying water column, they are a major component of microbial food webs, biogeochemical cycles and energy flow (Hewson et al., 2007). Even though the understanding of sediment habitats global biogeochemistry is increasing, much is to learn of the prokaryote populations that inhabit them or the factors that might influence their distribution (Hewson et al., 2007).
Bearing in mind that microbial distribution is strongly related to the sediment properties (Danovaro et al. 1999), combined with seasonal and environmental
changes, bacterial abundance may be a signal of variations in nutrient flux. The carbon cycle is perhaps the most affected by microorganisms (Rex et al. 2006), together with the known impacts on nitrogen phosphorus and sulfur cycles. Organic mater is decomposed, releasing several compounds of nitrogen, phosphate, sulfate and sulfite, and generating complex marine humus. (Parson et al.)
Bacteriobenthos study limitations
Like in most fields of microbiology, species identifications in sediments can be determined either with culture-dependent or culture independent methods. However, culture-dependent methods can be misrepresentative of environmental samples, since many species will not grow in vitro and low occurring species might be outrun by more abundant and opportunistic ones. Furthermore these techniques are usually time-consuming, since they rely on the isolation and culturing of microorganisms, followed by their identification which is based upon several characteristics. Whereas culture-independent methods rely on the direct analysis of nucleic acids, directly extracted from the sample, allowing the analysis of the whole diversity in fewer or even a single step, being therefore more reliable methods for analyzing complex microbial populations. Nevertheless some biases can arise, within each metadological step.
Difficulties in studying bacteriobenthos, as simple as limitations on how to enumerate the existing bacteria have hindered the use of this ecosystem compartment in ecosystem studies. The emergence of new molecular techniques has made the study of bacteriobenthos not only possible, but highly productive.
Nevertheless, in the extraction of DNA or RNA from whole environmental samples, the recovery yields can be low or insufficient, and even with high yields PCR (Polymerase Chain Reaction) amplification can loose sensibility with the presence of inhibitors, or by unequally targeting of all potential organisms, promoting the recovery of highly abundant species over others less occurring ones. Furthermore PCR might be affected by annealing competition of PCR products over primer availability; low hybridization rates due to divergent denaturation of templates; primer mismatch; and the formation of chimeric amplicons, by the re-annealing of templates, resulting in the misinterpretation of the actual microbial diversity.
Aside from all identification methods, limitations come to pass in the early stages of bacteriobenthos studies. The merely planning of sample collections is it self dependent on so many factors, that one may think twice before taking on this endeavor. Be it on deep-sea or highly dynamic coastal ecosystems sediment collections, a wide range of variables have to be considered.
In coastal ecosystems, bacterial diversity detection and their spatial-temporal variation in surface sediments are of great practical and scientific relevance. Despite their importance, our knowledge of the bacteria that inhabit surface sediments is very limited, especially in the heterogeneous marine ecosystems (Thiyagarajan et al., 2010). The type of habitat constricts the easiness of its study. When talking about a sediment environment subjected to tidal patterns, these patterns must be taken into account when sampling these environments as well as the climate, and environment characteristics.
In another front, after sample collections are done with, special attention has to be paid to the transport, storage and manipulation of samples, in order to prevent
post sampling microbial and sample properties modification, which can lead to its degradation and contamination.
Type of analysis and procedures
The estimation of bacterial abundances as well as their genetic diversity under
in situ conditions a fundamental objective of aquatic microbial ecology (Thiyagarajan et al., 2010). In the past, quantitative and qualitative analyses of microbial
communities have been hindered by the inability to cultivate most of the bacteria originally isolated from natural samples. In the mean time, molecular finger printing techniques, have provided new insights into our understanding of variation in bacterial diversity in natural samples, and their response to environmental heterogeneity. Thus these modern tools have provided a complement to culture-dependent techniques (Brito et al., 2009).
Bacterial diversity in aquatic habitats has been investigated using a number of approaches, which range in their sensitivity, including culture-based methods and sequencing of cloned randomly amplified 16S rDNA fragments (Hewson et al., 2003).
Over the past two decades molecular tools have been developed that allow the estimation of over 95% of bacterial taxa, based on fingerprinting techniques, such as 16S rDNA terminal restriction fragment length polymorphism (TRFLP) and automated rDNA intergenic spacer analysis (ARISA), allow the acquirement of whole-community estimates of bacterial diversity, with far greater results than culture
chain reaction-denaturing gradient gel electrophoresis (PCR-DGGE) has provided satisfactory results in the evaluation of microbial diversity of a variety of complex environments (Muyzer, 1999).
The direct extraction of nucleic acids (DNA or RNA) is the baseline for a large range of research protocols that have been made regular, in the major research areas. These procedures are currently made using commercial extraction kits that have evolved from the genetic material precipitation basis. Most commonly the step performed after isolating the genetic material, is the amplification of the extraction product, generally done through the use of PCR (Polymerase Chain Reaction), which enables the production of millions of copies of a specific DNA sequence in approximately two hours. This automated process bypasses the need to use bacteria for amplifying DNA, through cloning techniques.
In order to perform Denaturing Gradient Gel-Electrophoresis (DGGE), a sample of the previous extracted product is taken and amplified by an optimized NESTED-PCR protocol version (Lane, 1991; Huer & Smalla, 1997, in António, 2011) for bacterioplanktonic assemblages. The NESTED-PCR technique consists in using two pairs of PCR primers in a single locus. The first pair is a 16S gene universal bacterial primer, the second pair consisting in a more specific range will bind within the first PCR product and produce a second PCR product that will be shorter than the first one, thus diminishing the probability of wrong locus being amplified by mistake.
Denaturing Gradient Gel-Electrophoresis, introduced by Muyzer in 1993 for the study of the microbial community structure, is one of the most sensitive electrophoretic techniques. It is a molecular fingerprinting method that separates DNA products generated by polymerase chain reaction (PCR) (Ercolini, 2002).
Overcoming the limitation left by agarose gel electrophoresis results, in which products of similar size gather in a single DNA band that is largely non-descriptive, it allows to separate amplicons by sequence differences, according to the differential denaturing characteristics of the DNA amplicons, held together by guanidine and cytosine enriched clamps attached to one of the primers (Muyzer, 1999). While they migrate through the polyacrylamide gel, DNA fragments pass through increasing concentrations of chemical denaturants, as they begin to denature the migration will drastically slow down, as a result different denaturant concentrations will relate to unique patterns of bands, which theoretically represent a different DNA sequence (Wilson & Walker, 2005).
The separation of double-stranded DNA fragments identical in length, although different in sequence, is best accomplished by DGGE analyses. In the PCR DNA fragment products it seeks the difference in stability of G-C pairing (3 hydrogen bonds per pairing) as opposed to A-T pairing (2 hydrogen bonds). The acrylamide gel containing a gradient of increasing DNA denaturants is the base for this process. It allows double-stranded DNA fragments to migrate better, while denatured DNA molecules become effectively larger and slow down or stop in the gel. Thus DNA fragments richer in GC will be more stable and remain double-stranded until reaching higher denaturant concentrations. Sequence differing DNA fragments may be separated in an acrylamide gel (Wilson & Walker, 2005). The helpfulness of DGGE in the analysis of microbial populations rests on the fact that amplicons with different C-G proportions will migrate to different positions in DGGE gels, allowing to differentiate single nucleotide variation (Muyzer et al., 1993).
As DGGE, Temperature Gradient Gel Electrophoresis (TGGE) (Muyzer et al., 1993), allow the separation of DNA fragments of the same length but with different
base-pair sequences. Temporal Temperature Gradient Gel Electrophoresis (TTGE), was initially introduced by Yoshino et al. (1991), as a modification of TGGE, the temperature of a gel plate, with a constant concentration of denaturing chemicals, increases gradually and uniformly with time, which makes it easier to modulate the temperature over time. Based on the melting temperature (Tm) of the analyzed sequences a temperature ramp can be produced, allowing
The term “estimated spatial equivalent gradient resolution” (ESEGR) of TTGE was introduced in order to compare the temporal temperature-denaturing gradient directly with the spatial chemical denaturing gradient. To calculate the ESEGR for TTGE, the temporal temperature increase (ramping rate) was converted
into a hypothetical chemical denaturant increase by using a conversion factor of 0-3ºC temperature increase per 1% chemical denaturant (Abrams and Stanton 1992) and related to the amplicon migration rate in the gel; the amplicon migration rate was determined in a TTGE gel below denaturation conditions for the fragment. The TTGE analysis, performed according to Bùrresen-Dale et al. (1997), showed an ESEGR of
2-3% cm-1 chemical denaturant increase.
TGGE allows the removing of certain disadvantages of DGGE, like the necessary casting of a chemical gradient (Bùrresen-Dale et al. 1997),
TTGE separates PCR products into distinct bands, which in theory will represent different strains from a microbial population sampled, providing a genetic profiling over the diversity in situ (Hastings et al., 2006).
Furthermore, the bands in the gels can be excised and sequenced, allowing thus a phylogenic analysis of the microbial population present in a given environment.
Organic matter analysis
In sediments, organic matter can be found in the form of macro and micro molecules, originating from natural or anthropic sources, as a result of plankton, bacterial, plant and animal debris (Fabiano & Danovaro 1994, Fabiano et al. 1995, Danovaro et al.1999).
Bacteria quickly eat the less resistant molecules, such as the nucleic acids and many of the proteins. Sediment organic matter from plant and animal detritus, bacteria or plankton formed in situ, or derived from natural and anthropogenic sources in catchments. Sewage and effluent from food-processing plants, pulp and paper mills and fish-farms are examples of organic-rich wastes of human origin (Meyer-Reil 1994, Meyer-Reil & Köster 2000).
Total Organic Carbon (TOC) refers to the amount of organic matter preserved within sediment. Sediment nutrients are assessed as Total Nitrogen (TN) and Total Phosphorus (TP) concentrations, and have inorganic as well as organic sources. The amount of organic matter found in sediment is a function of the amount of various sources reaching the sediment surface and the rates at which different types of organic matter are degraded by microbial processes during burial (Deming & Baross, 1993).
Organic matter influences many of the physical, chemical and biological properties of soils. Some of the properties influenced by organic matter include soil structure, soil compressibility and shear strength. In addition, it also affects the water holding capacity, nutrient contributions, biological activity, and water and air infiltration rates (Meyer-Reil & Köster, 2000).
Statistical analysis
The combination of molecular and statistical methods can be very useful to differentiate microbial communities (Boon, 2002). The use of statistics provides a significant advantage for the non-ambiguous interpretation of the spatial and temporal functioning of microbial communities (Fromin, 2002).
Depending on the data and results obtained, the community structure and diversity of the bacterial groups from the different samples are to be further analyzed by adequate statistical strategies for analyzing the gel patterns, from single band examination to the analysis of whole fingerprinting profiles.
Procedures
Fieldwork
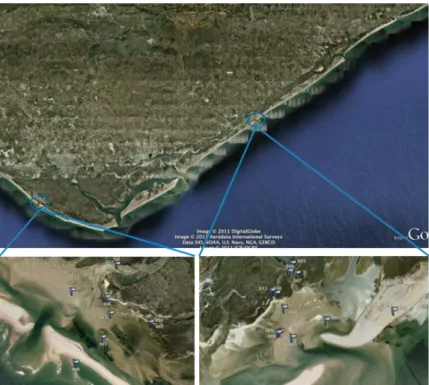
Two natural inlets of Ria Formosa Coastal Lagoon (Figures 3 and 4) were adopted for sampling, namely Barra de São Luís (BSL) and Fuzeta (FUZ).
Figure 3: Map of Ria Formosa coastal lagoon, indicating the two inlets from which boundaries samples were collected (modified from Falcão e Vale, 1990).
Figure 4: Satelite image of Ria Formosa, with a close-up view of the two inlets and the different sampling sites (Google Earth 2011).
S. Luís Inlet
A
B
C
D
E
F
G
H
I
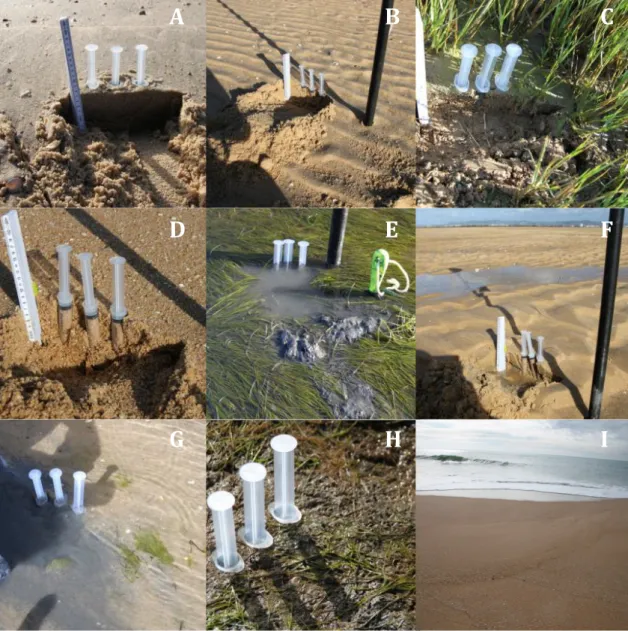
In each of these inlets, nine different sediment environments (Figure 5) were chosen to be sampled, namely Intertidal flooding dunes (A), intertidal sand flats (B), low marsh/Spartina maritina (C), internal dune shore face (D), Zostera nolti prairie (E), intertidal sand flats with ebb dunes (F), intertidal sand channel (G), intertidal mud flats (H) and external dune shore face (I).
Figure 5: Sampling environments: A-intertidal flooding dunes (DEDE); B-intertidal sand flats (PIRE); C-low marsh/Spartina maritina (BSSM); D-internal dune shore face (FPIN); E-Zostera nolti prairie (PZNO); F-intertidal sand flats with ebb dunes (PIDV); G-intertidal sand channel (CIAP); H-intertidal mud flats (PILO); I-external dune shore face (FPEX).
Sampling
Accounting for spatial and temporal variation, sampling strategy contemplated three sampling campaigns for BSL and two for FUZ, in Autumn and Winter 2010 and 2011, as detailed in table Table II.
Table II – Sampling schedule (Tidal info/seasonal distribution)
Environment
Coordinates Nov/10 Jan/11 Nov/11
BSL
1 DEDE DEDE DVDE
2 PIPA PIRE DVDP
3 BSSM BSSM BSSM
4 FPIN FPIN FPIN
5 PZNO PZNO PZNS
6 PIDV PIDE PIRV
7 MCIA MCIA MCIA
8 PILO PILO PILO
9 FPEX FPEX FPEX
FUZ 10 - FPEX - 11 - DEDE - 12 - PIDE MCMA 13 - PIRE PIRV 14 - PILO PILA 15 - MCIA PIMC 16 - BSSM BSSM 17 - PZNO PIPC 18 - FPIN PIPC 19 - CIAP PIDI 20 - - CIAP Tide 7h45 0.8 m - 7h42 0.8 m 8h25 0.7 m 6h41 1.0 m 7h15 0.9 m
At both inlets sampling was performed during ebb in spring tides, according to the schedule and tidal hights as presented in Table II.
The first trip made to BSL, in November 2010, was used to test collection procedures and for technical optimizations on experimental samples. A second trip was then made, as planed, in January, and sampling was done both in BSL and FUZ. The third trip was not possible till November 2011(Table II).
Two more sampling campaigns were made in order to collect samples for the construction of a reference molecular marker, used in the DGGE/TTGE for comparative analysis of DGGE patterns (Table III).
Table III – Molecular reference marker sampling campaingns.
Sampling site Environment B SL Jul/11 1A DE 2B PIA 3C FIDE B SL Jan/12 4D PIA 5E PZN 6F CIA T ide 10h04 0.8 m 10h48 0.7m
Sampling locations were reached by kayaking. Once arriving to the given spot, the georeferencial location was determined using DGPS (Differential GPS), seen in Figure 6-A, which was comprised by the Trimble 5800 RTK controler, the DGPS antena and a celphone to establish the conection with the Geographic Portuguese Institute (IGeo), according to the Datum 73 Hayford Gauss IPCC coordinates system.
Samples were taken with sterile seringes, previously cut with asseptic technique. Triplicate sediment cores were taken (Figure 6-B), for each point, and syringes were sealed with Parafilm®, stuck to the bottom side of the sediment core. At each site a fourth sediment sample was collected for further grain-size analysis (Figure 6-C). Sealed plastic bags provided the necessary containment for samples, that were immediately cooled in a thermal container. The samples were transported in a cooled thermic container to the laboratory, where they were immediately stored at -20ºC, till DNA extraction.
Figure 6: Sampling procedure: A– Sampling moment; B– Syringes; C– Sediment container. C B A
Laboratory procedures
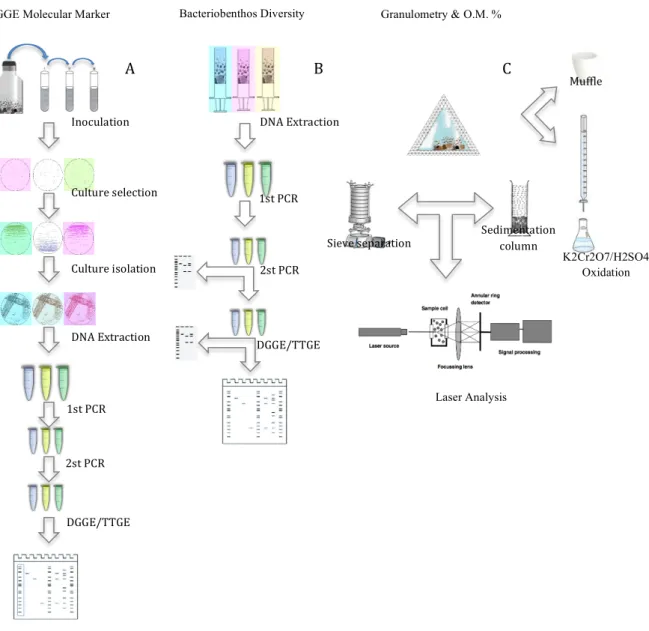
The samples collected were prepared, for all respectively laboratory analyses. Each point of triplicates (A, B, C) was used for molecular analysis, while the sediment sample (D), was divided into two parts: for organic matter percentage (%M.O.) determination, and granulometric analysis (Figure 7).
Figure 7: Procedures Schematics, with the several steps taken in each part of the laboratory analysis. A: DGGE molecular marker construction; B: Bacteriobenhos diversity analysis; C: Granulometric and organic matter analysis (Schematic diagram of a laser diffraction instrument based on the Malvern Instruments apparatus - Methods for the study of Marine Benthos, 2005).
Bacteriobenthos Diversity
DGGE Molecular Marker Granulometry & O.M. %
A B C Inoculation DNA Extraction 1st PCR 2st PCR DGGE/TTGE Culture selection Culture isolation DNA Extraction 1st PCR 2st PCR DGGE/TTGE Sieve separation Sedimentation column Muffle K2Cr2O7/H2SO4 Oxidation Laser Analysis
Geological analysis
Granulometric analysis is the assessment of particulates dimensions for a given sediment sample, conjugated by its corresponding statistical analysis.
Several methods for grain size analysis can be chosen, depending on the type of sample being studied. Most detrital sediment samples present mixed grain sizes, and therefore require the conjugation of several techniques for evaluating the full range sizes existing.
For evaluating grain size distribution, a part of the fourth sediment sample, for each site, was used. Being primarily separated into 3 groups: Fine, Coarse and Mixed sediments.
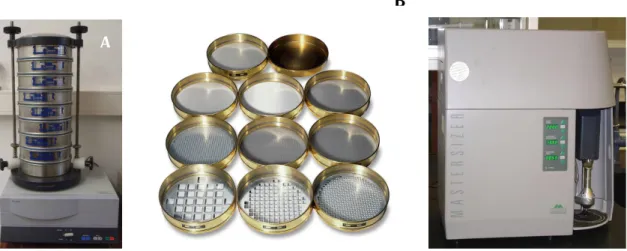
Figure 8: Granolumetric analysis equipment. A-Automatic sieving column; B-Sieves; C-Malvern Mastersizer.
Fine Sediments: Laser diffraction particle sizing
Fine sediments, were laser analyzed in a “Malvern Mastersizer” 2000 laser sizer (Herrenberg, Germany). A sub-sample of each sand/silt samples was diluted with water and dispersant, to allow the separation of all grains. These results allowed the
A
Laser diffraction was used for particle sizing; this technique was developed over the past decades by several manufacters, being based on the measurement by low angle light scattering (LALS), generated by a laser beam passing through a suspended particle sample (Eleftheriou & McIntyre, 2005). Because the suspension of heavy sand or coarse samples is very difficult to obtain, the samples chosen for this technique were mainly composed of silt and clay, with some low amounts of sand in between, to avoid bias in the distribution. When required a pre-screening with a 63µm sieve was preformed, in which the larger particles were then sieved and separated according to the meshes sizes.
For the measurement of the samples a previous background measurement had to be taken to differentiate the total light scaterring generated by the sediment sample from the one from the one caused by the surrounding environment.
Measured values were exported into an Excel spreadsheet, and later on treated with Gradistat 8.0, by Simon Blott (2010).
Coarse Sediments
Coarse sediments were completely dried at 40-50ºC, weighted and afterwards separated by automatic sieving (Figure 7-A). The series of sieves selected had meshes of 4,00mm, 2,80mm, 1,40mm, 1,00mm, 0,710mm, 0,50mm, 0,350mm, 0,250mm, 0,180mm, 0,125mm, 0,090mm and 0,063mm. Sieves were put together in a stack, with increasing mesh size, on the collecting pan; the weighted sample was laid on the uppermost sieve (biggest mesh size); the complete sieve stack filled with the sample material was placed on the sieve shaker and fasten, finally the timer was set for a period of 10-15 minutes with an amplitude of 40 ppm (per minute/per million). After
sieving, each remaining fraction of sediment, on each sieve and collecting pan, was weighted and the values were analyzed on a Microsoft Excel macro “Gradistat” (Blott & Pye, 2001), from which various textural parameters were obtained (Folk & Ward, 1957), through the logarithm method of Blott, 2001.
Mixed Sediments
Mixed sediments were dried together with coarse samples and sieved in the same way, howeverthe fractions smaller than 0,063mm were submitted to a sedimentation test, the pipette method. In this, remaining samples wereplaced into a 1L water column, mixed with a dispersant (sodium hexametaphosphate or Calgon®), and stirred vigorously for 10 min to disperse all material. The column was put to rest to evaluate if no flocculation occurred, given so the column was mixed from the base up, until all particulates were scattered uniformly within the cylinder, ending with prolonged and even stroke vertically from the bottom of the column to the water surface (Folk, 1974).
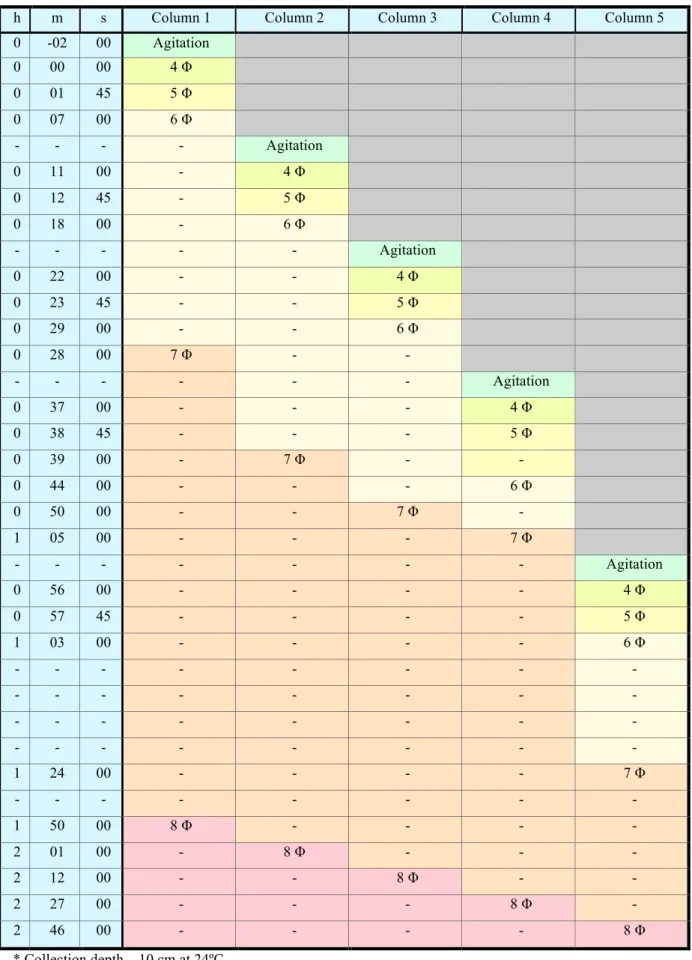
A procedure data sheet by Dias (2004) was followed (Table IV); in which pre-determined intervals for each withdraw were schedule, hence each extract was made at the depth of 10 cm at 24ºC, by inserting a pipette and taking 20 ml of solution to a weighted petri dish. The pipette was then rinsed into the same petri dish, with distilled water to recover all sediment residues. This procedure was followed for each withdraw without remixing the columns, after which the petri dishes were placed at 40-50ºC, to evaporate all water, and thus weighted to at room temperature to determine the proportion of sediments residue remaining suspended at each given time.
Table IV –Withdraw intervals data sheet, for fine sediments granulometry depth test, in a 5-column essay (adapted from Dias, 2004).
* Collection depth – 10 cm at 24ºC.
h m s Column 1 Column 2 Column 3 Column 4 Column 5
0 -02 00 Agitation 0 00 00 4 Φ 0 01 45 5 Φ 0 07 00 6 Φ - - - - Agitation 0 11 00 - 4 Φ 0 12 45 - 5 Φ 0 18 00 - 6 Φ - - - Agitation 0 22 00 - - 4 Φ 0 23 45 - - 5 Φ 0 29 00 - - 6 Φ 0 28 00 7 Φ - - - - - Agitation 0 37 00 - - - 4 Φ 0 38 45 - - - 5 Φ 0 39 00 - 7 Φ - - 0 44 00 - - - 6 Φ 0 50 00 - - 7 Φ - 1 05 00 - - - 7 Φ - - - Agitation 0 56 00 - - - - 4 Φ 0 57 45 - - - - 5 Φ 1 03 00 - - - - 6 Φ - - - - - - - - - - - - - - - - 1 24 00 - - - - 7 Φ - - - - 1 50 00 8 Φ - - - - 2 01 00 - 8 Φ - - - 2 12 00 - - 8 Φ - - 2 27 00 - - - 8 Φ - 2 46 00 - - - - 8 Φ
Gradistat
Granulometric data was input Gradistat 8.0 (December 2010 version), from which statistical results were obtained, through the method of Folk, 1957. This methods allowed the determination of certain granulometric parameters as the Aritmetric and Geometric Mean, Calibration, Assimetric quoeficient, curtose quoeficient, textural group, amoung others (Annex I – Gradistat data, Blott 2001).
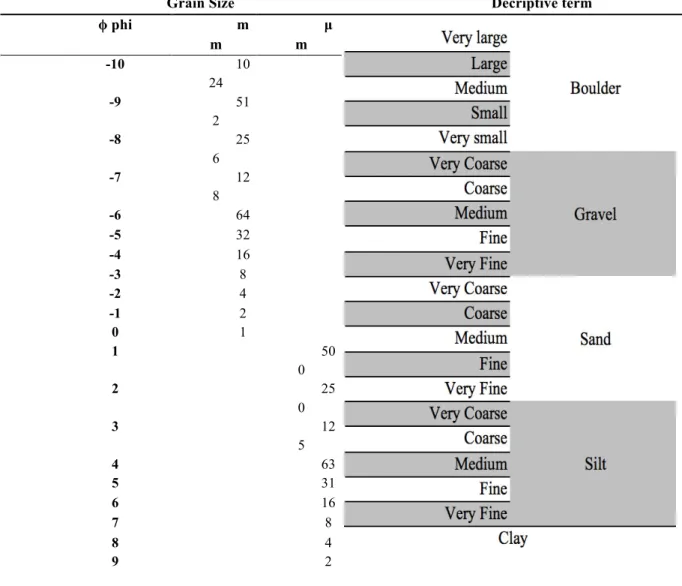
Results were treated according to the Udden/Wentworth scale (Table V) and ploted into Folk diagrams, by their textural composition fractions.
Table V: Modified grain-size scale from Udden (1914) & Wentworth (1922) for siliciclastic sediment, adopted by Gradistat.
Grain Size Decriptive term
ϕ phi m m µ m -10 10 24 -9 51 2 -8 25 6 -7 12 8 -6 64 -5 32 -4 16 -3 8 -2 4 -1 2 0 1 1 50 0 2 25 0 3 12 5 4 63 5 31 6 16 7 8 8 4 9 2
Organic Matter Determination
After granulometric analysis, the rest of the fourth sediment sample was used for determining organic matter percentage (OM %) in each case, by the use of two different techniques, K2Cr2O7/H2SO4 Oxidation and muffle furnace methods Procedures were followed according to Annex II – Guerrero & Portela Determinação
de Matéria Orgânica – Laboratório de Solos e Resíduos (Plataforma do Golfe).
Pearson’s coefficient of correlation was made between components of the organic matter of surface sediments and granulometric variables.
DNA extraction from sediments
For the extraction of total bacterial DNA, the sediment samples replicates were unfrozen 12h prior to the procedure, on a vertical position to drain off interstitial water. To avoid contamination, samples were prepared in a laminar flux chamber, using sterile bistoury, spatula and small petri plates, the top layer of the sediment sample was taken from the syringe, by inverting the plunger and pressing out the sediment. After scraping the surface, 2.0 - 5.0 mm of top layer sediment was cut and weighted, about 0.5 - 1g of collected sample was used for extraction, whereas the rest was reweighed and stored at -20OC.
The extraction was made using MoBio Laboratories, Inc. UltraClean® Soil DNA Isolation Kit (figure 10), with the Alternative protocol - for maximum yields. The cell disruption (step 6 of protocol) was preformed in the Bertin Technologies PRECELLYS®24 tissue homogenizer/grinder automated equipment. A program of two cycles of 30 seconds at 6700rpm was chosen. The remaining steps (Figure 10)
were performed according to the original procedure (Annex III – MoBio Aternative
protocol (Maximum yields)). The amount of DNA in the extracted samples was
measured using a Thermo Scientific NanoDrop™ 1000 Spectrophotometer. The extraction products were stored at -20OC till subsequent PCR amplification.
Figure 10: DNA extraction schematics (adapted from MoBio UltraClean® Soil DNA Isolation Kit protocol).
Quantitative analysis of nucleic acids
Quantitative analysis using the NanoDrop® ND-1000 device, was performed according to the manufacturers manual, by pipetting 1.0 µl of the nucleic acid solution to the measurement pedestal. Concentrations were measured with UV-Vis at λ = 260 nm. Additionally, ratios of 260/230 nm and 280/260 nm were evaluated, to assess the purity of the sample.
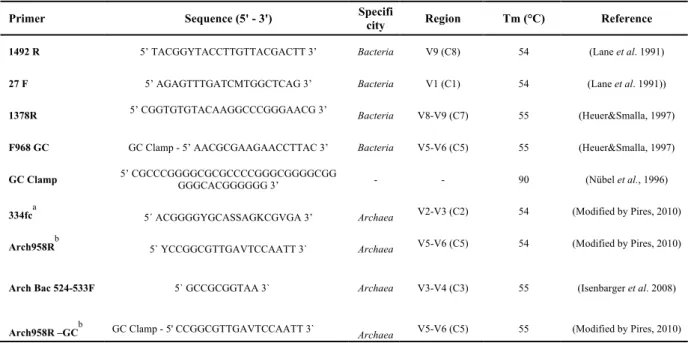
Primers
Table VI – Primers used in bacteriobenthos molecular identification.
Primer Sequence (5' - 3') Specifi
city Region Tm (°C) Reference
1492 R 5’ TACGGYTACCTTGTTACGACTT 3’ Bacteria V9 (C8) 54 (Lane et al. 1991)
27 F 5’ AGAGTTTGATCMTGGCTCAG 3’ Bacteria V1 (C1) 54 (Lane et al. 1991))
1378R 5’ CGGTGTGTACAAGGCCCGGGAACG 3’ Bacteria V8-V9 (C7) 55 (Heuer&Smalla, 1997)
F968 GC GC Clamp - 5’ AACGCGAAGAACCTTAC 3’ Bacteria V5-V6 (C5) 55 (Heuer&Smalla, 1997)
GC Clamp 5’ CGCCCGGGGCGCGCCCCGGGCGGGGCGG GGGCACGGGGGG 3’ - - 90 (Nübel et al., 1996)
334fca 5´ ACGGGGYGCASSAGKCGVGA 3’ Archaea V2-V3 (C2) 54 (Modified by Pires, 2010)
Arch958Rb 5` YCCGGCGTTGAVTCCAATT 3` Archaea V5-V6 (C5) 54 (Modified by Pires, 2010)
Arch Bac 524-533F 5` GCCGCGGTAA 3` Archaea V3-V4 (C3) 55 (Isenbarger et al. 2008)
Arch958R –GCb GC Clamp - 5' CCGGCGTTGAVTCCAATT 3` Archaea V5-V6 (C5) 55 (Modified by Pires, 2010)
a
Modified from ARC344f Bano et al. 2004. b
Modified from ARCH958R DeLong, 1992.
The adopted amplification procedure was a Nested-PCR technique. The first primer pair was a 16S gene universal bacterial primer, 27F (Table VI) and 1492R, producing a fragment with around 1400 bp of the rDNA 16S gene. The second pair targeted to a more specific range, F968 and 1378R that binds within the first PCR product and produce a second shorter PCR product of about 400bp, matching the
variable region V6-V8. This procedure diminishes the probability of the wrong locus being amplified. The forward primer for the second amplification was adapted for DGGE use, by adding a GC clamp introduced by Nübel et al. (1996).
PCR Amplification protocols
The Nested-PCR amplification was based on an optimized NESTED-PCR protocol version (Lane, 1991; Huer&Smalla, 1997, in António, 2011) for bacterioplanktonic assemblages. All the primers used in this study are described in Table VI.
After several optimizations, the 1st PCR reaction mixtures (Table VII) were composed by 10 pmol of each primer (27F and 1492R), 200 µM of dNTPs, 1 x PCR buffer (InvitrogenTM), 3.75 mM MgCl2, 1 U Platinum®Taq DNA Polymerase (InvitrogenTM), and 1% DMSO, combined with H2O (Sigma-Aldrich, Inc.) to 25µl in a 0.2 ml microfuge tube. After addition of 10 ng of template DNA, the mixtures were incubated in a VWR Collection DOPPIO® thermal cycler (Gene Technologies, Ltd.) programmed (Table VIII) with initial denaturation of double-stranded DNA for 5 min at 94OC; folllowed by 30 cycles consisting of 30 sec at 95OC, 30 sec at 55OC, and 30 sec at 72OC and extension for 5 min at 72OC.
The 2nd PCR reaction mixtures were composed by 10 pmol of each primer (1378R and F968 GC), 200 µM of dNTPs, 1 x PCR buffer (InvitrogenTM), 3.75 mM MgCl2, 1 U Platinum®Taq DNA Polymerase (InvitrogenTM), and 1% Acetamide adjusted with H2O (Sigma-Aldrich, Inc.) to 25µl in a 0.2 ml microfuge tube. After addition of DNA template diluted 1:5 from the 1st amplification products, the mixtures were incubated with initial denaturation of double-stranded DNA for 5 min at 94OC;
following 30 cycles of 30 sec at 95OC, 30 sec at 55OC, and 30 sec at 72OC and extension for 5 min at 72OC.
Table VII – PCR recipes
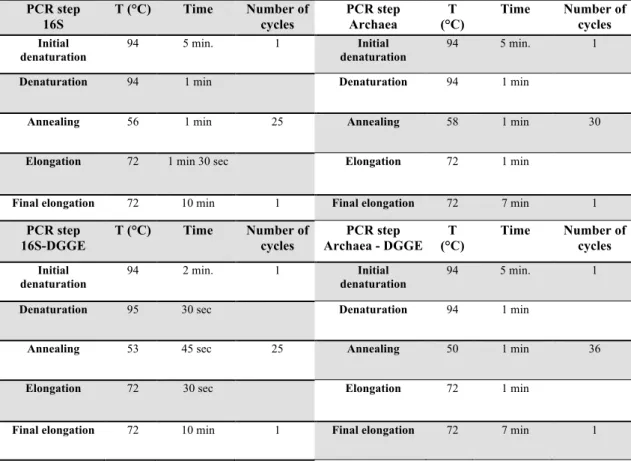
Table VIII – PCR Protocol
PCR step 16S T (°C) Time Number of cycles PCR step Archaea T (°C) Time Number of cycles Initial denaturation 94 5 min. 1 Initial denaturation 94 5 min. 1
Denaturation 94 1 min Denaturation 94 1 min
Annealing 56 1 min 25 Annealing 58 1 min 30
Elongation 72 1 min 30 sec Elongation 72 1 min
Final elongation 72 10 min 1 Final elongation 72 7 min 1
PCR step 16S-DGGE T (°C) Time Number of cycles PCR step Archaea - DGGE T (°C) Time Number of cycles Initial denaturation 94 2 min. 1 Initial denaturation 94 5 min. 1
Denaturation 95 30 sec Denaturation 94 1 min
Annealing 53 45 sec 25 Annealing 50 1 min 36
Elongation 72 30 sec Elongation 72 1 min
Final elongation 72 10 min 1 Final elongation 72 7 min 1 Primer Set 16S 16S – DGGE Primer Set Arch Arch - DGGE BufferGoTaq 1X 1X BufferGoTaq 1X 1X
MgCl2 3,75 mM 3,75 mM MgCl2 2,75 mM 2,5mM
DMSO/Acetamida 2% 4% Formamida/Acetamida 1% 2% dNTP’s Mix 0,2 mM 0,2 mM dNTP’s Mix 2,5mM 2,5mM PrimerFoward 0,2 µM 0,2 µM PrimerFoward 0,1 µM 0,1 µM Primer Reverse 0,2 µM 0,2 µM Primer Reverse 0,1 µM 0,1 µM GoTaq polymerase 0,625 U 0,625 U GoTaq polymerase 0,5 U 0,5 U DNA template 2-10 ng 2-10 ng DNA template 2-10 ng 2-10 ng
Electrophoresis
To confirm the success of the PCR, both steps of amplification were analyzed by electrophoresis on a 1% (m/v) agarose gel (SeaKem® LE Agarose - Lonza Rockland, Inc.) in 1X Tris–acetate–EDTA (TAE), using the ready-to-use ZipRullerTMExpress DNA Ladder Set (Fermentas, Life Sciences), broad range from 100bp to 20000bp (Annex IV - Zip Ruler Fermentas), allowing the comparison in size an intensity of the bands obtained. Gels wer precasted with GelStarTM Nucleic Acid Gel Staining (Lonza Rockland, Inc.) or GreenSafe Premium (NzyTech, Lda.) or post-stained, after electrophoresis, in GelRed® Nucleic Acid Gel Stain (Biotium, Inc.) for 30 min and washed in TAE before being viewed and photographed under ultraviolet (UV) illumination (312 nm).
Purification
Some amplification products were purified, for better screening, using the NZYTech NZYGelpure® purification kit (Annex V – nzytech for PCR clean up protocol).
DGGE and TTGE of 16S rDNA amplicons
DGGE and TTGE were performed using the Temporal Temperature Gel Electrophoresis – TTGE-2401/240v Model (C.B.S. Scientific, Company Inc.). The apparatus was prepared according to the instructions (Annex VI– Intructions for