ORIGINAL RESEARCH PAPER
ASPECTS REGARDING THE PROFILE OF INTESTINAL MICROBIOTA ON WILD POPULATIONS OF STERLET
(ACIPENSER RUTHENUS, LINNAEUS, 1758)
MANUELA GIANINA BĂCANU1*, LUCIAN OPREA1, GEORGIANA CĂLIN SANDU1, RODICA DINICĂ1, MARILENA MĂEREANU 2, DUMITRU MĂEREANU 2,
CONSTANŢA ŞERBAN3
1„Dunărea de Jos” University of Galaţi, Faculty of Food Science and Engineering, 111 Domneasca Street, 800201, Galati, Romania,
2
Kaviar House Bucuresti Filiala Tulcea, 89 bis Campia Libertatii Street, , Isaccea, Romania, 3ITCSMS Brăila, 344 Calea Galaţi, Romania
*
Corresponding author: [email protected]
Received on 18th September 2012 Revised on 12 th October 2012
The aim of the present research was to examinate the profile of intestinal microbiota of sterlet from the Danube River. Genomic DNA was extracted from each gut fish and polymerase chain reaction (PCR) was used to amplify the conserved 16S ribosomal RNA gene. Using Denaturing Gradient Gel Electrophoresis (DGGE) of PCR amplified 16S rDNA to characterise the variability of bacterial populations, the results showed different microbial profiles for 50% of fish. These results demonstrate the potential of PCR-DGGE-based analysis for identification of gut microbiota and could contribute to a better understanding of fish ecology.
Keywords: bacterial community, sterlet, PCR, DGGE
Introduction
Denaturing Gradient Gel Electrophoresis (DGGE) is a new approach in microbial ecology; it is based on the analysis of bacterial genetic information without cultivation of the microorganisms. This molecular technique separates double-stranded DNA fragments of identical length according to the melting property of each unique DNA fragment. DGGE can be used for the analysis of PCR-amplified 16S rDNA sequences obtained from community DNA extractions. The resulting diversity patterns can be analysed and compared. The major advantage of this technique is that it allows the direct determination of bacterial genetic diversity (Rombaut et al., 2001). Also, PCR-DGGE has the advantage of not requiring previous knowledge on microbial populations (Muyzer, 1998).
of intestinal bacteria in the nutrition and well-being of the host has been established for several animals and was recently demonstrated also for fish. It is known that the microbiota of fish contribute to important key functions, such as development, immunity and xenobic metabolism (Bates et al., 2006; Navarrete et al., 2012). The intestinal microbiota of fish is comparatively less dense and diverse than humans and other endotherms (Trust et al., 1974). The gastrointestinal tract of many fish species is made up of stomach, pyloric caeca and intestine. Thus, it may be expected that the bacterial microbiota along the gastrointestinal tract would be different, showing regional specialization (Sun et al., 2011). It was demonstrated that herbivore microbiotas contained the most phyla (14), carnivores contained the fewest (6), and omnivores were intermediate (12) (Ley et al., 2008).
The aim of our research is to characterise the bacterial profile of fish gut, using molecular techniques. As fish model, we chose the sterlet (Acipenser ruthenus) because of its importance for Romanian fishing and aquaculture sector.
Material and Methods
Fish sampling
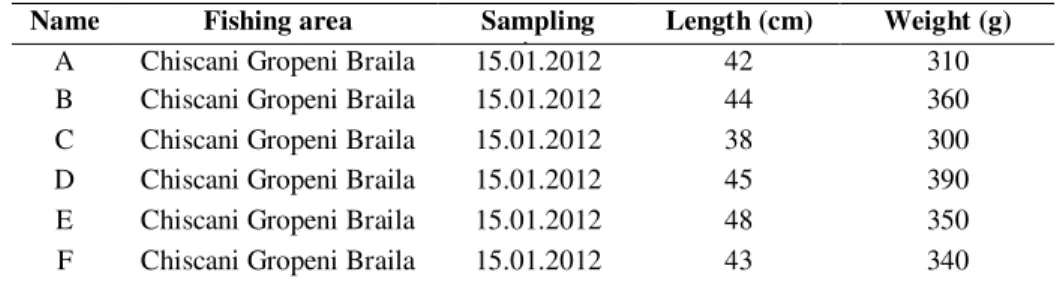
Microbial communities were studied on 6 fish (A-F) from the Danube River. The fish have been caught out of area Chiscani-Gropeni, Braila county. Immediately after the catch, all fish were measured and it was weighed, observed that fish A, C, F were lighter than fish B, D, E (Table 1).
Table 1. Length and weight of fish samples
Name Fishing area Sampling
time
Length (cm) Weight (g)
A Chiscani Gropeni Braila 15.01.2012 42 310
B Chiscani Gropeni Braila 15.01.2012 44 360
C Chiscani Gropeni Braila 15.01.2012 38 300
D Chiscani Gropeni Braila 15.01.2012 45 390
E Chiscani Gropeni Braila 15.01.2012 48 350
F Chiscani Gropeni Braila 15.01.2012 43 340
The skin was disinfected with alcohol (70%) before opening the fish and removing the gastrointestinal tract out of the fish using sterile instruments. The whole gut of each fish was kept on ice in sterile individual Petri dishes, during the transportation to the laboratory. Upon arrival at the laboratory, gut contents were separately collected in sterile Eppendorf tubes under a laminar flow. The samples were frozen at -800C until analysis.
DNA extraction
extracted from a microbial population can be used to identify the genetic diversity of the dominant populations by PCR and DGGE (Muyzer et al., 1993).
PCR reaction
To avoid unspecific amplifications, the 16S rRNA gene fragments were amplified by a semi-nested PCR. There were used conserved 16S rDNA bacterial domain specific primers 27f (GTTTGATCCTGGCTCAG) and 1369r (GCCCGGGAACGTATTCACCG) for the first PCR, 968gc (CGCCCGGGGCGCGCCCCGGGCGGGGCGGGGGCACGGGGAACGCGAAG AACTC) and 1369r (GCCCGGGAACGTATTCACCG) for the second PCR. The PCRs were performed as follows: sample DNA was denatured at 98°C for 1 min and amplified by 20 cycles of 98°C of the first PCR containing the template, 1x Reaction Buffer, 200µ M of dNTPs and 1 µ l of Phire Hot Start II DNA polymerase (Finnzymes). The second PCR was performed using 1 µl of the first PCR product in a 50 µ l reaction mixture containing the same reagents as the first PCR. The conditions of the second PCR were identical to the first reaction. The final PCR product was analysed on a 1% agarose gel and visualized by UV illumination after SYBRSafe (Invitrogen) staining. All PCR products were analyzed by 1% agarose gel electrophoresis for 30 minutes at 100V.
DGGE gels
Denaturing gradient gel electrophoresis (DGGE) of PCR-amplified V6-V8 regions of the bacterial 16S rRNA gene was used to obtain a molecular fingerprint of the microbial communities in all different types of samples. Electrophoresis and staining of the gels were performed as reported previously. Briefly, assays were performed in a BioRad© DCODE Universal Mutation Detection System™. Analysis of the amplicons was performed on 8% polyacrylamide gels containing a urea-formamide gradient from 30% to 60% (a 100% urea-formamide solution consists of 7 M urea and 40% [vol/vol]) formamide). PCR samples were applied to gels in aliquots of 10 µl per lane. Electrophoresis was performed in 0.5% Tris-acetate-EDTA buffer (pH 8.0) at 60°C and 85 V for 16 h. The gels were silver stained and air dried, after which it was examined. The gel was scanned at 400 dpi.
Results and discussion
Several authors have used molecular methods in the study of fish intestine (Ringø
et al., 2000, Ringø et al., 2006, Holben et al., 2002, Kim et al., 2007). Microbial
diversity plays a critical role in the functioning of gastrointestinal systems (Nakay, 2019). Gel electrophoresis fingerprints is a useful tool for comparing complex microbial community profiles from different environmental samples (Merrifield et al, 2009; Dilly et al, 2004). DGGE is undeniably a valuable approach in screening complex ecosystems on a large scale and in analyzing various environmental samples in a reduced amount of time (Diarrassouba, 2011)
Denaturing gradient gel electrophoresis analysis showed the microbial communities presented in all gut samples (Figure 2).
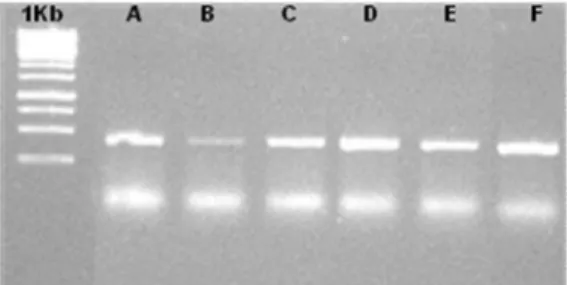
Figure 1. PCR products for all samples. The letters (A-F) indicate biological replicates
Figure 2-Denaturing gradient gel electrophoresis profiles. The letters A-F indicate the
amplicons of 16S rDNA from the six fish that were analysed. The arrow indicates the position of bands present in all samples. M-marker
Figure 3. UPGMA dendogram showing similarity of DGGE profiles of microbial
communities in all gut samples of the study. Dendogram was determined by calculating similarity indices of the densiometric curves of the profiles compared by using the Pearson
product-moment correlation. The total similarity was 57, 29%. The letters (A-F) indicate biological replicates
10 and 11 are common for all samples. The bands number 5,6,7,8 are present only in fish A and the bands number 3,4,13 are present in fish C. The UPGMA (Unweighted Pair Group Method with Arithmetic Mean) dendogram, determined by calculating similarity indices of the densiometric curves of the profiles compared by using the Pearson product-moment correlation, clearly shows that samples tend to cluster per weight, respectively the small fish B, D, E are closer and the big fish F, C and A are grouping apart (Figure 3). The presence or absence of bands are correlated with fish weight. The results indicate that 50% of fish had own personal and unique microbial profile, respectively fish A, C, F and the other 50% had almost identical microbial profile, respectively fish B, D, E. In our case the gut microbiota changed over time (for small fish) and tends to be stable (for big fish). Also, Ring (2003) and Gomez (2008) demonstrated that gut microbiota often varies with age, weight.
The sterlets main source of food is benthic organisms; they commonly feed on crustaceans, worms, and insect larvae. Frequently they eat fish eggs and fish larvae, also. This means that sterlet is almost a carnivore fish. However, it is difficult to compare all the available results from different researches. There are a lot factors that influence the profile of microbiota: sampling from different parts of the gut, different fish species, sampling location, type of feed, research methods, etc.
Conlusions
The application of molecular tools to intestinal microbiology has greatly facilitated the study of the complex microbial community in the fish gut. A not very complex profile was observed in the gut of fish. DGGE analysis of the bacterial DNA, isolated from gut, indicated that the bacterial profile is different between specimens but also they have some common bacterial populations. According to the bacterial profile determinated, sterlet seems to be closer to the carnivore fish species. These results can contribute to a better understanding of fish ecology.
Acknowledgements
These researches were conducted in the framework of the project POSDRU-89/1.5/S/52432 “Organizing the national interest postdoctoral school of applied biotechnologies with impact on Romanian bioeconomy”, and POSDRU– 107/1.5/S/76822 “Quality and continuity of training in doctoral studies”, projects co-financed by the European Social Fund through the Sectoral Operational Programme Human Resources Development 2007-2013.
References
Bates, J.M., Mittege, E., Kuhlman, J., Baden, K.N., Cheesman, S.E. 2006. Distinct signals from the microbiota promote different aspects of zebrafish gut differentiation. Dev
elopmental Biology, 297, 374-386.
Blaut, M., Collins, M.D., Welling,W., Dore, J. van Loo, J., de Vos W. 2002. Molecular biological methods for studying the gut microbiota: the EU human gut flora project;
Brithish Journal of Nutrition, 2, S203-S211.
rainbow trout (Oncoryhnchus mykiss Walbaum). Aquaculture Research, 40, 1064-1072.
Denev, S., Staykov, Y., Moutafchieva, R., Beev, G. 2009. Microbial ecology of the gastrointestinal tract of fish and the potential application of probiotics and prebiotics in finfish aquaculture. Aquaculture Resarch, 1, 1-29.
Diarrassouba, F. 2011. Denaturating Gradient Gel Electrophoresis (DGGE): An Overview The Science Creative Quarterly.
Dilly, O., Bloem, J., Vos A., Munch, J.C. 2004. Bacterial diversity in agricultural soil during litter decomposition. Aplied and Enviromental Microbiology, 70, 468-474. Gerard, M., Smalla, K. 1998. Application of denaturing gradient gel electrophoresis
(DGGE) and temperature gradient gel electrophoresis (TGGE) in microbial ecology.
Antonie van Leeuwenhoek, 73, 127-141.
Gomez, G.D., Balcazar, J.L. 2008. A review on the interactions between gut microbiota and innate immunity of fish. FEMS Immunology and Medical Microbiology, 52, 145-154. Holben, W.E., Williams, P.,. Gilbert, M.A, Saarinen, M., Sarkilahti, L.K., Apajalahti, J.H.
2002. Phylogenetic analysis of intestinal microflora indicates a novel Mycoplasma phylotype in farmed and wild salmon, Microbial Ecology, 44, 175–185.
Kim, D.H., Brunt, J., Austin, B. 2007. Microbial diversity of intestinal contents and mucus in rainbow trout (Oncorhynchus mykiss), Journal Applied Microbiology, 102, 1654– 1664.
Muyzer, G., de Waal, E.C., Uitterlinden, A.G. 1993 Profiling of complex microbial populations by denaturing gradient gel electrophoresis analysis of polymerase chain reaction-amplified genes coding for 16S rRNA, Applied Environmental Microbiology,
59, 695-700
Navarrete, P., Magne, F., Araneda, C., Fuentes, P., Barros, L., Opazo, R., Espejo, R., Romero, J. 2012. PCR-TTGE Analysis of 16S rRNA of Rainbow Trout (Oncorhynchus mykiss) gut microbiota reveals host specific communities of active bacteria. Plos One,
7, 2.
Nayak, S.K. 2010. Role of gastrointestinal microbiota in fish. Aquaculture Research, 41, 1553–1573.
Ringø, E., Bendiksen, H.R., Wesmajervi, M.S., Olsen, R.E., Jansen, P.A., Mikkelsen H. 2000. Lactic acid bacteria associated with the digestive tract of Atlantic salmon (Salmo salar L.), Journal Applied Microbiology, 89, 317-322.
Ringø, E., Olsen, R.E., Mayhew, T.M., Myklebust, R. 2003. Electron microscopy of the intestinal micrflora of fish. Aquaculture, 227, 395-415.
Ringø, E., Sperstad, S., Myklebust, R., Mayhew, T.M., R.E. Olsen 2006. The effect of dietary inulin on aerobic bacteria associated with hindgut of Arctic charr (Salvelinus alpinus L.), Aquaculture Research, 37, 891-897.
Rombaut, G., Suantika, G., Boon, N., Maertens, S., Dhert, P., Top, E., Sorgeloos P., Verstraete W., 2001. Monitoring of the evolving diversity of the microbial community present in rotifer cultures. Aquaculture, 198, 237-252.
Ruth E., Hamady, L., M., Lozupone, C., Turnbaugh, P., J., et al. 2008. Evolution of Mammals and Their Gut Microbes. Since, 320, 1647-1651.
Sun, Y.Z., Yang, H.L., Ma, R.L., Song, K., Lin, W.Y. 2011. Molecular analysis of autochthonous microbiota along the digestive tract of juvenile grouper Epinephelus coioides following probiotic Bacillus pumilus administration. Journal of Applied
Microbiology, 110, 1093-1103.