(Annals of the Brazilian Academy of Sciences)
Printed version ISSN 0001-3765 / Online version ISSN 1678-2690 www.scielo.br/aabc
http://dx.doi.org/10.1590/0001-3765201520140098
Bacterial and Archaeal Communities Variability Associated with Upwelling and Anthropogenic Pressures in the Protection
Area of Arraial do Cabo (Cabo Frio region - RJ)
SERGIO A. COELHO-SOUZA1,2, FÁBIO V. ARAÚJO3, JULIANO C. CURY4,5, HUGO E. JESUS5, GILBERTO C. PEREIRA6, JEAN R.D. GUIMARÃES2, RAQUEL S. PEIXOTO5,
ALBERTO M.R. DÁVILA7 and ALEXANDRE S. ROSADO5
1
Instituto de Ciências do Mar Almirante Paulo Moreira, Rua Kyoto, 253, Praia dos Anjos, 28930-000 Arraial do Cabo, RJ, Brasil
2Instituto de Biofísica Carlos Chagas Filho, Centro de Ciências da Saúde, Universidade Federal do Rio de Janeiro, Avenida Carlos Chagas Filho, 373,
Bloco G, Sala 49, Ilha do Fundão, 21949-902 Rio de Janeiro, RJ, Brasil 3
Laboratório de Microbiologia, Departamento de Ciências,
Faculdade de Formação de Professores, Universidade do Estado do Rio de Janeiro, Rua Francisco Portela, 1470, Patronato, 24435-005 São Gonçalo, RJ, Brasil
4Laboratório de Microbiologia Molecular, Departamento de Ciências Exatas e Biológica, Universidade Federal de São João del-Rei, Rua Sétimo Moreira Martins, 188, Itapoã II, 35702-031 Sete Lagoas, MG, Brasil
5
Laboratório de Ecologia Microbiana Molecular, Instituto de Microbiologia Paulo de Góes, Centro de Ciências da Saúde, Universidade Federal do Rio de Janeiro, Avenida Carlos Chagas Filho, 373,
Bloco E, Subsolo, Ilha do Fundão, 21941-902 Rio de Janeiro, RJ, Brasil
6Programa de Engenharia Civil, Núcleo de Transferência de Tecnologia, Instituto Alberto Luiz Coimbra de Pós-Graduação e Pesquisa em Engenharia, COPPE/UFRJ, Centro de Tecnologia, Avenida Horácio Macedo,
2030, Bloco B, Sala 25, Ilha do Fundão, 21941-941 Rio de Janeiro, RJ, Brasil
7Laboratório de Biologia Computacional e Sistemas, Pavilhão Leonidas Deane, Fundação Oswaldo Cruz, Instituto Oswaldo Cruz, Avenida Brasil, 4365, Sala 301, Manguinhos, 21040-360 Rio de Janeiro, RJ, Brasil
Manuscript received on February 26, 2014; accepted for publication on January 27, 2015
ABSTRACT
Upwelling systems contain a high diversity of pelagic microorganisms and their composition and activity are defined by factors like temperature and nutrient concentration. Denaturing gradient gel electrophoresis (DGGE) technique was used to verify the spatial and temporal genetic variability of Bacteria and Archaea in two stations of the Arraial do Cabo coastal region, one under upwelling pressure and another under anthropogenic pressure. In addition, biotic and abiotic variables were measured in surface and deep waters from three other stations between these stations. Six samplings were done during a year and adequately represented the degrees of upwelling and anthropogenic pressures to the system. Principal Component Analysis (PCA) showed negative correlations between the concentrations of ammonia and phosphorous with prokaryotic secondary production and the total heterotrophic bacteria. PCA also showed negative correlation between temperature and the abundance of prokaryotic cells. Bacterial and archaeal compositions were changeable as were the oceanographic conditions,
and upwelling had a regional pressure while anthropogenic pressure was punctual. We suggest that the measurement of prokaryotic secondary production was associated with both Bacteria and Archaea activities, and that substrate availability and temperature determine nutrients cycling.
Key words: microbial diversity, leucine incorporation, flow cytometry, temperature, nutrients availability,
Brazilian Upwelling System.
INTRODUCTION
Bacterial communities are abundant in the oceans and control the rates and patterns of organic matter remineralization (e.g. Martinez et al. 1996). Their abundance and activity are associated with temperature and the concentration of nutrients (Baltar et al. 2007, Carlsson et al. 2012). How its composition varies over space and time is of major importance for understanding the role of microorganisms in marine biogeochemistry (Riemann et al. 1999).
In general, higher bacterial diversity is found in transition zones rather than in stable habitats (Stevens and Ulloa 2008). Environmental changes
(e.g. physical changes like temperature and salinity
or algal blooms) could affect bacterial community and the mechanisms that drive lineage and community functions (Morris et al. 2010). Teira et al. (2009a) suggested distinct competitive abilities
since bacterial group-specific growth rates did not
correlated with ambient conditions.
A wide spatial variability in the composition of bacterial assemblages is observed in upwelling and frontal systems, indicating that oceanographic regimes (Alonso-Saez et al. 2007) and anthropogenic pressures (Cury et al. 2011) are important to shape bacterial community
structure. Upwelling regions are known as
important places of nitrogen loss in the marine systems as a consequence of microbial activities.
For instance, heterotrophic denitrification and
aerobic/anaerobic oxidation of ammonium are important for the removal of nitrogen in oxygen minimum zones of upwelling areas (Kuypers et al. 2005). In a Spanish upwelling system, the process
of nitrogen regeneration in the lower layer was estimated to provide ~50 % of the nitrate and ~30 % of the ammonium assimilated in the upper layer (Alvarez-Salgado and Gilcoto 2004).
Recently, Archaea was recognized as an abundant group in upwelling systems (Quiñones et al. 2009) and has an important role in global ocean biogeochemistry, including nitrogen cycling (Turich et al. 2007). Therefore, as previously argued by Levipan et al. (2007a), the inclusion of Archaea in the dynamics of dissolved organic matter cycling
and in measurements of prokaryotic secondary
production should be considered. Furthermore, Morris et al. (2010) suggested that Archaea are
important nitrifiers in nutrient-rich surface waters,
which may suggest that Archaea is more important than Bacteria in the ammonia oxidation - at least
in the first step of the nitrification process since
Bacteria is needed to oxidize nitrite to nitrate (Fuhrman and Hagström 2008).
The aim of this study was to verify the temporal and spatial variability of Bacteria and Archaea in surface and deep waters from the main Brazilian upwelling system (Cabo Frio region) applying DGGE techniques, for a better understanding of the role of these microorganisms in upwelling systems. Two stations were considered for DGGE analysis, one with a strong upwelling occurrence and another with lower upwelling occurrence but high anthropogenic pressure. In these and three additional stations, we measured temperature, concentrations of inorganic nutrients, abundance of total heterotrophic bacteria, total and thermotolerant
coliforms, prokaryotic cells and prokaryotic
MATERIALS AND METHODS
STUDIED AREA
In the Brazilian coast, the South Atlantic Central Water (SACW) ascension determines the upwelling event along the southeast-southern portion. Castro and Miranda (1998) considered that SACW is predominating when water temperatures are below 20 °C and that SACW is mixed with other water types when temperatures are up to 22 °C. The Cabo Frio region (23°S, 42°W) is where upwelling occurs more intensely and is described by a change in coastal line direction from north-south to east-west, that approaches the continent and the continental shelf (Valentin 2001). Both, coastline geometry
and bottom oceanic topography, influence the
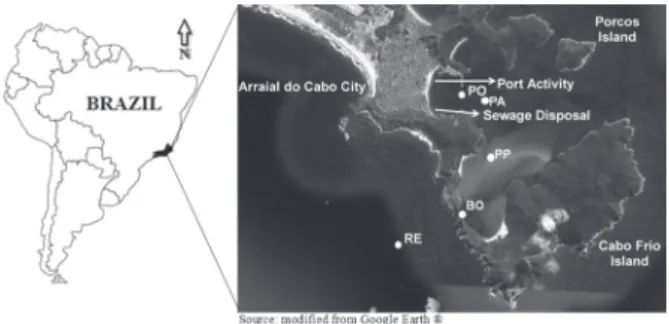
magnitude of upwelling (Rodrigues and Lorenzetti 2001, Calado et al. 2010). However, upwelling processes are mainly function of higher frequency and intensity of northeastern winds during the spring and summer austral seasons (Castelão and Barth 2006, Calado et al. 2008). Samplings were done in the Marine Extractive Reserve of Arraial do Cabo (Fig. 1) where different degrees of the
influence of upwelling are observed in a small
spatial scale (Coelho-Souza et al. 2012). Though Arraial do Cabo is a marine protected area, it suffers anthropogenic pressures such as harbor practices and sewage disposal (Ferreira et al. 2004, Pereira et al. 2010, Cury et al. 2011).
SAMPLING DESIGN
To represent the spatial variability, five stations
where selected to characterize the hydrological changes in the system (Fig. 1). The studied stations were determined in a transect from offshore (where upwelling is more common) (RE - 23°00'S; 42°01'W) to the most impacted area (PO - 22°58'S; 42°00'W) (with harbor activities and sewage disposal). Between them, three sites were included: Boqueirão (BO - 22°59'S; 42°00'W), Ponta do Pontal do Atalaia (PP - 22°59'S; 42°00'W) and Praia dos Anjos (PA - 22°58'S; 42°00'W). In each station, surface (S) and deep (F) waters were sampled since water column
stratification is associated with upwelling systems.
Surface waters were sampled from 0.5 m and bottom waters from different depths according to the station: RE (50 m), BO (25 m), PP (6 m), PA (17 m) and PO (10 m). To observe the temporal variability, six sampling dates were done between February 2008 and January 2009. DGGE analyses were only done on samples from RE and PO stations, for comparison with a previous study highlighting the upwelling and anthropogenic pressures (Cury et al. 2011).
HYDROLOGICAL VARIABLES
Water temperatures were measured in situ using a multiparameter probe (YSI, Model 556) and samples were collected with a 5-L Van Dorn bottle. Sub-samples of 100-mL were collected for microbiological counts (coliforms and heterotrophic bacteria) and placed in sterilized bags. For nutrient analysis (ammonia, nitrite, nitrate and phosphate), 1-L of each van Dorn sample was placed in a polypropylene bottle. For molecular analysis, 1-L of water was collected in triplicate (three van Dorn casts for each subsurface and bottom depth sampling) and placed in autoclaved polypropylene bottles. All samples were stored on wet ice until laboratory processing.
Twenty milliliters of water from each Van Dorn
bottle was separated for prokaryotic secondary production and flow cytometry analyses. For Figure 1 - Sampling stations in the Extractive Reserve of
prokaryotic cells enumeration, three 1.7 mL samples of water were fixed with 2 % paraformaldehyde and frozen. Prokaryotic cell concentrations varied
around 50 % among the samples, but all three samples were pooled before dye input. Volumes of
1.7 mL of sampled water were used for prokaryotic secondary production analysis. The first step, the
addition of 3H-leucine, was performed under field conditions in triplicate and using a control. After incubation (stopped adding 5 % TCA), the samples were frozen until protein extraction.
NUTRIENTS QUANTIFICATION
Nutrients were analyzed for total Kjedahl nitrogen and ammoniac nitrogen (ammonium; N-NH3/ NH4+) by the indophenol method; nitrite (N-NO2-) by diazotation; nitrate (N-NO3-) by reduction in cadmium-copper column followed by diazotation; and total phosphorous and ortophosphate (P-PO3-) by reaction with ascorbic acid. All these methods are described in more detail in Grasshoff et al. (1983) and Parsons et al. (1984). Analyses were done in triplicate.
BACTERIAL COUNTING
Total and thermotolerant coliforms were identified
only in subsurface waters using MPN methods. Serial dilutions of the water samples (10; 1; 0.1; 0.01 and 0.001 mL) were inoculated in Lauryl Sulphate broth and incubated for 48 h at 35–37 °C to determine the total coliform counts. Positive tubes (presence of bubbles and gas production) were re-inoculated in tubes containing EC broth and incubated for 24 h at 44.5 ± 0.5 °C to determine the thermotolerant coliform counts. MPN tables were used to determine the numbers of total and thermotolerant coliforms (APHA 2000). The total numbers of heterotrophic bacteria were determined by the spread plate method. Aliquots of 0.1 mL from water samples and from 10 and 100 x dilutions were spread onto plates containing Marine Agar. These plates were incubated at 25 ± 3 °C for 48 h, and after 7 days the CFUs (colony forming units) were counted (APHA 2000).
FLOW CYTOMETRY AND PROKARYOTIC SECONDARY PRODUCTION
Picoprokaryotic cell concentrations were measured with a CytoSense-Cytobuoy flow cytometry
equipped with a solid blue laser providing 20 mV at 488 nm, one side scatter (SWS, 446/500 nm) detector and three other detectors to red (chlorophyll-a)
fluorescence (FL1- 669/725 nm); orange/yellow
(FL-2, 601/651 nm), and green/yellow (FL-3,
515/585 nm) fluorescence, respectively (Dubelaar
et al. 1999). Yellow-green 0.92 and 10 µM beads (Fluoresbrite Microparticles, Polysciences Inc.-Warrington, PA) were used as an internal standard.
Picoplankton counts were done considering the
parameters length side scatter and average orange
fluorescence. Picoprokaryotic pooled samples were incubated for 15–30 min in the dark with Syber Green I at a final concentration of 0.5 x 10⁻⁴ of
the commercial stock solution (Marie et al. 1997).
Samples were run 4 times for 1 min at a rate of 2 m s-1 and the discriminator was set to side scatter
and orange fluorescence.
Prokaryotic secondary production was
asse-ssed according to Smith and Azam (1992). Triplicate samples (1.7 mL) were incubated for 1 h in 2 mL Eppendorf tubes containing L-[4.5-3H] leucine (Amersham TRK 510; specific
activity: 73 Ci nmol-1) at a final concentration of 10 nM. The incubations were performed in situ in insulated containers to keep all samples at the
same temperatures. One tube was amended with 90 µL of 100 % ice-cold trichloroacetic acid (TCA)
as a killed control. After 1 h, the incubation was
halted by the addition of TCA, and the samples were frozen. In laboratory, samples were processed for 3H-protein extraction by centrifugation, and 3H
was quantified on a Packard Tricarb 1600 TR liquid
scintillation counter, with internal calibration and
quench correction. Prokaryotic carbon production
DNA EXTRACTION AND PCR-DGGE ANALYSES
Each 1 L sample was filtered through a 0.22 µM diameter cellulose filter membrane (MilliporeTM)
and stored at -80 °C. Each membrane was macerated with liquid nitrogen and used for DNA extraction. The metagenomic DNA was extracted using the
UltraCleanTM Soil DNA kit (MOBIO Laboratories –
Carlsbad, California) according to the manufacturer’s
instructions. DNA integrity was verified by
electro-phoresis in a 1 % agarose gel in TAE buffer.
The final volume for analysis in PCR was 50 µL in a solution containing 2.5 µL of 10 X PCR buffer, (0.2 mM – bacterial; 0.4 mM - archaeal) dNTP, 2.5 mM MgCl2, (0.5 U – bacterial; 2.5 U - archaeal) recombinant Taq DNA polymerase (Fermentas), 5 ng of DNA total of each primer (10 pmol – bacterial; 20 pmol- archaeal) (1 % BSA – bacteria only, 1 % Formamide – bacteria only) and sterilized Milli-Q water.
For PCR-DGGE analysis of bacterial
commu-nities, the 16S rRNA fragments were amplified
by PCR using primers 968f (5’- AAC GCG AAG AAC CTT AC- 3’) containing a clamp GC (5’-CGC CCG CCG (5’-CGC GCG GCG GGC GGG GCG GGG GCA CGG GGG G-3’) added in terminal 5`, and primer L1401r (5’-CGG TGT GTA CAA GAC CC-3’) (Nübel et al. 1999). The PCR program used, comprises one cycle of 5 min initial denaturation at 94 °C, 40 cycles of denaturation (1 min at 94 °C), annealing (1 min at 50 °C), and extension (1 min at
72 °C); final extension at 72 °C for 3 min.
For analyses of archaeal communities, nested
PCR was utilized. In the first amplification, primers
ARCH21 F (5’-TTCCGGTTGATCCYGCCGGA-3’) (Delong 1992) and ARCH915r (5’-GTGCTCCCCC-GCCAATTCCT-3’) (Luna et al. 2009) were used. For second reaction the primers ARC344f + GC (5’-CGC CCG CCG CGC GCG GCG GGC GGG GCG GGG GCA CGG GGG G ACG GGG YGC AGC AGG CGC GA-3’) and ARCH519r (5’-GWA TTA CCG CGG CKG CTG-3’) was utilized (Yu et al. 2008). For
both reactions the PCR program used, comprises one cycle of 5 min initial denaturation at 95 °C, 30 cycles of denaturation (1 min s at 94 °C), annealing (1 min s
at 55 °C), and extension (1’30’’ min at 72 °C); final
extension at 72 °C for 10 min.
The samples were collected in triplicate. DGGE of 40 µL of amplicons of the bacterial/ archaeal 16S rRNA from each sample was carried out using a DCode system (BioRad) at 75 V and 60 °C for 16 h in 1X TAE buffer. The 6 % (w/v) polyacrylamide gels were made with a denaturing gradient ranging from 45 % to 65 % for Bacteria and 8 % polyacrylamide gels for Archaea. After electrophoresis, the gels were stained with SYBR Green I (Molecular Probes) for 40 min and then scanned using a Storm PhosphorImager (Amersham Biosciences).
STATISTICAL ANALYSES
We used Kruskal-Wallis analysis (level of significance = 0.001) to compare the hydrologic
variables between the sampling dates using Statistica 6.0 software. A Principal Component Analysis (PCA) was done considering all measured variables. The supplementary variables (nitrite, nitrate and total nitrogen) were determined with a previous Factor Analyses (James and McCulloch 1990). The number of accepted factors was
determined by Eigen values ≥ 1, and the similarities
between all sampling stations were assessed by cluster analysis (a dendrogram using the Ward method and Euclidean distances).
For PCR-DGGE profiles of Bacteria and
Archaea, dendrograms were constructed after image capture and the band presence/absence was
identified. The band presence or absence, expressed a particular community profile, and cluster analysis
(Jacard index) was performed by the unweighted
pair group method with average linkages (UPGMA)
using BioNumerics software (Applied Maths, Ghent, Belgium). A matrix was constructed for all DGGE
of each band considering all three replicates of each site. Based on this matrix, we obtained ordinations by non-metric multidimensional scaling (nMDS).
nMDS is a nonparametric procedure that uses ranks
of the similarities between samples to construct a
map in which the positions of the samples reflect,
as closely as possible, the dissimilarities among them (Alonso-Saez et al. 2007). For this analysis, all the three DGGE samples were included in each site analyzed and we applied the Sorensen similarity index (Dalirsefat et al. 2009) using Primer software (version 6).
RESULTS
ENVIRONMENTAL AND BIOLOGICAL CHARACTERISTICS
We observed a high spatial-temporal variability in all measured variables (Tables I and II). In average, temperature was highest (25.4 ± 2.0) during April and
lowest (18.7 ± 2.8) during October (p ˂ 0.001). The
highest (5.1 ± 0.9) abundance of total heterotrophic bacteria was during February and the lowest (4.3 ±
0.1) during June (p ˂ 0.001), and for prokaryotic cells,
the highest (9.7 ± 4.5 x 10⁶) and lowest (1.8 ± 1.3 x 10⁶) abundance were observed during September and
Sites T
(°C)
TC
(MPN.100mL-1) (MPN.100mLTTC -1) (cfu.mLTHB-1) (106cells.mLTPP -1) (µgC.LPSP-1.h-1) POS 19.4 - 27.5 0.55 - 2.9 ≤ 0.3 - 1.4 4.1 - 6.8 1.7 - 14.7 0.07 - 2.21
POF 19.2 - 26.0 * * 4.3 - 5.1 2.6 - 9.1 0.03 - 0.51
PAS 20.9 - 27.0 ≤ 0.3 - 3.0 ≤ 0.3 - 1.3 4.5 - 5.6 2.5 - 13.6 0.04 - 0.37
PAF 19.7 - 25.0 * * 4.1- 4.9 0.9 - 4.8 0.03 - 0.16
PPS 20.9 - 27.0 ≤ 0.3 - 2.3 ≤ 0.3 - 0.3 4.2 - 5.3 1.1 - 9.8 0.06 - 0.65
PPF 20.6 - 26.0 * * 4.1 - 4.9 1.6 - 9.7 0.04 - 0.41
BOS 20.2 - 26.1 ≤ 0.3 – 1.1 ≤ 0.3 4.0 - 5.1 0.5 - 17.8 0.03 - 0.86
BOF 13.9 - 23.2 * * 4.3 - 4.8 0.3 - 22.4 0.02 - 0.37
RES 19.1 - 25.5 ≤ 0.3 - 2.7 ≤ 0.3 4.4 - 6.4 1.7 - 8.4 0.01 - 0.51
REF 13.2 - 21.0 * * 4.3 - 5.3 0.7 - 9.3 0.01 - 0.22
TABLE I
Range of temperature and microbiological variables measured in the different samplings. T = Temperature; TC = log Total Coliforms; TTC = log ThermoTolerant Coliforms; THB = log Total Heterotrophic Bacteria; TPP = Total PicoProkaryotic Cells; PSP = Prokariotic Secondary
Production. S – Superficial water; F – Deep water. *Not measured.
January, respectively (p ˂ 0.001). The concentration
of nitrite was highest (2.9 ± 1.4) during February and
June (as for total nitrogen = 0.7 ± 0.1) while total
nitrogen was lowest (0.03 ± 0.05) during November
and January (p ˂ 0.001). However, total nitrogen was
better correlated with nitrate concentration. Usually, the abundance of coliforms was highest in the impacted anthropogenic area (PO and PA). Considering all samples, pH oscillated between 7 - 9, and salinity between 35 - 41 S.
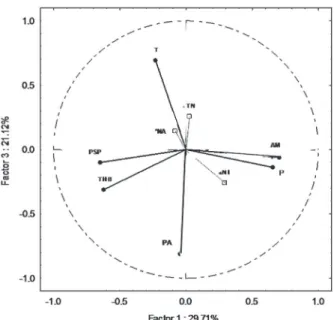
Three factors were considered in the PCA and
justified 77 % of the total variability. The main
factors of variability were the concentrations of ammonia and total phosphorous (with a positive
relationship between both; r2 = 0.68; p ≤ 0.05),
as well as the prokaryotic secondary production
and the concentration of heterotrophic bacteria (with a positive relationship between both; r2 =
0.61; p ≤ 0.05). While factor 1 showed a negative
relationship between these nutrients and the microbiological variables (justifying almost 30 % of the total variability), factor 2 pooled all these variables against temperature (justifying more than
25 %). This contrast represent the higher influence
of upwelling than anthropogenic pressures in a regional scale. Furthermore, more than 20 % of the
variability was justified by the negative relationship
picoprokaryotic cells. Plotting factors 1 and 3, we
observed the contrast between temperature and the
abundance of prokaryotic cells and between the
concentrations of ammonia and phosphorous with
the prokaryotic secondary production and the total
of heterotrophic bacteria (Fig. 2).
PCR-DGGE PROFILES
Bacterial and archaeal community similarities were obtained from the main contrasting sampling periods to better understand the structure and dynamic of microbial communities associated with hydrological status. Then, we decided to perform the PCR-DGGE analysis in three different sampling periods (April 2008, October 2008 and January 2009), which differed mainly regarding water temperature. Considering the anthropogenic and upwelling pressures, DGGE was performed only for PO and RE stations. In April, temperature was 26 °C in PO and 25.5 °C in RES and 21 °C in REF; In October, it was 19.5 °C in PO and RES and 13. 2 °C in REF; In January, it was 23.5 °C in PO and 22.6 °C in RES and 15.6 °C in REF.
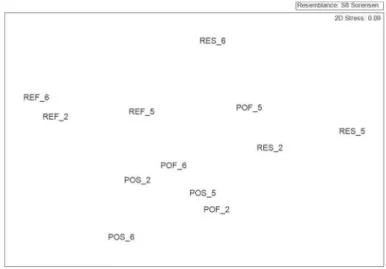
DDGE analysis of Bacteria domain yielded a total of 54 bands, varying from 24 ± 2 (POF) to 15 ± 2 (RES). The repetitions (casts of sampling) were clustered together in the dendrogram, showing a minor variation between the sampling dates and a major variation between the sampling locations (Fig. 3). The first division observed was between deep water samples from offshore and the other sites; regardless of the sampling date. The second group was separated in two subclusters, being the subcluster 1 formed by
TABLE II
Range in concentrations of nutrients (µM), salinity and pH in the studied sites including all samplings. N-NH4 = Ammonia; N-NO2 = Nitrite; N-NO3 = Nitrate; P-PO4 = Phosphate;
TN = Total Nitrogen; TP = Total Phosphorous. S – Superficial water; F – Deep water
Sites N-NH4 N-NO2 N-NO3 P-PO4 S pH
POS <0.001 - 0.080 <0.001 - 0.008 <0.001 - 2.432 <0.001 - 0.474 35.0 - 39.0 7.0 - 8.3 POF <0.001 - 0.090 <0.001 - 0.012 <0.001 - 2.583 <0.001 - 0.369 35.0 - 40.0 8.0 - 8.3 PAS <0.001 - 0.066 <0.001 - 0.009 <0.001 - 2.440 <0.001 - 0.679 35.0 - 39.0 7.5 - 8.3 PAF <0.001 - 0.830 <0.001 - 0.015 <0.001 - 0.678 <0.001 - 1.193 35.6 - 40.0 7.0 - 8.3 PPS <0.001 - 0.054 <0.001 - 0.004 <0.001 - 2.720 <0.001 - 0.470 35.0 - 39.0 7.5 - 8.3 PPF <0.001 - 0.076 <0.001 - 0.008 <0.001 - 4.952 <0.001 - 0.210 35.5 - 40.0 8.0 - 8.3 BOS <0.001 - 0.080 <0.001 - 0.010 <0.001 - 2.200 <0.001 - 0.012 35.0 - 40.0 7.0 - 8.2 BOF <0.001 - 0.010 0.002 - 0.013 <0.001 - 4.165 <0.001 - 0.099 35.0 - 39.0 7.0 - 8.5 RES <0.001 - 0.030 <0.001 - 0.008 <0.001 - 3.306 <0.001 - 0.387 35.0 - 41.0 7.0 - 9.0 REF <0.001 - 0.044 <0.001 - 0.028 0.006 - 4.899 <0.001 - 0.100 35.3 - 40.0 7.0 - 9.0
Figure 2 - PCA analysis (factors 1 and 3) highlighting main
(black circles) and supplementary (white squares) variables. T – Temperature; PSP- Prokariotic Secondary Production; THB – Total Heterotrophic Bacteria; PA – Picoprokaryotic cells
the site with anthropogenic pressure in April and January, and the subcluster 2 formed by all the RES samples and the POF samples of October (period of intensive upwelling occurrence).
DDGE analysis of Archaea domain yielded a total of 47 bands, varying from 14 ± 1 (POF and RES/April) to 6 ± 1 (REF). The DGGE analysis showed a higher homogeneity between the samples than that observed for Bacteria. There were two main clusters, with the casts 1 and 2 of the POS of
April forming an out-group. The main group I was formed only by offshore samples, while the main group II was formed by inshore samples except for the presence of the three casts of the RES samples
of October. nMDS analysis confirmed the high
difference between offshore and inshore samplings
regardless of season (Fig. 4). Unlike for Bacteria,
that had the casts of the same sampling point always grouped together forming the basal groups, the archaeal analysis showed some variations of these
Figure 3 - nMDS plot of PCR-amplified SSU rRNA fragments of
Bacteria pooling all triplicate samples. S – Superficial water; F – Deep
water; 2 – April sampling; 5 – October sampling; 6 – January sampling.
Figure 4 - nMDS plot of PCR-amplified SSU rRNA fragments of
Archaea pooling all triplicate samples. S – Superficial water; F – Deep
basal groupings, especially for the PO samples. The POS waters sampled during April had the highest dissimilarity. Then, a new division was observed separating RES and REF from POS and POF sites. An exception was observed for RES samples from April, when the highest temperature was observed in this and all other sites. In this sampling date, RES had more DDGE bands and was more similar to POF samples from this date and to a lesser degree to the October samples. Even at PO station, divisions between surface and deep waters and sampling periods were also observed. Considering the offshore station, the major separation occurred during January, mainly from deep waters, followed by the surface waters of October. Deep waters from April and October samplings presented almost 50 % of similarity.
DISCUSSION
Our results showed that upwelling and anthro-pogenic pressures drive microbial dynamics in function of temperature and nutrients. We suggest a coupling between temperature and substrate availability determining the assemblage composition, biomass and microbial activity in the Cabo Frio upwelling system (Pomeroy and Wiebe 2001). Despite temperature can regulates microbial metabolism (Feuerpfeil et al. 2004), temperature did
not limit prokaryotic growth. The work of Massana
et al. (2001), showing the microbial growth in Antarctic waters is an example of this. Hoppe et al. (2006) considered that substrate supply is more important than temperature in the regulation of microbial growth on a large spatial scale. Troncoso et al. (2003) also reported that substrate availability seems to be more important than temperature in determining microbial activity and abundance in the Humboldt Current System.
As observed herein, Levipan et al. (2007a)
found no coupling between the prokaryotic
secon-dary production and its abundance, and suggested that it could be associated with the presence of a
wide range of cell metabolic stages and/or the sudden
environmental changes that favor modifications in
carbon incorporation pathways. These authors also
reported that almost 60 % of prokaryotic
secon-dary production was bacterial (we found 61 % of correlation between PSP and THB); and that bacterial heterotrophic production was negatively correlated with ammonium and temperature, but positively correlated with phosphorous. We found a positive correlation between both nutrients and Carlsson et al. (2012) observed that additions of C, N and P (alone or in combination) stimulated microbial growth and activity in both inshore and offshore stations in the Arraial do Cabo coast. In this nutrient input, there was highest heterotrophic production as well as during sewage discards (Coelho-Souza et al. 2013a). Heterotrophic bacteria are important to P cycle as dissolved inorganic P consumers (Duhamel and Moutin 2009) and phosphorous spurs bacterial growth (Yuan et al. 2011).
PROKARYOTIC ASSEMBLAGES, TEMPERATURE AND NITROGEN CYCLING
In a previous work, Cury et al. (2011) reported
different microbial assemblages between PO and RE stations. In the present study, we showed a
high spatial heterogeneity of prokaryotes in the
coast of Arraial do Cabo, associated with South Atlantic Central Waters (SACW) dispersion, as well as due to human activities. Furthermore,
we showed that the prokaryotic assemblages can vary temporally. Prokaryotes have well-defined niches and the community composition
is controlled by abiotic factors such as nutrient type and availability, as well as physical and chemical conditions. For example, dominant heterotrophic and autotrophic bacterial lineages exhibited physiological responses, changing with the nutrient concentrations in the South Atlantic waters (Furhman and Hagström 2008).
diversity is generated and maintained by effects
of temperature on the kinetics of metabolism
(Fuhrman and Stelle 2008), DGGE analyses are discussed following Cury et al. (2011) results. In this study, both PO and RE stations were considered and were sampled during February 2008. Genetic
fingerprints techniques become helpful to analyze
many samples into temporal dynamics or spatial variations of microbial assemblages (Schafer and Muyzer 2001).
Cury et al. (2011) found an expressive contribution of Bacteroidetes, Proteobacteria and Cyanobacteria phylum. The highest abundance of Archaea (mainly Euryarchaeota phylum) was
observed in both natural and artificial eutrophication
stations, suggesting the role of this domain in nitrogen loss in the studied area. Roseobacter, Gammaproteobacteria and Bacterioidetes are abundant bacterial groups in coastal upwelling systems and the assemblage structure is associated with nutrient limitation (Alonso-Saez et al. 2007, Teira et al. 2009b). The rise of temperature stimulated Roseobacter and Gammaproteobacteria. 3H-leucine
incorporation rates and prokaryotic biomass
were positively associated with Bacteriodetes and Gammaproteobacteria but negatively associated with Alphaproteobacteria. Roseobacter, Bacteroidetes and Gammaproteobacteria had a positive correlation with labile substrates, total bacteria abundance and the concentration of dissolved organic matter, but it was negatively associated with nitrate and phosphate. Alphaproteobacteria are active colonizers of particles and good competitors under low-nutrient conditions and its presence opposes Bacteroidetes (Teira et al. 2008).
Following these studies, some scenarios are suggested in function of the measured abiotic and biotic variables. Factors 1 and 2 of PCA could
correspond to a nitrification process with microbes
consuming ammonium and phosphorous, and the total nitrogen indicating the nitrate accumulation due to ammonia and nitrite oxidation. Factor 3 shows the
importance of temperature and nitrate controlling
prokaryotic growth. We suggest that an intense nitrification process in deep waters occurred during
the October sampling. Both REF and BOF sites
had the highest prokaryotic secondary production
associated with high concentrations of nitrite and nitrate, but with low concentrations of ammonia and phosphate. The growth of Betaproteobacteria
was associated with the nitrification process in other
upwelling system, in experiments done with similar temperature as reported here (Teira et al. 2011a).
A positive correlation between nitrification process
and ammonium and phosphate concentrations was observed, and Carlsson et al. (2012) showed that
these nutrients control the prokaryotic growth in
the Cabo Frio upwelling region. On the other hand,
prokaryotic secondary production in January was
below the detection limit, whereas the highest concentrations of phosphate and total phosphorous were observed herein. Phosphorous could have
limited the prokaryotic growth in April and June.
These situations could favor growth of some bacterial groups such as the Alphaproteobacteria class, for example (Teira et al. 2011b).
The absence of SACW constrains an oligo-trophic system, with an intense bottom-up control, that predominate the microbial food web structure. Cyanobacteria are the major primary producers,
as well as nanophytoplankton, and heterotrophic
bacteria are active consumers of cyanobacteria´s dissolved organic matter. In this situation, we suggest that Alphaproteobacteria compete with Bacteroidetes and Gammaproteobacteria, and light should be an important factor determining their depth distribution (Coelho-Souza et al. 2013b). Gamma-, Beta- and Deltaproteobacteria, as well
as Crenarchaeota are important for nitrification/ denitrification processes. During the SACW
mixture and water warming. The high diversity
intensifies the herbivorous food web structure and prokaryotes make use of dissolved and particulate
organic matter.
With regard to the sampling depth, the division
between prokaryotic assemblages was evident (Cury
et al. 2011). The warmest temperature observed for samples collected in April was associated with the higher similarity of Archaeal community between RES and POS/POF sites than between RES and REF. Temperature could be more important in controlling the composition of Archaea in surface waters and of Bacteria in deep waters (Feuerpfeil et
al. 2004). Usually, prokaryotic secondary production
was higher in RES than in REF, the exception was observed during the intense upwelling sampling (October). The highest concentration of total nitrogen in surface waters during October could be associated with other forms of nitrogen (other than nitrite and nitrate). The abundance of Planctomycetales at RES observed by Cury et al. (2011) suggest that this phylum could be important to oxidize fatty acids with short-chain, including the reduction of nitrate via nitrite to ammonium, as a result of the metabolically
versatile anammox bacteria activity (Woebken et al.
2007, Thamdrup and Dalsgaard 2008).
ANTHROPOGENIC PRESSURE
The abundance of prokaryotes was highest during the first stage of the upwelling season (September)
and could be associated with the suspension of benthic microorganisms. On the other hand, the concentrations of coliforms and heterotrophic
bacteria, as well as the prokaryotic secondary
production, were highest during the summer months, a season associated with touristic activities increasing local population. Coliforms were also present in the other samples, showing the role of global-scale actions on local-scale pollution, represented by basin scale oscillations, as well as oceanographic and atmospheric processes (Boehm et al. 2004). For instance, the role of topography
in water circulation explained the presence of fecal indicator bacteria at seaward stations of Senegal coastal waters (Bouvy et al. 2008). Sewage disposal could also favors Crenarchaeota development (Furhman and Hagstrom 2008), mainly in Anjos embayment (Cury et al. 2011) but Crenarchaeota assemblage success is not essentially associated
with fecal pellets or any kind of compact macro
aggregate (Levipan et al. 2007b).
ACKNOWLEDGMENTS
This work was supported by Fundação de Amparo à
Pesquisa do Estado do Rio de Janeiro (FAPERJ, project process E-26/110.290/2007), Conselho Nacional de
Desenvolvimento Científico e Tecnológico (CNPq)
and Coordenação de Aperfeiçoamento de Pessoal de
Nível Superior (CAPES). We thank Barbara Lage and
Wanderson Carvalho for their useful comments.
RESUMO
oceanográficas, e a ressurgência teve uma pressão regional enquanto a pressão antropogênica foi pontual. Sugerimos que as medidas de produção secundária procariótica esteve associada à atividade de ambas Bacteria e Archaea, e que a disponibilidade de substrato e a temperatura determinam a ciclagem de nutrientes.
Palavras-chave: diversidade microbiana, incorporação de leucina, citometria de fluxo, temperatura, disponibi-lidade de nutrientes, Sistema Brasileiro de Ressurgência.
REFERENCES
ALONSO-SAEZ L, ARISTEGUI J, PINHASSI J, GOMEZ-CONSARNAU L, GONZALEZ JM, VAQUE D, AGUSTI S AND GASOL JM. 2007. Bacterial assemblage structure and carbon metabolism along a productivity gradient in the NE Atlantic Ocean. Aquat Microb Ecol 46: 43-53. ALVAREZ-SALGADO XA AND GILCOTO M. 2004. Inferring
nitrification rates with an inverse method in a coastal
upwelling system, Ria de Vigo (NW Spain). Mar Ecol Prog Ser 276: 3-17.
APHA - AMERICAN PUBLIC HEALTH ASSOCIATION. 2000. Standard methods for the examination of water and wastewater Washington DC.
BALTAR F, ARISTEGUI J, GASOL JM, HERNANDEZ-LEON S AND HERNDL GJ. 2007. Strong coast-ocean and surface-depth
gradients in prokaryotic assemblage structure and activity
in a coastal transition zone region. Aquat Microb Ecol 50: 63-74.
BOEHM AB, LLUCH-COTA DB, DAVIS KA, WINANT CD AND MONISMITH SG. 2004. Covariation of coastal water temperature and microbial pollution at interannual to tidal periods. Geophys Res Let 31. DOI: L0630910.1029/2003gl019122.
BOUVY M, BRIAND E, BOUP MM, GOT P, LEBOULANGER C, BETTAREL Y AND ARFI R. 2008. Effects of sewage discharges on microbial components in tropical coastal waters (Senegal, West Africa). Mar Freshwat Res 59: 614-626.
CALADO L, GANGOPADHYAY A AND SILVEIRA ICA. 2008. Feature-oriented regional modeling and simulations (FORMS) for the western South Atlantic: Southeastern Brazil region. Ocean Model 25: 48-64.
CALADO L, SILVEIRA ICA, GANGOPADHYAY A AND DE CASTRO BM. 2010. Eddy-induced upwelling off Cape Sao Tome (22 degrees S, Brazil). Contl Shelf Res 30: 1181-1188. CARLSSON P, GRANELI E, GRANELI W, RODRIGUEZ EG, DE
CARVALHO WF, BRUTEMARK A AND LINDEHOFF E. 2012.
Bacterial and phytoplankton nutrient limitation in tropical marine waters, and a coastal lake in Brazil. J Exp Mar Biol
Ecol 418: 37-45.
CASTELÃO RM AND BARTH JA. 2006. Upwelling around Cabo Frio, Brazil: The importance of wind stress curl. Geophys Res Let 33. DOI: 10.1029/2005gl025182.
CASTRO BM AND MIRANDA LB. 1998. Physical oceanography of the western Atlantic continental shlef located between 4°N and 34°S - costal segment (4,w). In: Robinson AR
and Brink KH (Eds), The sea. J Wiley & Sons, Inc.,
p. 209-251.
COELHO-SOUZA SA, LÓPEZ MS, GUIMARAES JRD, COUTINHO R AND CANDELLA RN. 2012. Biophysical interactions in the Cabo Frio upwelling system, Southeastern Brazil. Braz J Oceanog 60: 353-365.
COELHO-SOUZA SA, MIRANDA MR, SALGADO LT, COUTINHO R AND GUIMARAES JRD. 2013b. Adaptation of the [3] H-Leucine technique to measure heterotrophic activity
associated with biofilm on the blades of the seaweed
Sargassum spp. Microb Ecol 65: 424-436.
COELHO-SOUZA SA, PEREIRA GC, COUTINHO R AND GUIMARAES JRD. 2013a. Yearly variation of bacterial production in the Arraial do Cabo protection area (Cabo Frio upwelling region): an evidence of anthropogenic pressure. Braz J Microbiol 44: 1-9
CURY JC, ARAUJO FV, COELHO-SOUZA SA, PEIXOTO RS, OLIVEIRA JAL, SANTOS HF, DAVILA AMR AND ROSADO AS. 2011. Microbial Diversity of a Brazilian Coastal Region
Influenced by an Upwelling System and Anthropogenic
Activity. Plos One 6: e16553. DOI:10.1371/journal. pone.0016553.
DALIRSEFAT SB, DA SILVA MEYER A AND MIRHOSEINI SZ. 2009.
Comparison of similarity coefficients used for cluster analysis with amplified fragment length polymorphism markers in the silkworm, Bombyx mori. J Insect Sci 9:
insectscience.org/9.71
DELONG EF. 1992. Archaea in coastal marine environments. Proc Nat Acad Sci USA 89: 5685-5689.
DUBELAAR GBJ, GERRITZEN PL, BEEKER AER, JONKER RR AND TANGEN K. 1999. Design and first results of
CytoBuoy: A wireless flow cytometer for in situ analysis
of marine and fresh waters. Cytometry 37: 247-254. DUHAMEL S AND MOUTIN T. 2009. Carbon and phosphate
incorporation rates of microbial assemblages in contrasting
environments in the Southeast Pacific. Mar Ecol Prog Ser
375: 53-64.
FERREIRA CEL, GONCALVES JEA AND COUTINHO R. 2004. Ship hulls and oil platforms as potential vectors to marine species introduction. J Coast Res 3: 1340-1345.
FEUERPFEIL P, RIELING T, ESTRUM-YOUSEFF SR, DEHMLOW J, PAPENFUSS T, SCHOOR A, SCHIEWER U AND SCHUBERT H. 2004. Carbon budget and pelagic community compositions at two coastal areas that differ in their degree of eutrophication, in the Southern Baltic Sea. Est Coast Shelf Sci 61: 89-100.
FUHRMAN JA AND HAGSTRÖM Å. 2008. Bacterial and archaeal community structure and its patterns. In: Kirchman D (Ed), Microbial Ecology of the Oceans. Wiley, p. 45-90. FUHRMAN JA AND STEELE JA. 2008. Community structure
of marine bacterioplankton: patterns, networks, and
GRASSHOFF KK, EHRHARDT M AND KREMLING K. 1983. Methods of Seawater Analysis. Wiley, p. 143-150. HOPPE HG, GOCKE K, KOPPE R AND KRAUS G. 2006. Changing
bacterioplankton growth characteristics on a large spatial
scale: oligotrophic versus mesotrophic ocean. Mar Ecol Prog Ser 323: 21-33.
JAMES FC AND MCCULLOCH CE. 1990. Multivariate-analysis in ecology and systematics - panacea or pandora box? An Rev Ecol Syst 21: 129-166.
KUYPERS LG, WOEBKEN D, SCHMID M, FUCHS BM, AMANN R, JORGENSEN BB AND JETTEN MSM. 2005. Massive nitrogen loss from the Benguela upwelling system through anaerobic ammonium oxidation. Proc Nat Acad Sci USA 102: 6478-6483.
LEVIPAN HA, QUIÑONES RA, JOHANSSON HE AND URRUTIA H. 2007b. Methylotrophic methanogens in the water column of an upwelling zone with a strong oxygen gradient off central Chile. Mic Environ 22: 268-278.
LEVIPAN HA, QUIÑONES RA AND URRUTIA H. 2007a. A time
series of prokaryote secondary production in the oxygen
minimum zone of the Humboldt current system, off central Chile. Prog Oceanog 75: 531-549.
LUNA GM, STUMM K, PUSCEDDU A AND DANOVARO R. 2009. Archaeal diversity in deep-sea sediments estimated by means of different terminal-restriction fragment length polymorphisms (T-RFLP) protocols. Currents in Microbiology 59: 356-361.
MARIE D, PARTENSKY F, JACQUET S AND VAULOT D. 1997. Enumeration and cell cycle analysis of natural populations
of marine picoplankton by flow cytometry using the
nucleic acid stain SYBR Green I. App Environ Microbiol 63: 186-193.
MARTINEZ J, SMITH DC, STEWARD GF AND AZAM F. 1996. Variability in ectohydrolytic enzyme activities of
pelagic marine bacteria and its significance for substrate
processing in the sea. Aquat Microb Ecol 10: 223-230. MASSANA R, PEDROS-ALIO C, CASAMAYOR EO AND GASOL JM.
2001. Changes in marine bacterioplankton phylogenetic composition during incubations designed to measure
biogeochemically significant parameters. Limnol Oceanogr
46: 1181-1188.
MORRIS RM, NUNN BL, FRAZAR C, GOODLETT DR, TING YS AND ROCAP G. 2010. Comparative metaproteomics reveals ocean-scale shifts in microbial nutrient utilization and energy transduction. ISME J 4: 673-685.
NÜBEL U, GARCIA-PICHEL F, KUHL M AND MUYZER G. 1999. Quantifying bacterial diversity: morphotypes, 16S rRNA genes, and carotenoids of oxygenic phototrophs in microbial mats. App Environ Microbiol 65: 422-443. PARSONS TR, MAITA Y AND LALLI M. 1984. A manual of
chemical and biological methods for seawater analysis.
Pergamon Press, New York, 173 p.
PEREIRA GC, FIGUEIREDO AR, JABOR PM AND EBECKEN NFF. 2010. Assessing the ecological status of plankton in Anjos
Bay: a flow cytometry approach. Biogeoscience Discuss
7: 6243-6264.
POMEROY LR AND WIEBE WJ. 2001. Temperature and substrates as interactive limiting factors for marine heterotrophic bacteria. Aquat Microb Ecol 23: 187-204.
QUIÑONES RA, LEVIPAN HA AND URRUTIA H. 2009. Spatial
and temporal variability of planktonic archaeal abundance
in the Humboldt Current System off Chile. Deep-Sea Res II 56: 1083-1092.
RIEMANN L, STEWARD GF, FANDINO LB, CAMPBELL L, LANDRY MR AND AZAM F. 1999. Bacterial community composition during two consecutive NE Monsoon periods in the Arabian Sea studied by denaturing gradient gel electrophoresis (DGGE) of rRNA genes. Deep-Sea Res II 46: 1791-1811.
RODRIGUES RR AND LORENZZETTI JA. 2001. A numerical study of the effects of bottom topography and coastline geometry on the Southeast Brazilian coastal upwelling. Cont Shelf Res 21: 371-394.
SCHAFER H AND MUYZER G. 2001. Denaturing gradient gel electrophoresis in marine microbial ecology. Met Microbiol 30: 425-468.
SIMON M AND AZAM F. 1989. Protein-content and
protein-synthesis rates of planktonic marine-bacteria. Mar Ecol
Prog Ser 51: 201-213.
SMITH DC AND AZAM F. 1992. A simple, economical method for measuring bacterial protein synthesis rates in seawater using 3H-leucine. Mar Microb Food Webs 6: 107-114. STEVENS H AND ULLOA O. 2008. Bacterial diversity in the
oxygen minimum zone of the eastern tropical South
Pacific. Environ Microbiol 10: 1244-1259.
TEIRA E, ARANGUREN-GASSIS M, GONZALEZ J, MARTINEZ-GARCIA S, PEREZ P AND SERRET P. 2009b. Influence of allochthonous matter on microbial community structure and function in an upwelling system off the northwest Iberian Peninsula. Aqua Microb Ecol 55: 81-93.
TEIRA E, GASOL JM, ARANGUREN-GASSIS M, FERNANDEZ A, GONZALEZ J, LEKUNBERRI I AND ALVAREZ-SALGADO XA. 2008. Linkages between bacterioplankton community composition, heterotrophic carbon cycling and environmental conditions in a highly dynamic coastal ecosystem. Environ Microbiol 10: 906-917.
TEIRA E, MARTINEZ-GARCIA S, CARREIRA C AND MORAN XAG. 2011b. Changes in bacterioplankton and phytoplankton community composition in response to nutrient additions in coastal waters off the NW Iberian Peninsula. Mar Ecol Prog Ser 426: 87-104.
TEIRA E, MARTINEZ-GARCIA S, LONBORG C AND ALVAREZ-SALGADO XA. 2009a. Growth rates of different
phylogenetic bacterioplankton groups in a coastal
upwelling system. Environ Microbiol Rep 1: 545-554. TEIRA E, MARTINEZ-GARCIA S, LONBORG C AND
ALVAREZ-SALGADO XA. 2011a. Betaproteobacteria growth and
nitrification rates during long-term natural dissolved
organic matter decomposition experiments. Aquat Microb Ecol 63: 19-27.
TRONCOSO VA, DANERI G, CUEVAS LA, JACOB B AND MONTERO P. 2003. Bacterial carbon flow in the Humboldt current system off Chile. Mar Ecol Prog Ser 250: 1-12. TURICH C, FREEMAN KH, BRUNS MA, CONTE M, JONES AD
AND WAKEHAM SG. 2007. Lipids of marine Archaea: Patterns and provenance in the water-column and sediments. Geoch Cosmoch Acta 71: 3272-3291.
VALENTIN JL. 2001. The Cabo Frio upwelling system, Brazil. In: Seeliger U and Kjerfve B (Eds), Coastal marine ecosystems of latin america. Springer, Berlin, p. 97-105. WOEBKEN D, FUCHS BA, KUYPERS MAA AND AMANN R. 2007.
Potential interactions of particle-associated anammox bacteria with bacterial and archaeal partners in the Namibian upwelling system. App Environ Microbiol 73: 4648-4657.
YU Z, GARCÍA-GONZÁLEZ R, SCHANBACHER FL AND MORRISON M. 2008. Evaluations of different hypervariable regions
of archaeal 16S rRNA genes in profiling of methanogens by Archaea-specific PCR and denaturing gradient gel
electrophoresis. App Environ Microbiol 74: 889-893. YUAN X, HE L, YIN K, PAN G AND HARRISON PJ. 2011. Bacterial