This position paper reflects the perspective presented at the Workshop ‘Pensando o Futuro do Setor Energético Brasileiro’ (September 2016) and focuses on issues related to creating con-ditions for long-term financing and its risks, including
• Discussion of the prerequisites to develop a robust finan-cial market to support the long-term development of the infrastructure sector in Brazil in a post-BNDES era (limited lending role and the possibility of new guarantor role), using the power and gas sectors as pilot cases;
• Analysis of additional financial products and facilities to sup-port long-term financing in the power and gas sectors, such as guarantees and insurance products, provided by BNDES, insurance companies, and multilateral institutions; and
• (Re)assessment of the risk management attitude and mindset in existing project finance practices, identifying current allocation patterns and future trends to attract new capital (for example, financial hedges, contract dol-larization, and tracking accounts).
Summary
1. Introduction ... 4
2. The Approach ... 6
3. The Current Brazilian Environment ... 8
4. Sources of Capital (Supply Side) ... 14
4.1. Bank Financing ... 15
4.2. Non-bank Financing ... 18
4.3. Alternative Sources of Supply ... 19
4.3.1. Project Bonds ... 19
4.3.2. Municipal Governments ... 20
4.3.3. Others ... 21
5. Opportunities to Invest ... 21
5.1. Financial Opportunities to Invest ... 22
5.1.1. Treasury Notes ... 22
5.1.2. Listed Companies ... 25
5.1.3. Debt Instruments ... 26
5.2. Physical Opportunities to Invest ... 28
5.2.1. Networks as Investments and EVA Analysis ... 28
5.2.2. Benchmarking and Risk Assessment ... 30
6. Market Environment ... 32
6.1. Market Features ... 32
6.1.1. Pension Funds ... 32
6.1.2. Insurance Companies ... 34
6.1.3. Energy Trading in Organized Markets - Energy Exchange ... 35
6.2. Foreign Exchange Risk ... 36
6.2.1. The Case Study of the Airports Sector ... 38
6.2.2. Evaluating the Inclusion of Market Solutions ... 38
6.2.3. The Government’s New Challenge: Scaling FX Hedging ... 40
7. Concluding Remarks ... 40
Summary of Figures and Tables
FiguresFigure 1. Long-term Financing Framework in Brazil ... 7
Figure 2. Competition in Recent Transmission Auctions (Number of Items) ... 9
Figure 3. Sources of Funds for Investments in Infrastructure (BRL, billions) – 2014 ... 10
Figure 4. BNDES - Revenue Sources (BRL, billions) ... 10
Figure 5. BNDES Disbursements in Infrastructure (BRL, billions) ... 11
Figure 6. Investment Funds: Net Asset Value (June 2016)¹ ... 12
Figure 7. Portfolio Allocation of Pension Funds (2015) ... 13
Figure 8. Portfolio Allocation of Insurers (September 2015) ... 13
Figure 9. Infrastructure Investments in Brazil by Sector (as a Percentage of GDP) ... 14
Figure 10. Infrastructure Investments in Brazil (as a Percentage of GDP) ... 15
Figure 11. Federal Domestic Public Debt (BRL, millions) ... 24
Figure 12. Brazilian Treasury Securities (BRL, millions) ... 24
Figure 13. Brazilian Treasury Securities (BRL, millions) - December 2015 ... 25
Figure 14. Total Amount Issued in Debentures (BRL, billions) ... 27
Figure 15. Debentures Issued by Maturity ... 27
Figure 16. ROIC x WACC for Distribution Companies in Brazil ... 29
Figure 17. A Zero-cost Collar and a Currency Swap ... 39
Tables Table 1. Basel III Capital Requirement Schedule ... 16
Table 2. Basel III Capital Requirement Schedule – Detailed... 17
Table 3. Features of Government Securities ... 23
Table 4. WACC Evolution ... 30
Table 5. Energy Project Risks ... 31
Table 6. Result of the Auction of Airport Concessions - March 2017 ... 38
Table 7. The Proposed Model by the Government ... 40
Table 8. The Collar as a Hedge of a debt in a foreigner currency ... 40
Table 9. Wind Power Project Risks ... 43
Table 10. Large Hydropower Project Risks ... 44
Table 11. Power Transmission Project Risks ... 45
Table 12. Natural Gas Distribution Project Risks ... 46
1. Introduction
The main challenge in fostering investments for infrastructure projects nowadays is to engage the private sector. This is a common problem in several countries. The consulting firm McKinsey esti-mates that infrastructure projects in the world will require investments of US$57 trillion from 2013 to 2030. Even though the bulk of resources will come from public funds, this number includes private funds—approximately 0.5 percent of global gross domestic product (GDP) in every year of the stated period.
According to the Organisation for Economic Co-operation and Development (OECD), only 1.6 percent of the US$106 trillion available from institutional capital is currently being directed to infrastructure investments. In turn, the Global Infrastructure Hub (GIH) reports that 69 percent of the institutional investor funds would be willing to increase their allocation in the segment. These numbers are evidence of the availability of resources that could help closing the infrastruc-ture gap. Therefore, it is worth investigating how the competing opportunities can be successful in attracting such funds.
The challenge of attracting investments for infrastructure is particularly exacerbated in Brazil considering the lack of a developed capital market for long-term finance.
In this paper, we aim at contributing to the debate, by discussing the preconditions to develop a robust financial market to support the long-term development of the infrastructure sector in Brazil. We will use the energy sector, in particular power and gas, as the pilot case.
The topic can be addressed from the perspective of the (underdeveloped and almost missing) market for long-term financing. In such a context, it is important to understand the underlying forces that produce the transactions or products—the financial closing.
Our proposed approach to address the long-term financing challenge is to investigate supply and demand in the market for energy assets. The supply side consists of the sources of capital—funds willing and/or able to be channeled. Coherent with the challenge of turning infrastructure into an asset class, the demand for financing (funds) includes the physical opportunities for investments as well as financial opportunities.
Demand and supply must be understood in a context. The market environment is key to attract capital to infrastructure. Such environment encompasses not only sectoral regulation, but also cap-ital market regulation and competition policy. Lastly, knowledge of the underlying market design is essential to understand the regulatory framework.
The Brazilian power sector legal and regulatory framework foundations were laid down by the reform enacted in 2004 (Law 10,848/2004) that established two contracting environments: (a) in the regulated environment, distribution companies (DISCOs) contract the electric energy re-quired to supply their users’ needs; and (b) in turn, in the free market, large consumers may
exercise their right to choose their own suppliers. DISCOs’ contracting of bulk energy in the regu-lated environment take place through a series of auctions of electricity contracts. Potential suppli-ers compete for long-term contracts—power purchase agreements (PPAs), called Contratos de Comercialização de Energia no Ambiente Regulado (CCEARs).
After the 2004 reform, the bulk of the expansion in generation capacity comprised power plants contracted in the regulated environment financed through funds provided by the Brazilian Na-tional Bank for Economic and Social NaNa-tional Development (BNDES). The BNDES’s dominant posi-tion in the financing of infrastructure defined and to a certain extent determined the contracting structures in the power sector. Some trends support this argument, such as (a) increasing the length of CCEARs,1 (b) few examples of limited-recourse financing of power plants willing to negotiate
contracts with free consumers, and (c) few examples of investments financed by the private/com-mercial banking system.
Even though the model launched in 2004 was successful in financing the construction of several power plants and grid expansion by the private sector, the current needs to address the higher budget deficit constrains the government’s ability to transfer a significant amount of funds re-quired to deliver infrastructure investments through the BNDES. This scenario shares some common-alities with the global challenges to expand infrastructure investments.
Considering the difficulties to support investments in infrastructure under the previous model (public funds channeled through the BNDES), this paper investigates alternatives for long-term financing in Brazil. The analysis is based on the experience of the Brazilian electricity industry and structures implemented in other countries around the world. The major challenge is to turn infrastructure investments into an asset class, a topic that is at the top of the agenda in Brazil as well as in other middle-income and developed economies.
1 For the sake of illustration, contracts for thermal power plants were auctioned for 15 years, 20 years, and 25 years in
2. The Approach
The proposed approach to address the challenge of long-term financing is to investigate the supply and demand of funding sources and the needs in the market for energy assets, given that
(a) The supply side consists of capital that can be channeled;
(b) Consistent with the challenge of turning infrastructure into an asset class, the demand for financing includes both physical opportunities for investments as well as financial opportunities; and
(c) The demand and supply of capital should be understood in a contextualized market. Hence, a proper environment must provide the conditions to attract capital to infra-structure. Such environment comprises not only sectoral regulation, but also capital mar-ket regulation, competition policy, and marmar-ket design.
The following chapters describe this strategy, taking advantage of some good experiences around the world and based on evidence from the financial economics literature.
FIGURE 1. LONG-TERM FINANCING FRAMEWORK IN BRAZIL
Source: Fundação Getulio Vargas Centro de Estudos em Regulação e Infraestrutura (FGV CERI).
Note: BACEN = Brazilian Central Bank; IPP = Independent Power Producer; LDC = Local Distribution Company; LNG = Liquefied Natural Gas. Federal Budget BNDES Savings Banks Commercial Loans Institutional Investors Private Equity Individual Investors International Investors Tenor, size & liquidity by type of source Risk perception – sources of capital Sources of Capital Supply STATUS OF CURRENT FINANCING Physical Opportunity for Investments Financial Opportunity to invest FEATURES OF MARKETS
Critical Regulations and Regulatory Bodies Energy Commodities Interests & Currency Exchanges & BACEN Markets Derivatives Commodities Network Large Hydro Gas IPP Renewable Energy Electricity Transmission Electricity LDC Gas Pipelines International Pipelines Gas LDC LNG Import Outlets Tenor, size and liquidity
by type of business Treasury Notes Savings Accounts Listed Companies Corporate Bonds Debentures
Tenor, size and liquidity by type of opportunity Risk mitigation – Oppotunities to Invest
3. The Current Brazilian Environment
In Brazil, historical difficulties compound the lack of long-term financing. The analysis of these hurdles can be classified in two categories.
1. MACROECONOMIC AND FISCAL CONSTRAINT CHALLENGES
1.1. Term structure of interest rates. There is no market reference for long-run interest rates with a duration compatible with infrastructure projects. The Brazilian interest rate curve is characterized by a high level of short-term rates and upward sloping format—long-term rates do not have sufficient liquidity and short-term rates are very high, competing with other investments or assets, including infrastructure.
1.2. High short-term interest rates for Brazilian government debt lead savers to channel resources to these securities. Banks and pension funds, for example, invest massively in Brazilian Treasuries and have negligible participation in financing long-term assets or infra-structure. Because Brazil has not developed a secondary market for private or corporate bonds, savers have concentrated resources in government debt, which offers a profitable and much more liquid secondary market.
To address these issues, a large fiscal adjustment is necessary, that includes reforms able to de-crease and stabilize the growth of government debt in Brazil and, therefore, reduce short-term interest rates. These reforms include a proper assessment of social security funding, current ex-penses, and privatization of selected state-owned firms. Additionally, it would allow Brazil to raise funds at lower rates and longer terms, channeling resources to assets related to infrastruc-ture, similar to the experience in more developed countries.
2. SECTORAL DIFFICULTIES STEMMING FROM THE RISK ALLOCATION AND/OR COMPETITIVE BIDDING PROCESS, REGULATORY FRAMEWORK, AND THE DURATION OF INFRASTRUCTURE PROJECTS AND CONCESSIONS IN BRAZIL
2.1. Both the risk allocation design and the attribution process in Brazil need to improve considerably to induce better risk sharing between public and private parties. Policy makers and private firms could take advantage of risk management tools, including more advanced valuation methods, the use of real options approach, and simulation as well as more robust risk matrices. Recent auctions have not been able to prevent high-risk competi-tors from winning, often causing delays in projects, dropouts, and renegotiations. For exam-ple, the company that managed to contract the highest amount of electric power (to build thermal power plants) in the auction held in September 2008 defaulted on most of these contracts. Additionally, high-risk projects attract less interest and competition.
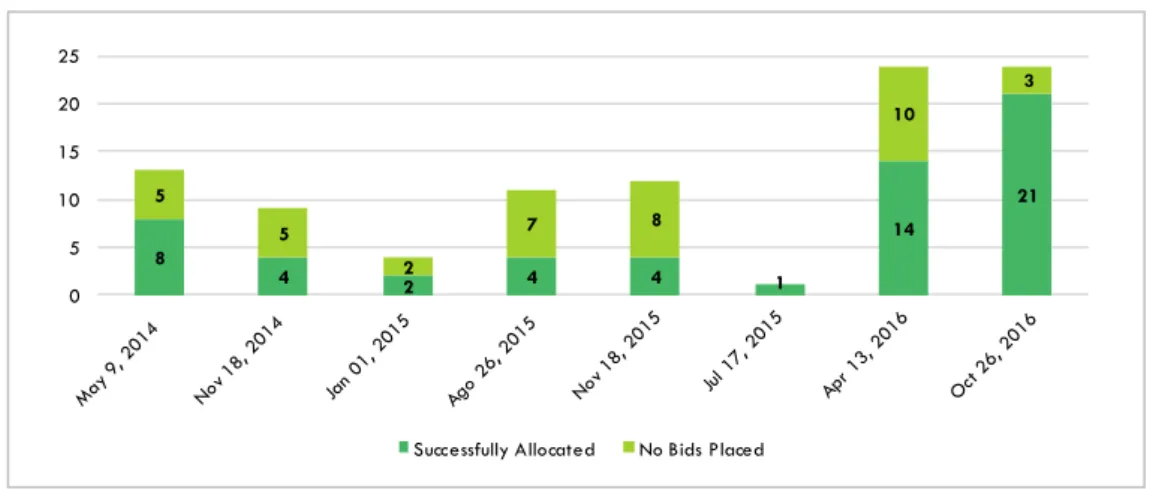
2.2. In several competitive bidding processes, the government privileged lower prices and tariffs, compromising the investors’ ability to earn returns consistent with the cost of capital of private funding. For example, several transmission and generation auctions have not been successful in attracting investors willing and able to credibly commit to the
obligations inherent to the concession contracts (Figure 2). As a result, the winners were less-qualified competitors—riskier and in many cases unable to comply with the agreements. FIGURE 2. COMPETITION IN RECENT TRANSMISSION AUCTIONS (NUMBER OF ITEMS)
Source: BM&FBovespa,2 elaborated by FGV CERI.
2.3. In general, Brazil’s concession contracts extend for 20–30 years. This extended du-ration is not compatible with the current term structure of interest rates. Considering the lack of market reference for a long-term risk-free rate, it is worth exploring the shortening of the duration of concessions, at least for projects of restricted social and environmental impact. In addition, there is no mandatory link between the duration of the concession and the du-ration of the financing.
Alternatives should be explored to tackle these issues, including the use of a duration rolling approach: after a short time (10 years, for example), the concession may be extended or termi-nated. It is possible to take the duration of the most liquid Brazilian Treasury bond in the domestic market (NTN-B of the National Treasury Notes [NTNs]) as reference or include mechanisms such as concessions with endogenous or flexible extension.3
3. MAJOR PLAYERS/ACTORS IN INFRASTRUCTURE FINANCING IN BRAZIL
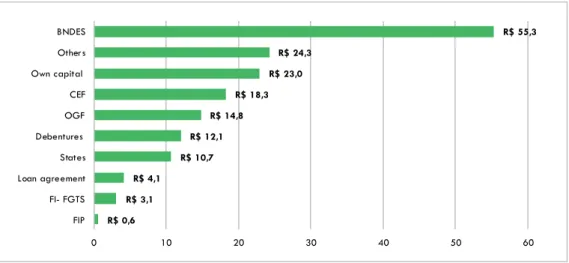
The BNDES has been the most important financier of infrastructure in the country in recent decades (Figure 3). It is the major source of long-term financing, and provides funding indexed to the Long-term Interest Rate (TJLP).4 This rate is lower than regular rates from commercial banks. The
prev-alence of public financing of infrastructure in Brazil is not specific to the power sector. The same pattern is observed in sectors like water and transport (Figure 5).
2 Data available at: http://www.bmfbovespa.com.br/pt_br/servicos/leiloes/acompanhamento/
3 Recent experiences of this sort are the least present value revenue auction. Such mechanisms have been adopted with
relative success in countries like Chile and the United Kingdom.
4 The TJLP depends on historical inflation, expected inflation, and country risk premium. The methodology is updated
every year by the BNDES. For details, see (in Portuguese): http://www.bndes.gov.br/SiteBNDES/export/sites/de-fault/bndes_pt/Galerias/Arquivos/produtos/download/tjlp.pdf. 8 4 2 4 4 1 14 21 5 5 2 7 8 10 3 0 5 10 15 20 25
FIGURE 3. SOURCES OF FUNDS FOR INVESTMENTS IN INFRASTRUCTURE (BRL, BILLIONS) – 2014
Source: Report of National Confederation of Industry (CNI) (2016)
Note: CEF = Caixa Econômica Federal; FI-FGTS = Guarantee Fund for Time of Service´s Investment Fund; FIP = Fundo
de investimento em participações; OGF = Oil and Gas Facilities.
Currently, the BNDES records a liability in the balance sheet of R$935 billion (approximately US$3,000 billion, based on the exchange rate on August 31, 2017, 3.2397 per U.S. dollar). Within the BNDES’s capital structure, the governmental share of sources accounts for 88 percent of the bank’s obligations. Until 2009, the Workers’ Support Fund (FAT) had been the most relevant source of funding for the BNDES, with R$119 billion (Figure 4). The FAT is linked to the Ministry of Labor and Employment (MTE) whose purpose is to fund the Unemployment Insurance Program and the Salary Bonus Program. Additionally, it plays a role of a development fund, because at least 40 percent of its resources are channeled to finance economic development programs operated by the BNDES. In the absence of a clause that sets a deadline for the principal repayment, the BNDES started to use the compensation funds to release new disbursements. After 2009, the funding situa-tion changed dramatically regarding the bank’s growth, when the Nasitua-tional Treasury assumed the role of the BNDES’s main creditor in 2009. The funding amounts held by the Treasury in June 2016 corresponded to R$525 billion (56 percent of the bonds) with impacts on public debt.
FIGURE 4. BNDES - REVENUE SOURCES (BRL, BILLIONS)
R$ 0,6 R$ 3,1 R$ 4,1 R$ 10,7 R$ 12,1 R$ 14,8 R$ 18,3 R$ 23,0 R$ 24,3 R$ 55,3 0 10 20 30 40 50 60 FIP FI- FGTS Loan agreement States Debentures OGF CEF Own capital Other s BNDES 1000 900 800 700 600 500 400 300 200 100 0 2002 2003 2004 2005 2006 2007 2008 2009 2010 2011 2012 2013 2014 2015 2016
National Treasury PIS-PASEP
Other payables
FAT Bonds and Loans Multilateral Instituitions
Source: BNDES, elaborated by FGV CERI.
Note: Data are reported in June of each year; PIS-PASEP = Programa de Integração Social - Programa de Formação
do Patrimônio do Servidor Público.
The bank’s disbursements in infrastructure increased significantly after 2003, going from US$938 million5 to US$11.2 billion6 in 20147 (Figure 5).
The BNDES has channeled resources to finance the bulk of the investments in the power system expansion under the new institutional model (2003–2004). However, the critical fiscal situation of the country requires searching for additional sources of funds or funding the energy sector could be jeopardized.
FIGURE 5. BNDES DISBURSEMENTS IN INFRASTRUCTURE (BRL, BILLIONS)
Source: BNDES, elaborated by FGV CERI.
Note: * Until November 2016; ¹ Land, waterway, and air.
In addition to the BNDES, Caixa Econômica Federal (CEF), a federally owned savings bank, also has a very important role in supporting infrastructure investment in the country. In 2014, it allo-cated R$18.3 billion to fund infrastructure projects. The CEF funds were predominantly channeled to transportation (R$10.2 billion) and sanitation (R$8.1 billion). Therefore, the BNDES and CEF
5 It is equivalent to R$2.71 billion, based on the exchange rate on December 31, 2003 (R$2.8884 per U.S. dollar) as
released by Ipeadata.
6 It is equivalent to R$29.9 billion, based on the exchange rate on December 31, 2014 (R$2.6556 per U.S. dollar) as
released by Ipeadata.
7 To illustrate the dimension of these disbursements in U.S. dollars, the annual average exchange rates (R$/US$)
an-nounced by the Central Bank of Brazil were 1.7412 in 2009, 1.6662 in 2010, 1.8758 in 2007, 2.0435 in 2012, and 2.3426 in 2013. However, it is important to keep in mind that, because the disbursements are made in reais, the calcu-lation of the respective values in U.S. dollars does not reflect the original trajectory of disbursements throughout the years. Several reasons, such as the recent economic downturn and corruption scandals involving major construction com-panies, led to a decrease in the BNDES’s financial transactions. As a result, in 2015, the conditions for long-term funds became more stringent for both existing and new concession contracts.
R$ 70 R$ 60 R$ 50 R$ 40 R$ 30 R$ 20 R$ 10 R$ 0 2000 2001 2002 2003 2004 2005 2006 2007 2008 2009 2010 2011 2012 2013 2014 2015 2016* TOTAL 2005: R$ 52 billion
together account for 62 percent of the total investments in infrastructure (R$115.5 billion) in Brazil in 2014. The contribution of commercial banks’ allocation of resources to investments in infrastruc-ture in Brazil is less significant. Such entities focus on short-term transactions, bridge loans, or those not covered by the BNDES and CEF.8
Investment funds are financial intermediaries for a wide range of investors, either individuals or legal entities. In Brazil, pension funds experienced growth in net asset value of approximately 214 percent in the last decade, reaching R$3 trillion in June 2016. As shown in Figure 6, investment funds concentrate their capital in securities issued by the federal government (46 percent), which offer acceptable rates and increased liquidity. Despite the existence of more profitable invest-ment products in the market, such as bonds/debentures or equities, the allocation of resources in assets is not sufficiently diversified.
FIGURE 6. INVESTMENT FUNDS: NET ASSET VALUE (JUNE 2016)¹
Source: Associação Brasileira das Entidades dos Mercados Financeiro e de Capitais (ANBIMA), elaborated by FGV
CERI.
Note: ¹ Value in BRL, millions; CCB = Cédula de Crédito Bancário; CCCB = Certificado de Cédula de Crédito Bancário;
CDB = Bank Certificates of Deposit; DGPE = Depósito a Prazo com Garantia Especial; RDB = Bank Receipts of Deposit.
8 National Confederation of Industry Report (2016) - See more at:
http://arquivos.portaldaindustria.com.br/app/con-teudo_18/2016/07/18/11404/1807-EstudoFinanciamentodoInvestimentoemInfraestrutura.pdf CDB/RDB R$71.040,4 | 2% Commercial Papers R$280,3 | 0% Debentures R$81.496,1 | 3% Credit Rights R$40.784,5 | 1% DPGE R$8.770,1 | 0% CCB / CCCB R$1.684,4 | 0%
Real Estate Bonds R$58.778,9 | 2%
Financial Bills
R$326.371,9 | 11%
Federal Government Bonds
R$ 1.390.780,7 | 46%
Foreign Investments
R$ 21.778,2 | 1%
Other Fixed Income Securities
R$40.674,6 | 1% Stocks 250.982,8 | 8% Options R$(12.103,9) | 0% Other Equities R$ 15.226,2 | 1%
Repo - Backed by Federal Government Bonds
R$ 669.440,4 | 22%
Repo - Backed by State,
Municipal and Corporate Bonds
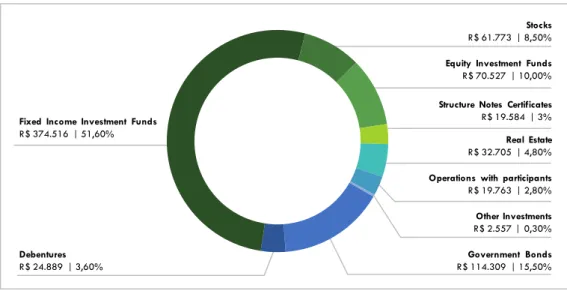
Brazilian pension funds can also play a valuable role as inducers of infrastructure financing. Figure 7 shows that more than 50 percent of pension fund resources were allocated to fixed-income invest-ment funds (R$374 billion) in 2015 and 15.5 percent were directly invested in governinvest-ment bonds. It is worth mentioning that the government’s pension funds have different regimes than private pen-sion funds. In contrast to the Brazilian Social Insurance System (the government´s penpen-sion fund) in which contemporary workers’ contributions are used to pay for the previous generation’s pensions and benefits conceded, private pension funds collect regular payments from employers and form a fund that needs to be invested to provide retirement income for the contributor.
Similar to pension funds and investment funds, Brazilian insurance companies also concentrate their investments in fixed-income assets. These assets represented 68 percent of insurance companies’ equity, valued at R$67,961.7 million in 2015.
FIGURE 7. PORTFOLIO ALLOCATION OF PENSION FUNDS (2015)
Source: Brazilian National Association of Pension Funds (ABRAPP), elaborated by FGV CERI. Note: Values in BRL million.
FIGURE 8. PORTFOLIO ALLOCATION OF INSURERS (SEPTEMBER 2015)
Source: ANBIMA, elaborated by FGV CERI.
Note: DI = Interbank Deposit; FIDC = Fundo de Investimento em Direitos Creditórios.
Stocks
R$ 61.773 | 8,50%
Equity Investment Funds
R$ 70.527 | 10,00%
Structure Notes Certificates
R$ 19.584 | 3%
Real Estate
R$ 32.705 | 4,80%
Operations with participants
R$ 19.763 | 2,80% Other Investments R$ 2.557 | 0,30% Government Bonds R$ 114.309 | 15,50% Debentures R$ 24.889 | 3,60%
Fixed Income Investment Funds
R$ 374.516 | 51,60% Hedge Funds | 4,2% Currency | 0,3% Stock | 0,5% Pension Funds | 15,3% FIDC | 0,1% Real Estate | 0,0% Partnership | 0,0% Short-term | 7,4% Referenced DI Funds | 4,2% Fixed Income | 67,9%
4. Sources of Capital (Supply Side)
The level of infrastructure investments in Brazil varied over the last 40 years as a percentage of the GDP. More recently, it is observed that there is room for significant increase in investments, as shown in Figure 9.
FIGURE 9. INFRASTRUCTURE INVESTMENTS IN BRAZIL BY SECTOR (AS A PERCENTAGE OF GDP)
Source: Report of CNI (2016).
In the early 1970s, Brazil experienced high economic growth and significant increase in demand for basic services, such as transportation and electricity. In this context, the federal government supported interventions in public institutions to promote the development of infrastructure sectors. This stimulus resulted in more state-owned companies and the predominant engagement of public resources in network industries. In 1973, state-owned companies invested 4.4 percent of GDP in fixed capital. In the 1980s and 1990s, the economy experienced a severe fiscal crisis. The gov-ernment’s response was to cut spending, lowering investments in state-owned enterprises. In addi-tion, the companies’ own resources lost generation capacity after the promulgation of the 1988 Constitution, which established new rules for the allocation of revenue from the public sector. Given this situation, private investments were perceived as an alternative to fill the gaps left by the public sector. Thus, in the early 1990s, the government conducted a series of privatization processes resulting in public investments in infrastructure decreasing to 2 percent of GDP. Even after the economic stabilization in 1994, public companies never returned to the level of invest-ments observed during the 1970s.
2,0 1,5 0,63 0,63 0,89 2,1 1,5 0,76 0,62 0,7 0,8 0,4 0,73 0,69 0,48 0,5 0,2 0,15 0,18 0,19 1971 |1980 1981 |1990 1991 |2000 2001 |2010 2011 |2014
FIGURE 10. INFRASTRUCTURE INVESTMENTS IN BRAZIL (AS A PERCENTAGE OF GDP)
Source: Frischtak (2008)9 and report of CNI (2016).
Note: ¹ State-owned enterprises and state and local authorities.
Even though public spending in infrastructure decreased and never returned to the 1970s level, the private sector did not increase its participation. As described in section 2, the participation of private companies decreased by 29 percentage points since 2007. There is a concentration of government funds either directly or allocated through the BNDES (FAT) and CEF (FGTS).10 In this
case, some reallocation of funds could be considered. Some initiatives have already been carried out, allowing part of the FGTS sources to be invested in shares of state-owned companies such as Petrobras and Vale—a similar mechanism could channel these funds to infrastructure assets, ac-cording to savers’ decisions. The next topics highlight the main features regarding alternatives to government supply of funds.
4.1. Bank Financing
In Brazil, commercial banking resources devoted to infrastructure projects are residual. In spite of efforts that could potentially improve this scenario, due to better perspectives concerning macro-economic constraints, it is important to describe and evaluate the effects that emerge from changes in prudential regulation—the current state of the Basel Accord and Basel III implementation in Brazil and its expectations. Brazil introduced Basel III in 2013. The target is to have the new regulations fully implemented by 2022, according to the Central Bank of Brazil. The National Monetary Council (CMN) and the Central Bank released the first set of regulations implemented under the new agreement in Brazil in March 2013. They established the new structure of regula-tory capital and the new standards for capital calculation. In the first quarter of 2015, under the
9 Frischtak, C. (2008). “O Investimento em Infraestrutura no Brasil: histórico recente e perspectivas”. IPEA, PPE - Pesquisa
e Planejamento Econômico, vol.38, No. 2. See more at: http://horia.com.br/sites/default/files/documentos/ipea-_histo-rico_da_infraestrutura_no_brasil.pdf.
10 FGTS is the ‘Guarantee Fund for Time of Service’, a severance indemnity fund for workers. Companies must pay 8
percent of monthly pay into an account held in the name of the employee at CEF. The balance is only available upon dismissal without cause, retirement, and in certain other situations (for example, to finance the purchase of housing).
0,4 0,3 0,1 0,2 0,2 0,3 0,3 0,3 0,4 0,4 0,4 0,3 0,3 0,3 0,7 0,8 0,7 0,6 0,7 0,8 0,7 0,7 0,9 0,8 0,7 0,7 0,9 0,8 2,2 1,2 0,9 1,1 1,1 1,0 1,0 1,4 1,0 1,0 1,1 1,3 1,2 1,2 2001 2003 2003 2004 2005 2006 2007 2008 2009 2010 2011 2012 2013 2014 Federal G overnment Public Com panies1 PrivateCompanies
schedule proposed by Basel III, the Central Bank and CMN introduced provisions related to short-term liquidity and leverage ratio. In general, an increase is expected in capital requirements in a range between 10.5 percent and 13 percent for the Basel Index. These capital requirements should not be mistaken with the mandatory deposits—reserves required by the Central Bank for purposes of monetary policy and for macro financial stability. Mandatory deposits are particu-larly large in Brazil.
The argument in favor of high requirements for mandatory deposits is to avoid events similar to the bankruptcies that occurred in the country in the 1990s, before the Real Plan in 1994 (which finally managed to tame the rampant inflation of the previous decade). This proved successful in the wake of the 2008 global financial crisis. Even though decreasing to R$200 billion between September 2008 and March 2010, the current national reserves amount to approximately R$400 billion.11
TABLE 1. BASEL III CAPITAL REQUIREMENT SCHEDULE
Source: ANBIMA,12 elaborated by FGV CERI.
The Basel Index already sets a minimum level of 11 percent in Brazil. Larger numbers apply for institutions deemed systemically relevant, either globally or locally. The Central Bank intends to move this level to 9 percent by 2019. However, additional capital will be implemented for which, for some institutions, the total percentage may reach 15 percent.
11 See more details about compulsory deposits or reserves at
http://www4.bcb.gov.br/pec/gci/port/fo-cus/faq%2012-depósitos%20compulsórios.pdf.
12 See references at
http://www.anbima.com.br/data/files/15/04/7B/A1/F32D7510E7FCF875262C16A8/Perspec-tivas_20ANBIMA_20Basileia_20III_1_.pdf 2013 2014 2015 2016 2017 2018 2019 Regulatory Capital 8,0% 8,0% 8,0% 8,0% 8,0% 8,0% 8,0% Tier 1 Capital 4,5% 5,5% 6,0% 6,0% 6,0% 6,0% 6,0% Principal Capital 3,5% 4,0% 4,5% 4,5% 4,5% 4,5% 4,5% Capital Buffer - 0,625% 1,25% 2,5% 3,75% 4,375% 5,0%
Conservation Capital Buffer - - - 0,625% 1,25% 1,875% 2,5%
Countercyclical Capital Buffer - 0,625% 1,25% 1,875% 2,5% 2,5% 2,5%
Total Regulatory Capital +
Conservation Capital Buffer 8,0% 8,0% 8,0% 8,625% 9,25% 9,875% 10,5%
Total Capital + Conservation Capital Buffer + Countercyclical Capital Buffer
8,0% 8,625% 9,25% 10,5% 11,75% 12,375% 13,0%
Capital instruments no longer
TABLE 2. BASEL III CAPITAL REQUIREMENT SCHEDULE – DETAILED
Source: Central Bank of Brazil and ANBIMA,13 elaborated by FGV CERI.
It has become clear that capital availability (for all types of assets and investments) will be af-fected—moving not from 11 percent to 9 percent but from 11 percent to 15 percent by 2019. In the standardized approach adopted by most Brazilian banks, the calculation of the portion related to market and operational risks is virtually unchanged by Basel III. The main changes in the calculation of risk-weighted assets introduced by Basel III in Brazil involve credit risk, as can be seen in Table 1 and Table 2. Concerning credit risk, a capital provision is required related to adjustments in the credit quality of counterparties (credit valuation adjustment [CVA]) and expo-sure to central counterparties. There was also the recalibration of risk weighting factors of some exhibits—exposure to the BNDES began to be treated as sovereign, for example.
In fact, there are no direct changes in the treatment of project finance for capital requirement cal-culations for banks. The main implications for financing projects come from the need for additional capital due to CVA and constraints on long-term credit (particularly for tenures longer than 10 years) due to the implementation of the Net Stable Funding Ratio (NSFR) and Leverage Ratio (LR).
13 See http://www.anbima.com.br/informe_legislacao/2013_015.asp#tit2_5. 2013 2014 2015 2016 2017 2018 2019 Regulatory Capital 11,0% 11,0% 11,0% 9,875% 9,25% 8,625% 8,0% Tier 1 Capital 5,5% 5,5% 6,0% 6,0% 6,0% 6,0% 6,0% Principal Capital 4,5% 4,5% 4,5% 4,5% 4,5% 4,5% 4,5%
Additional Principal Capital (ACP) - - - [0,625%-1,25%] [1,25%-3%] [1,875%-4,75%] [2,5%-7%]
Conservation ACP - - - 0,625% 1,25% 1,875% 2,5%
Countercyclical ACP - - - 0,625% 1,25% 1,875% 2,5%
Systemic Importance ACP - - - - 0,5% 1,0% 2,0%
PR + Conservation 11,0% 11,0% 11,0% 10,5% 10,5% 10,5% 10,5%
PR + Conservation + Countercyclical 11,0% 11,0% 11,0% 11,125% 11,75% 12,375% 13,0%
PR + Conservation + Countercyclical
+ Systemic Importance 11,0% 11,0% 11,0% 11,125% 12,25% 13,375% 15,0%
Principal Capital + Conservation 4,5% 4,5% 4,5% 5,125% 5,75% 6,375% 7%
Principal Capital + Conservation +
Countercyclical 4,5% 4,5% 4,5% 5,75% 7% 8,25% 9,5%
Principal Capital + Conservation + Countercyclical + Systemic Importance
The NSFR, which will be implemented by 2018, measures the amount of long-term and stable resources employed by an institution related to the liquidity profiles of funded assets and the potential margin calls arising from commitments outside the balance sheet and other obligations.14
LR is the ratio between Tier 1 capital and gross exposure (including off-balance-sheet items). It was introduced to restrict excessive leverage of banks and thus the potential negative effects that a deleveraging process could pose to the financial system and to strengthen traditional capital requirements, based on a weighted risk measure, with a simple, unweighted measure to serve as a threshold for operation of banks.15
Following the advances in prudential regulation worldwide, the banking system in Brazil will prob-ably continue to undergo a process of capital adjustments. This movement will significantly limit the availability of long-term funding. This pattern/trend extends to the supply of funding for energy infrastructure.
In fact, in the long run, (commercial) banks will probably diminish longer-term financing of (highly) risky assets. To compensate for this movement, infrastructure assets in Brazil must be ‘derisked’ to take advantage of an environment in which there will be no (or scarce) credit for long-term in-vestments with high borrower risk. This process is essential to turn energy infrastructure in Brazil into an asset class.
Considering that even state-owned banks will have to adjust their capital requirements, alterna-tive roles can be assessed and assumed by public financial institutions such as the BNDES. In such context, it is advisable to investigate the possibility of such institutions acting as guarantors— similar to the role of other development institutions, including the Multilateral Investment Guaran-tee Agency (MIGA) of the World Bank Group.16
4.2. Non-bank Financing
Alternatives to financing through traditional banking markets could focus on the attraction of funds from institutional investors. Institutional investors include insurance companies, pension funds, and sovereign funds. To boost investment in infrastructure or energy assets from these firms, some regulatory changes or alternative/new market designs are needed. These aspects will be dis-cussed in chapter 7. It is important to consider some vehicles or financial products that can be implemented in Brazil to increase the attractiveness of infrastructure-related assets. The following sections describe attempts successfully adopted in other countries and the challenges involved.
14 See http://www.bis.org/publ/bcbs271.pdf.
15 See http://www.bis.org/publ/bcbs270.pdf and
http://portal.anbima.com.br/informacoes-tecnicas/estudos/ra-dar/Documents/201307_radar_anexo03.pdf.
4.3. Alternative Sources of Supply 4.3.1. Project Bonds
Project bonds markets were created in the 1990s as a source of capital for long-term infrastruc-ture projects in North America and involved institutional investors like pension funds and insurance companies. Canada constitutes the best example, considering that domestic banks in that country did not lend for projects longer than seven years and that credit for projects was based on resources from European banks. Due to the effects of the subprime crisis and considering the amount needed to finance public-private partnership (PPP) projects in procurement, bond markets became an alternative.
Nowadays, infrastructure bonds are also common in Australia, with recent issuances in airports (Perth) and roads (ConnectEast); the United Kingdom; the United States; and some emerging mar-kets. In Brazil, the government attempted a similar structure under Federal Law 12,431/2011— by which it regulated the issuance of infrastructure debentures in the country, mainly being used by special purpose vehicles (SPVs) involved in project management.17 This law also established
tax benefits for investors—interest payable is subject to withholding tax of 15 percent for resi-dent legal entities, no withholding tax is payable by individual resiresi-dents, and interest payable to foreign investors is free of withholding tax and Tax on Financial Operations (IOF).18
Data from the Brazilian Treasury show that since its beginning, the total volume of bonds issuance reached R$18,593 million. In turn, the amount of resources required by infrastructure projects corresponds to 13 times this amount.
There are two structures so far in Brazil, comprising securities issued with and without collateral. Securities with collateral are issued by firms that own projects in the construction phase, which are riskier than projects under operation. Securities without collateral are related to operational pro-jects that present a cash flow history and, therefore, less risk for investors (according to the BNDES, this type corresponds to 75 percent of the total amount issued).
This collateralization/credit support concerning the construction phase is relevant not only for the Brazilian case—it is considered a general improvement to all project/infrastructure bond/deben-ture markets and crucial to attract investors like pensions funds, which are not able to give up cash flows for such a long time (two years in some cases). So, typically, the projects are financed with bank debt (or the BNDES debt in the Brazilian case) during the construction phase. Access to the capital markets, or project or infrastructure bonds, would take place during the operational phase. This is a problem because infrastructure projects are capital-intensive during the early stages, and it is possible to identify a clear refinancing risk in this situation.
17 This product is also used by firms. On August 15, for example, Companhia de Transmissão de Energia Elétrica Paulista
(CTEEP) issued R$148 million in infrastructure bonds (debêntures de infraestrutura).
Therefore, there are no significant differences between the structure created for Brazilian infra-structure debentures and the project bonds that exist in other countries, in spite of the typical textbook concepts that define debentures as debt instruments that are not secured by physical assets or any kind of collateral. ‘Textbook’ debentures also have a more specific purpose than bonds and can be classified as ‘revenue bonds’ according to the situation. In this case, a situation that is common for municipalities (see next subsection), debentures or bonds are supported by the revenues of a specific project such as a highway or a stadium.
4.3.2. Municipal Governments
In the United States, local governments have issued municipal bonds to finance infrastructure for nearly two centuries. Such products are free of federal income tax. This tax-advantaged debt instrument, together with equity in the form of government grants and state and local expendi-tures, contributes to a lower cost of capital compared with private debt and equity. This market in the United States is the most developed in the world, reaching US$3.7 trillion, dispersed among 44,000 issuers. Apart from the effects of the financial crisis and the increasing fiscal pressures at all levels, such instruments have contributed to increase debt ratios19 in infrastructure projects.
Typically, this product has annual principal repayments, and the amortization schedules are struc-tured with equal annual principal and interest payments20 over the useful life of the asset
fi-nanced. The common structure also considers municipal and state requirements, rating agency credit standards, and tax exemptions to boost demand. We can compare this ‘asset structure’ with the typical arrangement performed at the municipal level, composed of taxes, fees, or charges to provide repayment for infrastructure projects.
The structure involving municipal bonds is similar to limited-recourse financing, because bond pay-ments are related to the projects’ cash flows; so, they are also ‘revenue’ bonds. The typical ar-rangement is a ‘balance sheet’ approach closer to common banking debt. In the Brazilian case, municipal bonds could be an alternative for funding projects whose ownership belongs to the cities, like sanitation, water services, and those related to energy efficiency. Regarding this situa-tion, there are many good examples abroad.21 However, municipalities in Brazil must comply with
federal regulations (mainly the rules of the Fiscal Responsibility Law22) that make arrangements
similar to those existing in the United States impractical. Issuing debt is allowed to municipal gov-ernments subject to the National Treasury authorization. The Rio de Janeiro municipal government, even considering the needs related to the Olympic Games, did not get this permission.
19 Debt ratio = Debt / equity considering projects’ capital structure. 20 Corporate bonds typically have single principal payment.
21 See for example
https://www.esmap.org/sites/esmap.org/files/DocumentLibrary/FINAL_MGN1-Municipal%20Fi-nancing_KS18-14_web.pdf.
22 For more details, see
4.3.3. Others
Some alternative options involve the structuring of specific investment funds for infrastructure. An existing vehicle in Brazil is the equity investment fund (fundo de investimento em participações, FIP), established in 2003 through Resolution 391 from the Brazilian Securities Commission (CVM). In 2007, Federal Law 11,47823 specifically created the infrastructure investment fund vehicle
(FIP-IE), aimed at financing projects in the energy, transportation, water, sanitation, and irrigation sectors. Investments can be used in the expansion and renovation of existing assets or projects that are under implementation. In general, the composition of existing portfolios in the market includes small hydroelectric plants, biomass plants, wind farms, and infrastructure equipment, as well as securities such as stocks and debentures of companies operating in the mentioned sectors. According to the latest statistics, there are 576 equity investment funds of all types registered with the CVM. The operation of each depends on prior registration with the entity, which also restricts who can invest and the amount of money that can be applied. These products sound attractive to investors. The pension funds of government-controlled companies have invested mas-sively; for example,24 the allocation of pension funds in mono-asset FIPs, funds that concentrate
resources in the acquisition, construction, and operation of a single asset, represent about 39 percent of the total allocation devoted to private equity within this industry, with the largest five pension funds, including Petros (Petrobras), Funcef (CEF), Postalis (Post Office), and Previ (Banco do Brasil) representing 32 percent of the total volume. This concentration has proved problematic. Due to possible political pressure in recent years, funds have invested in infrastructure FIPs that allocated resources to projects that never left the drawing board or were abandoned, requiring sizeable contributions of additional capital.25
5. Opportunities to Invest
Potential investors look for opportunities to invest in the financial products available (Treasuries, savings accounts, listed companies’ stocks, corporate bonds, or debentures), considering all the risks (and returns) involved, size and liquidity by type of opportunity, and risk mitigation mecha-nisms.
The ability to attract additional funds for investments in network assets and commodities in the power sector depends on the returns relative to financial assets’ earnings. Hence, it is important to develop or promote alternatives for investors, beyond Treasuries and saving accounts in Brazil. Considering the current fiscal difficulties and a probable new role of state-owned banks (BNDES, Banco do Brasil, and CEF), attracting private investors is critical to boost investments in the power
23 See http://www.planalto.gov.br/ccivil_03/_ato2007-2010/2007/Lei/L11478.htm. 24 See http://www.spectrainvest.com/Estudo_Alocacao_Fundos_de_Pensao.pdf.
25 See
sector. Hence, the challenge is to create conditions for demand growth in which investors will naturally channel money to capital markets—in this case, in corporate and project bonds. Creation of good products (such as infrastructure debentures) will not suffice. Market agents and governments can jointly develop an effective strategy to create new markets. This requires robust treatment regarding the demand side.
Successful examples of markets include the development of a secondary market for Treasuries in Brazil, as well as the ‘Tesouro Direto’,26 which targets retail investors. Other cases of success are
the development of a market for project bonds in Canada and Australia. Below, we present a brief assessment of both financial and physical opportunities available to investors.
5.1. Financial Opportunities to Invest
5.1.1. Treasury Notes
The internal public debt comprises bonds issued by the Brazilian National Treasury, available to all types of investors—institutional, asset managers, banks, or even ordinary people. Such assets belong to the fixed-income allocation class and have the most developed and liquid secondary market in Brazil, attracting not only long-term investors but also those that have alternative in-vestment strategies.
As established in Decree 3,859 of July 4, 2001, the National Treasury has a variety of instruments to meet the financing needs of the federal public debt. These instruments differ in some aspects, such as issue process (auction or direct issuance), indexation clauses, issuance terms, redemption forms, and interest rates, among others. Considering the securities issued in public offerings (auc-tions), the National Treasury issues two types of bonds according to the nature of cash flows that will be paid to/received by investors: fixed and floating. In the first case, the investor knows the cash flows that will be received at maturity or on coupon payment dates. However, in the second case, the remuneration of securities consists of two components: the interest rate agreed at the time of purchase of the security and the variation of some index or economic parameter like inflation, foreign exchange rate, or others.
TABLE 3. FEATURES OF GOVERNMENT SECURITIES
Source: National Treasury Secretariat of Brazil, elaborated by FGV CERI.
Note: IGP-DI = General Price Index - Internal Availability; IPCA = Extended Consumer Price Index; LFT = Letra
Finan-ceira do Tesouro; LTN = Letra do Tesouro Nacional; SELIC = Special System for Settlement and Custody. ¹ They are no longer issued in auctions, but some maturities still exist on the secondary market.
² Income is nominal, so inflation needs to be discounted to get real income. The SELIC rate is the benchmark rate, IPCA is the consumer price index, and IGP-DI is the general price index.
Table 3 shows the characteristics of the bonds offered at auctions. Brazil has two types of fixed bonds (LTN: National Treasury Bills and NTN-F: National Treasury Notes-Series F) and three types of floating-rate securities (NTN-B: National Treasury Notes-Series B, LFT: Treasury Bills indexed to the SELIC rate, and NTN-C: National Treasury Notes-Series C). In all cases, LTNs do not pay coupon interest and instead are redeemed in full on the maturity date. NTN-Fs are bonds with semiannual interest coupon payments and have a single principal flow of R$1,000 on maturity. NTN-Bs and NTN-Cs are floating-rate securities that pay semiannual coupons indexed to inflation. These bonds also carry a single principal flow of R$1,000.00 on maturity, indexed to inflation as well (IPCA for NTN-Bs and General Market Price Index [IGP-M] for NTN-Cs). LFTs pay no interest coupon and have only a principal payment on maturity indexed by the SELIC rate.
As mentioned, the government securities market in Brazil is widely developed and highly attractive to domestic and foreign investors. In addition to the aspects described above, one of the most attractive factors for these assets is related to the fact that their gains are benchmarked by the basic interest rate in Brazil (SELIC), which exceeds similar rates prevailing in the rest of the world. Thus, the amount of domestic federal debt was R$2,627,067 million, representing 48 percent of GDP in 2015. Before 20 years, this amount represented only 1 percent of GDP.
INDEX INCOME MATURITY(MAXIMUM) YIELD
PRINCIPAL PAID ON MATURITY
PREFIXED
Treasury fixed and bullet (LTN)
Fixed-rate securities
Contracted
interest rates 4 years
Only on the
maturity date R$1,000.00² Treasury fixed with
semiannual interest coupon (NTN-series F)
Fixed-rate securities
Contracted
interest rates 10 years
Biannual and on the maturity date
R$1,000.00²
POSTFIXED
Treasury IPCA (NTN-series B
Principal) IPCA
IPCA + contracted interest rates
40 years Only on the maturity date
R$1,000.00 (adjusted by the index) Treasury IPCA with semiannual
interest (NTN-series B) IPCA
IPCA + contracted interest rates 40 years Biannual and on the maturity date R$1,000.00 (adjusted by the index) NTN-series C¹ IGP-DI IGP-DI + contracted interest rates No longer issued R$1,000.00 (adjusted by the index)
Treasury SELIC (LFT) SELIC
SELIC + contracted interest rates
5 years Only on the maturity date
R$1,000.00 (adjusted by the index)
FIGURE 11. FEDERAL DOMESTIC PUBLIC DEBT (BRL, MILLIONS)
Source: National Treasury Secretariat of Brazil, elaborated by FGV CERI.
Note: LTN, LFT, and NTN-series C, B, F, and D. Position in December of each year; for 2016 June position (latest
availa-ble information).
From the perspective of federal securities, the composition of public debt reveals increasing par-ticipation of NTNs in the market since 2007. This trend was reversed in a scenario that persisted for more than 10 years, during which shorter maturity securities were predominant (LTNs and LFTs), as shown in Figure 12. Before 1998, the government bond market had low penetration, reflecting a period in which the Brazilian economy experienced inflation as high as 2,000 percent a year (up to the middle of 1994).
FIGURE 12. BRAZILIAN TREASURY SECURITIES (BRL, MILLIONS)
Source: Ipeadata, elaborated by FGV CERI.
NTN-Bs are real-income bonds with semiannual coupon payments—assets that allow reinvestments. However, the price of the securities varies according to inflation expectations. Therefore, if the in-vestor is not willing to wait until maturity, it can earn higher or lower yields than expected in the underlying operations. R$ 60.528 R$ 1.043.418 R$ 2.810.842 0 5000 00 1000 000 1500 000 2000 000 2500 000 3000 000 1995 1996 1997 1998 1999 2000 2001 2002 2003 2004 2005 2006 2007 2008 2009 2010 2011 2012 2013 2014 2015 2016 0 200.0 00 400.0 00 600.0 00 800.0 00 1.000 .000 1.200 .000 1.400 .000 LTN LFT NTN no v/ 9 1 ju n/ 9 2 ja n/ 9 3 a ug / 9 3 m a r/ 9 4 o ct / 9 4 m a y / 9 5 d e c/ 9 5 ju l/ 9 6 fe b / 9 7 se p / 9 7 apr / 9 8 no v/ 9 8 ju n/ 9 9 ja n/ 0 0 a ug / 0 0 m a r/ 0 1 o ct / 0 1 m a y / 0 2 d e c/ 0 2 ju l/ 0 3 fe b / 0 4 se p / 0 4 apr / 0 5 no v/ 0 5 ju n/ 0 6 ja n/ 0 7 a ug / 0 7 m a r/ 0 8 o ct / 0 8 m a y / 0 9 d e c/ 0 9 ju l/ 1 0 fe b / 1 1 se p / 1 1 apr / 1 2 no v/ 1 2 ju n/ 1 3 ja n/ 1 4 a ug / 1 4 m a r/ 1 5 o ct / 1 5 m a y / 1 6
Despite the attractiveness of longer-term securities, agents are still more interested in shorter-term fixed-income bonds—LNTs and NTN-Fs correspond to 41.6 percent of the amount of government debt in the market (R$1.09 trillion). NTN-Bs account for 30 percent of the government securities market (R$0.81 trillion), with 40 percent of these bonds being acquired by investment funds, prob-ably because they have greater incentive to maintain long-term assets with higher risk; in the case of LNTs and NTN-Fs, 39.4 percent of the bonds were bought by foreign investors (Figure 13). FIGURE 13. BRAZILIAN TREASURY SECURITIES (BRL, MILLIONS) - DECEMBER 2015
Source: ANBIMA, elaborated by FGV CERI.
Hence, among the Brazilian Treasury bonds, NTN-Bs are opportunities for long-term investment, being widely used by institutional investors like pension funds and insurance companies.
5.1.2. Listed Companies
The capital market plays a relevant role in a country’s economic development because it consti-tutes an efficient mechanism for allocating resources and gives another option for financing com-panies involved in infrastructure projects. Unfortunately, Brazil had a very underdeveloped stock market until recent years. The long period during which the economy faced high inflation rates and there was general economic instability exerted serious negative effects on the Brazilian stock market until the Real Plan (Plano Real) in 1994. Stimulated by economic and political stability, the Brazilian stock market initiated a general pattern of growth in 2003.
In spite of the growing stock market, the share of utility companies listed on the BM&FBovespa is not significant, the exception being in the electricity sector. Of the 584 currently listed companies, 71 are classified as public utilities, of which 62 are electric utilities, 7 are water supply and sanitation utilities, and only 2 are gas utilities. Hence, the public utilities sector represents no more than 13 percent of all listed companies traded on the BM&FBovespa.
It is also important to highlight some features related to the indices compiled by BM&FBovespa. The most relevant one is the Bovespa Index (Ibovespa), a broad index that is designed to track the stock market’s average performance through a hypothetical portfolio of the most actively traded and most representative stocks. Alternatively, the BM&FBovespa UTIL and the BM&FBovespa IEE are sector indices with the same purpose as the Ibovespa, respectively for companies in the public utilities sector in general (electric utilities, water supply and sanitation
39,5 18,7 23,7 27,9 19 39,4 11,7 13,4 4,7 0,1 1,5 NTN -B LTN e NTN-F
Indexed to IPCA Pref ixed
utilities, and gas utilities) and the electricity sector in particular. As might be expected, these two indexes have a large overlap of eligible stocks that can be used to build each portfolio. In fact, the most recent list of stocks eligible for BM&FBovespa UTIL and BM&FBovespa IEE shows that the former has 17 eligible stocks while the latter has 15, and all the companies are included in the BM&FBovespa UTIL list. In particular, only 8 out of these 17 stocks are eligible for the Ibovespa. Furthermore, only 23 listed companies in the public utilities sector are listed in the special corpo-rate governance segments of the BM&FBovespa. Known as Level 1, Level 2, and Novo Mercado, these special segments certify that the company follows specific rules related to board of directors structure, internal controls, transparency, delisting, and free float, among other aspects. From the investor’s perspective, companies complying with enhanced governance practices are more likely to obtain investments at a lower cost and a higher return.
5.1.3. Debt Instruments
Debentures and bonds are debt instruments that companies issue to raise capital beyond their normal cash flows. In theory, there are differences in how each of these instruments uses collateral, the circumstances under which each is issued, and other characteristics. However, in some econo-mies, there is only one of these instruments and the terms ‘debentures’ and ‘bonds’ are used to refer to this single instrument interchangeably.
Corporate bonds are financial instruments issued for a fixed period and pay interest during this period, known as ‘coupons’. The interest is paid at regular intervals so it will not accrue over time, while the principal amount is paid in the future on the maturity date. In general, bonds are secured by collateral; so, the bondholders can obtain at least partial satisfaction by seizing and selling the asset secured if the company fails to pay the debt. Bonds are not only issued by private companies, but also by governments and their firms. Those issued by private companies are known as corporate bonds.
A debenture is a debt instrument used for supplementing capital by the company. As happens with bonds, debentures also bear interest, which is paid at periodic intervals over the duration. Usually, debentures have a more specific purpose than bonds. Even though both are used to raise capital, debentures are typically issued to raise short-term capital for upcoming expenses or to pay for new expansions. Debentures are not asset-backed, because they are not secured by any collateral. Instead, they are only secured by the credit of the issuing company. In case of liquida-tion, bondholders are paid with priority over debenture holders. Sometimes, debentures or bonds are convertible into equity. In a sense, all debentures are bonds, but not all bonds are debentures. Whenever a bond is unsecured, it can be referred to as a debenture. In some markets, as in Brazil and India, for instance, the two terms are interchangeable, but in other economies like the United States, they refer to two distinct kinds of debt instruments.
In Brazil, debentures are the only securities classified as corporate bonds, and the debenture market is the market with the most significant growth rate within other financial securities available in the Brazilian market. The debenture market grew more than 400 percent from 2000 to 2013.
As illustrated in Figure 14, it reached a peak of more than R$70 billion in debentures offered in 2012. A reason for this high volume of offers in 2012 was Federal Law 12,431/2011, which created the infrastructure debentures mentioned in section 4.
FIGURE 14. TOTAL AMOUNT ISSUED IN DEBENTURES (BRL, BILLIONS)
Source: National Debenture System (SND), elaborated by FGV CERI.
Between 2000 and 2013, the largest buyers of debentures in Brazil were the financial institutions related to the issuing companies and investment funds, which acquired nearly 70 percent of the debentures issued during the period. Pension funds, foreign investors, and especially financial institutions with no connections with the issuing companies accounted for less than 10 percent. These numbers reflect the demand composition at the time of subscription. Because Brazil does not have a well-developed secondary market for debentures, it is reasonable to assume that such config-uration will not undergo significant changes until maturity.
Another issue is the market’s ability to accept long-term bonds. Despite the need for adequate financing of investments with long maturation period, debentures issued since 2000 have maturi-ties under six years on average. After the 2008 economic crisis, the average maturity fell even more, from six years to four years in 2009. Figure 15 illustrates the high concentration in securities with maturity shorter than five years.
FIGURE 15. DEBENTURES ISSUED BY MATURITY
Source: SND, elaborated by FGV CERI.
2000 2001 2002 2003 2004 2005 2006 2007 2008 2009 2010 2011 2012 2013 80 70 60 50 40 30 20 10 0 3,3% 14,7% 29,0% 18,9% 7,2% 8,3% 1,9% 16,6% 1-2 2-4 4-6 6-8 8-10 10-1 2 12-1 5 15+
5.2. Physical Opportunities to Invest
5.2.1. Networks as Investments and EVA Analysis
Assets in network industries like electricity transmission, electricity distribution, and gas pipelines have characteristics of natural monopolies, often subject to economic regulation. According to the economic literature,27 these features have financial implications, especially considering the
deci-sions that can be made by long-term investors. Such network assets are considered ‘cash cows’28—
investments that have a low growth in comparison with other sectors, but a higher market share (in this case the total).
These assets are able to grant or deliver a good and flat expected rate of return coupled with low risk, mainly as a result of regulation by independent agencies. In Brazil, however, these assets have not been able to attract long-term investors, as can be seen by recent results in transmission auctions, as well as the scarce competitiveness. The privatization auction of Celg Distribuição S.A. (CELG), the distribution company in the state of Goias, illustrates the challenges of investing in such assets. The first attempt to sell the control of CELG was not successful.29
Government interference in the sector (discussed in an accompanying paper) coupled with a frag-ile and adverse macroeconomic situation add to the perception of regulatory risk. Therefore, solving the regulatory risk question is crucial to make these assets attractive again.
A typical network asset (and generation, once completed and served by the networks) is valued as a perpetual growth investment, which provides a well-known revenue stream dur-ing its lifetime—in this case, the ‘Dividend Discounted Model’ or ‘Gordon Model’ is used for valuation:
𝑃0=
𝐷𝑃𝑆0(1 + 𝑔)
𝑘 − 𝑔 ,
where:
P0 is the estimated price per share;
DPS0 is the last dividend per share available and reported;
g is the perpetual growth rate; and k is the cost of capital for equity holders.
27 Further references can be found in corporate finance and investment valuation textbooks such as Investment Valuation
by Aswat Damodaran.
28 This expression was created by the Boston Consulting Group in 1970.
29 It is worth noting that recent results are more auspicious: the transmission auction and the privatization of CELG in the
second semester of 2016 are positive signs of increased attractiveness of power assets. However, both cases exhibit different underlying conditions relative to the former auctions.
Why is the Gordon Model good for utilities? Network (or generation) projects, once con-structed, demand less capital expenditures (capex) with respect to other types of businesses. In fact, on average, capex will offset depreciation because there is no need of additional capital for a higher growth path—the size of the market and the prices are defined by reg-ulation. Thus, most of the firm’s results are distributed to shareholders (dividends)—the capi-tal retention rate is usually low—and a flat cash flow can be expected over the concession’s lifetime. Unfortunately, this ‘textbook’ case, as mentioned, is not applicable considering the current situation of energy firms and assets in Brazil. A wide range of financial indicators re-lated to the firms are far short of the required and desired numbers. The regulator (Agência Nacional de Energia Elétrica, ANEEL) has researched the topic, combined with the practice of corporate finance applied to utilities.30 Further good evidence can be extracted from a
sim-ple economic value added (EVA) analysis. For a period of time and considering the amount of capital invested (K), we have
𝐸𝑉𝐴 = (𝑅𝑂𝐼𝐶 − 𝑊𝐴𝐶𝐶)×𝐾, where
ROIC is the return on invested capital (net profits/invested capital) and WACC is the weighted average cost of capital (effective).
Therefore, the difference between ROIC and WACC is only a measure of value creation for a firm, a sector, a project, or a business line. Below, we show the recent evolution of ROIC and WACC for electric energy distribution firms in Brazil. It is possible to see a gap, mean-ing ‘value destruction’, for assets that would otherwise be ‘cash cows’.
FIGURE 16. ROIC X WACC FOR DISTRIBUTION COMPANIES IN BRAZIL
Source: Economatica, elaborated by FGV CERI.
It is important to distinguish the WACC—the real cost of capital for firms on average—from the regulatory WACC set by ANEEL in the rate-making process. The evolution of this number is illus-trated in Table 4.
30 ANEEL has been implementing a corporate governance and financial monitoring program for energy firms in Brazil.
See http://www2.aneel.gov.br/aplicacoes/consulta_publica/documentos/Nota%20Técnica%202016%20067.pdf. 14% 12% 10% 8% 6% 4% 2% 0% 2009 2010 2011 2012 2013 WACC ROIC
TABLE 4. WACC EVOLUTION
Sources: ANEEL, elaborated by FGV CERI.
5.2.2. Benchmarking and Risk Assessment
This section presents an (re)assessment of risk management attitudes and mindsets in existing pro-ject finance practices, identifying current allocation patterns and future trends to attract new cap-ital, such as financial hedges, contract dollarization, and tracking accounts.
In this sense, a good benchmark is provided by the GIH initiative.31 The GIH maps risk allocation
for a set of relevant infrastructure projects, including those in the energy sector. Their approach proposes an allocation of the most relevant risks, identifying a proper risk allocation between public and private parties.
It is worth assessing to what extent the current practice in financing of projects in the Brazilian energy sector follows the identified risk allocation mapped by the GIH, keeping in mind that this initiative does not make recommendations—it only identifies best practices.
31 http://globalinfrastructurehub.org/
COMPONENTS 1ST RT CICLE 2ND RT CICLE 3RD RT CICLE 4TH RT CICLE
Cost of Equity (rCAPM) = rf+ β*(ERP)
+ rb+ rr+ rx
Risk Free Rate (rf) 6,01% 5,32% 4,87% 5,64%
Beta (β) 0,26 0,55 0,74 0,70 Regulatory Risk Premium (rr) = Δβ*(ERP) 3,33% 1,33% - -Market Risk Premium ERP = (rm- rf) 7,76% 6,09% 5,82% 7,56% Brazil Risk Premium (rb) = rs- rcb 4,08% 4,91% 4,25% 2,62% Currency Risk Premium (rx) 2,00% 1,78% -
-Nominal Cost of Equity (in US$) 17,47% 16,71% 13,43% 13,55%
US Consumer Price Index 2,40% 2,60% 2,45% 2,41%
Real Cost of Equity 14,72% 13,75% 10,72% 10,89%
Cost of Debt (rD) = rf+ rc+ rb+ rx
Risk Free Rate (rf) 6,01% 5,32% 4,87% 5,64%
Credit Risk Premium (rc) 3,67% 2,96% 2,14% 3,37% Brazil Risk Premium (rb) 4,08% 4,91% 4,25% 2,62% Currency Risk Premium (rx) 2,00% 1,78% -
-Nominal Cost of Debt (em US$) 15,76% 14,97% 11,26% 11,63%
US Consumer Price Index 2,40% 2,60% 2,45% 2,41%
Real Cost of Debt 13,05% 12,06% 8,60% 9,01%
WACC
Equity 50,00% 42,84% 45,00% 51,24%
Debt 50,00% 57,16% 55,00% 48,76%
Tax (t) 34,00% 34,00% 34,00% 34,00%
Nominal WACC (in US$) 13,93% 12,81% 10,13% 10,69%
US Consumer Price Index 2,40% 2,60% 2,45% 2,41%