Ana Luiza Braz PavãoI Cláudia Medina CoeliII Cláudia de Souza LopesIII Eduardo FaersteinIII
Guilherme Loureiro WerneckIII Dóra ChorIV
I Programa de Pós-Graduação em
Epidemiologia. Instituto de Medicina Social (IMS). Universidade do Estado do Rio de Janeiro (UERJ). Rio de Janeiro, RJ, Brasil II Instituto de Estudos em Saúde Coletiva.
Universidade Federal do Rio de Janeiro. Rio de Janeiro, RJ, Brasil
III IMS-UERJ. Rio de Janeiro, RJ, Brasil IV Escola Nacional de Saúde Pública.
Fundação Oswaldo Cruz. Rio de Janeiro, RJ, Brasil
Correspondence: Ana Luiza Braz Pavão Av. Lúcio Costa, 3360
Apto 303 bloco 01 – Barra da Tijuca 22630-010 Rio de Janeiro, RJ, Brasil E-mail: [email protected] Received: 12/1/2010
Approved: 9/15/2011
Article available from: www.scielo.br/rsp
Social determinants of the use
of health services among public
university workers
ABSTRACT
OBJECTIVE: To analyze the use of health services and socioeconomic status among public university workers.
METHODS: A cross-sectional study with 759 workers at a Brazilian public university who reported health-related restrictions of their usual activities in the previous 14 days, was carried out. Data were supplied by the 2001 cohort of the “Pró-Saúde Study” in Rio de Janeiro, Southeastern Brazil. Health services use was assessed with a proxy for “seeking health care” and according to the type of service. The presence of additional variation in morbidity was verifi ed by time restriction. Schooling, income and occupation markers were analyzed, and crude and adjusted proportion ratios of use and types of service were calculated.
RESULTS: The occupation level was the indicator of the greatest inequality in health services use. After adjustments for gender, age and the other socioeconomic status markers, the ratio of the proportion of health care use was 1.31 for manual workers (95%CI: 1.11;1.55) and 1.21 for non-manual workers (95%CI: 1.06;1.37) compared to the reference category of professionals.
CONCLUSIONS: A pattern of social inequality was identifi ed in health services use. Even after an adjustment for health need, the pattern favored individuals with lower socioeconomic status, particularly for the occupation marker. Remaining differences in individual morbidities do not explain this
fi nding. Rather, occupational factors may exert a greater infl uence on health services use in this population.
DESCRIPTORS: Health Services, utilization. Health Services Accessibility. Socioeconomic Factors. Health Inequalities. Cross-Sectional Studies.
INTRODUCTION
The use of health services is a complex behavior that is determined by a variety of factors.5 The relationship between use and its determinants can be
better understood with explicative theoretical models. According to the widely employed Behavioral Model developed by Andersen, health services use is a function of predisposing, enabling and need factors in health. Predisposing factors are related to the susceptibility of individuals to use health services, which include demographic characteristics and schooling. Enabling factors are related to health services access, which include income and health insurance. Need factors, which are the most proximate determinants of use, correspond to the health of the individual.1
occupation, rather than or in addition to demographic characteristics and the individual health needs.1,9,13
The effects of such markers might vary according to the local context of types of services and facilities.11,a,b
Studies assessing social inequalities in health services use can guide the formulation of policies that are focused on maintaining the health of the individual. However, there are few such studies that target popu-lations of workers. In a literature review, no Brazilian studies were found that assessed specifi c populations of workers, and only one such study was found in the inter-national literature.3 This study assessed health services
use by SES status (schooling, income and occupation) among workers at a public university.
METHODS
This cross-sectional study uses data from phase 2 of
the Pró-Saúde Study (2001), a cohort of
technical-administrative staff at a public university in the State of Rio de Janeiro (Southeastern Brazil), to investigate the social determinants of the use of health services. Three data collection phases were performed in 1999, 2001 and 2006.6
The source population consisted of 3,574 individuals (83% of the eligible population) who reported health-related restrictions of their usual activities in the two weeks prior to the investigation. Participants were asked the following question:
“During the last two weeks, were you prevented from conducting any of your usual activities (for instance, working, studying or performing household chores) due to a health problem you had or still have?”
A total of 812 individuals reported having been prevented from performing their usual activities due to health reasons. Participants were excluded from the research if they failed to provide data on schooling, income, occupation, age or type of health services sought. Individuals older than 70 years old were also excluded. The fi nal sample included 759 individuals. Health need is a proximate factor for services use and must be taken into account in studies on equity in services use.1,9 The control for health need was
established on the grounds of activity restriction: only participants who reported health-related restrictions of their usual activities within 14 days of the interview were included. Using the same questionnaire, a previous
a Instituto Brasileiro de Geografi a e Estatística. Pesquisa nacional por amostra de domicílios (PNAD). Um Panorama da Saúde no Brasil: acesso e utilização dos serviços, condições de saúde e fatores de risco e proteção à saúde 2008. Rio de Janeiro; 2010[cited 2010 Dec]. Available from: http://biblioteca.ibge.gov.br/visualizacao/monografi as/GEBIS%20-%20RJ/panorama.pdf
b Instituto Nacional do Câncer. Inquérito domiciliar sobre comportamentos de risco e morbidade referida de doenças e agravos não transmissíveis: 15 capitais e Distrito Federal, 2002-2003. Rio de Janeiro; 2004[cited 2010 Dec]. Available from: http://www.inca.gov.br/inquerito/docs/completa.pdf
c Moreno AB. Mobilidade ocupacional e qualidade de vida entre funcionários de uma universidade do Rio de Janeiro: o estudo pró-saúde [doctorate thesis]. Rio de Janeiro: Instituto de Medicina Social da UERJ: 2004.
study found substantial reliability for the Pró-Saúde
Study question on the discontinuance of usual activities (kappa = 0.73).10 The variable “restriction time” was
considered to be a proxy for the severity of the reason for the restriction, thus making it a proxy for health need. Restriction time was analyzed according to two categories – short leaves of absence (up to seven days) and long leaves of absence (between eight and 14 days) – to identify remaining variation in individual health states that could infl uence services use. A seven-day period was established as the cut-off to ensure consis-tency with previous studies on the same population and for statistical and operational reasons.7,10
“Health services seeking” was used as a proxy for health services use. Health services use was assessed dichotomously (yes/no). The types of health services that were assessed included hospital and medical offi ce visits (private or insured).
Socioeconomic status (SES) was assessed by completed schooling (up to completed elementary school, up to completed secondary school or completed college or more), income (up to three minimum wages [MWs], between three and six MWs or more than six MWs) and occupation markers based on the Erikson Goldthorpe Portocarero classification (manual workers, non-manual workers or professionals).c
The initial analysis was stratifi ed according to gender. However, because no significant differences were identifi ed between groups, the fi nal analysis included both genders. Proportions of services use, long leaves of absence and female gender were calculated according to SES strata and the corresponding confi dence inter-vals. A chi-square test was applied to the various SES markers to detect trends. A Kruskal-Wallis test was applied for comparisons across ages. Poisson models with robust variance were used to calculate proportion ratios (PRs) of services use according to SES strata markers.2 PRs for each SES marker were calculated
and adjusted for gender, age and the remainder of the SES markers. The analysis was performed with the statistical software STATA (version 9.1).
RESULTS
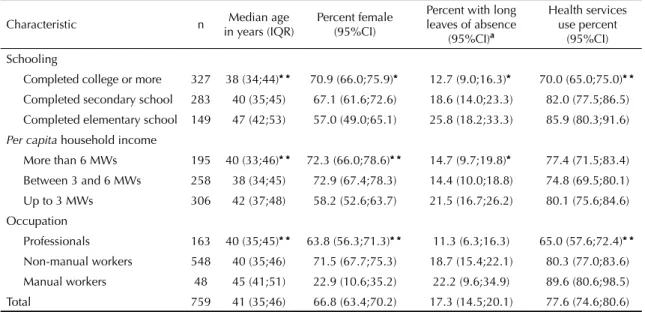
(interquartile range: 35-46 years old). Most participants reported having completed college or more (43%), had an income of less than three MWs (40%) and were non-manual workers (72%) (Table 1).
Higher schooling levels were associated with lower median ages (p < 0.001); the same pattern was identifi ed for income (p < 0.001). Professionals were signifi cantly younger than manual workers (p = 0.001). Signifi cant SES differences were observed in the proportion of women: higher schooling levels were associated with higher proportions of women (p = 0.004), and the lowest income stratum (less than three MWs) exhibited a lower proportion of women than did the strata of respondents who earned between three and six MWs and of respon-dents who earned more than six MWs (p < 0.001). There was a low proportion of working females with manual jobs, and there was a high proportion of female workers with non-manual jobs (p < 0.001) (Table1).
Higher schooling and income levels were associated with lower proportions of individuals who had taken leaves of absence between 8 and 14 days in length (p = 0.001 for schooling; p = 0.04 for income) (Table 1). Health services use was reported by 77.6% of respon-dents. Signifi cantly higher proportions of services use with a dose-response gradient were found in the lowest schooling level and among manual workers. The income variable did not reveal statistically signifi cant differ-ences. The occupation variable was the SES indicator that exhibited the greatest inequality in health services use. After adjusting for gender, age and the remainder
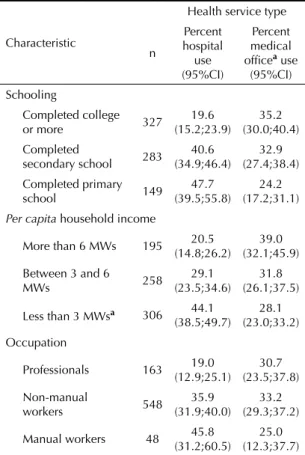
of the SES markers, the PR of use was 1.31 among manual workers (95%CI: 1.11;1.55) and 1.21 among non-manual workers (95%CI: 1.06;1.37) (Table 2). A progressive decrease in hospital seeking was observed with increases in schooling level and income. This trend was stronger in professionals than in non-manual workers, and the trend was weakest in non-manual workers. There was a tendency toward more medical offi ces seeking (private or insured) with increases in schooling, income and professional autonomy levels, with the exception of occupation (Table 3).
DISCUSSION
Individuals exhibiting the lowest SES markers, with the exception of income, exhibited higher health services use when their usual activities were restricted. This pattern persisted after adjustments for gender, age and the remainder of the SES markers. Occupation exhibited the steepest gradient in this population, and the highest services use level was observed among individuals in lower hierarchical positions.
Travassos et al14 (2006) performed a study assessing
equity in services use with data from the Pesquisa
Nacional por Amostra de Domicílios (PNAD – National
Survey by Residential Sample), in which restriction of usual activities during the prior 15 days was reported. The authors noted opposing results: services use was higher among wealthier and more highly educated participants. Our study did not include individuals
Table 1. Percent female schooling, income and occupation characteristics; proportion of long leaves of absence; and health services use among participants reporting health-related restrictions of usual activities. Pro-Saúde Study. State of Rio de Janeiro, Southeastern Brazil, 2001.
Characteristic n Median age
in years (IQR)
Percent female (95%CI)
Percent with long leaves of absence
(95%CI)a
Health services use percent
(95%CI) Schooling
Completed college or more 327 38 (34;44)* * 70.9 (66.0;75.9)* 12.7 (9.0;16.3)* 70.0 (65.0;75.0)* *
Completed secondary school 283 40 (35;45) 67.1 (61.6;72.6) 18.6 (14.0;23.3) 82.0 (77.5;86.5)
Completed elementary school 149 47 (42;53) 57.0 (49.0;65.1) 25.8 (18.2;33.3) 85.9 (80.3;91.6)
Per capita household income
More than 6 MWs 195 40 (33;46)* * 72.3 (66.0;78.6)* * 14.7 (9.7;19.8)* 77.4 (71.5;83.4)
Between 3 and 6 MWs 258 38 (34;45) 72.9 (67.4;78.3) 14.4 (10.0;18.8) 74.8 (69.5;80.1)
Up to 3 MWs 306 42 (37;48) 58.2 (52.6;63.7) 21.5 (16.7;26.2) 80.1 (75.6;84.6)
Occupation
Professionals 163 40 (35;45)* * 63.8 (56.3;71.3)* * 11.3 (6.3;16.3) 65.0 (57.6;72.4)* *
Non-manual workers 548 40 (35;46) 71.5 (67.7;75.3) 18.7 (15.4;22.1) 80.3 (77.0;83.6)
Manual workers 48 45 (41;51) 22.9 (10.6;35.2) 22.2 (9.6;34.9) 89.6 (80.6;98.5)
Total 759 41 (35;46) 66.8 (63.4;70.2) 17.3 (14.5;20.1) 77.6 (74.6;80.6)
IQR: interquartile range; MW: minimum wage
a 37 cases did not report data on restriction time
with extreme socioeconomic disadvantages, such as the unemployed, which might partially explain the confl icting fi ndings. A study assessing income inequali-ties in access in several countries (including Ireland and Belgium) showed a pattern of inequalities that favored poorer participants, even after an adjustment for need. These fi ndings might be explained by fi nancial features, such as co-payment exemption mechanisms and fee reductions for poorer individuals, that stimulated health services use in lower socioeconomic population strata.15
A study performed in England with a population compa-rable to the population evaluated in this study (civil servants) did not reveal differences in health services use according to occupational hierarchy status after adjusting for morbidity, which suggests equity in the pattern of use.3 The study based need on disease
symp-toms and the results of medical examinations, which might have ensured a better measurement of ongoing diseases. Moreover, that study was performed in a developed country, where differences in work relation-ships might exist; in England in particular, the universal health system is exclusively funded by the government and may favor higher equity in services use.
In this study, there were likely differences across SES levels in the severity of conditions that led to the restriction of usual activities. For example, the proportion of individuals with long leaves of absence was higher among those with less schooling and lower levels of income, and the proportion was higher among manual and non-manual workers than among professionals. This result suggests the occurrence of more severe diseases among the lower socioeconomic levels. Moreover, individuals with a lower SES more frequently used hospital services, whereas individuals
with a higher SES more frequently used medical offi ces, which reinforces the hypothesis of more severe condi-tions in the lower SES strata.
Table 3. Proportion of hospital and medical offi ce use (private
or insured) by schooling, income and occupation. Pro-Saúde
Study. State of Rio de Janeiro, Southeastern Brazil, 2001.
Characteristic
Health service type
n
Percent hospital use (95%CI)
Percent medical
offi cea use
(95%CI)
Schooling
Completed college
or more 327
19.6 (15.2;23.9)
35.2 (30.0;40.4) Completed
secondary school 283
40.6 (34.9;46.4)
32.9 (27.4;38.4) Completed primary
school 149
47.7 (39.5;55.8)
24.2 (17.2;31.1)
Per capita household income
More than 6 MWs 195 20.5
(14.8;26.2)
39.0 (32.1;45.9)
Between 3 and 6
MWs 258
29.1 (23.5;34.6)
31.8 (26.1;37.5)
Less than 3 MWsa 306 44.1
(38.5;49.7)
28.1 (23.0;33.2) Occupation
Professionals 163 19.0
(12.9;25.1)
30.7 (23.5;37.8)
Non-manual
workers 548
35.9 (31.9;40.0)
33.2 (29.3;37.2)
Manual workers 48 45.8
(31.2;60.5)
25.0 (12.3;37.7)
a Private or health insurance medical offi ce
MW: minimum wage
Table 2. Crude and adjusted proportion ratios of health services use by schooling, income and occupation. Pro-Saúde Study. State of Rio de Janeiro, Southeastern Brazil, 2001.
Characteristic Proportion ratio of use
Crude 95%CI Adjusteda 95%CI
Schooling
Completed college or more 1 _ 1 _
Completed secondary school 1.17 1.07;1.28 1.16 1.06;1.28
Completed elementary school 1.23 1.11;1.35 1.16 1.03;1.31
Per capita household income
More than 6 MWs 1 _ 1 _
Between 3 and 6 MWs 0.97 0.87;1.07 0.92 0.83;1.03
Less than 3 MWs 1.03 0.94;1.14 0.92 0.82;1.02
Occupation
Professionals 1 _ 1 _
Non-manual workers 1.23 1.10;1.40 1.21 1.06;1.37
Manual workers 1.38 1.19;1.60 1.31 1.11;1.55
a Adjustment for gender, age and other socioeconomic status markers
Due to the complex and dynamic nature of interactions in services use and its multiple determinants, which is made explicit in the Andersen model, specifi c occupa-tional characteristics might have exerted an infl uence on the pattern of use among individuals with a lower SES. The fact that occupation was the SES marker that exhibited the highest gradient suggests that differences in the work-relationship patterns might have infl uenced the variation in services use across occupational strata. The need to produce a medical certifi cate to justify work absences might particularly apply to workers with less
fl exible relationships with their bosses (manual and non-manual workers), which may lead to more services seeking. This pattern might not be the case for individ-uals with more fl exible work relationships. Moreover, the physical proximity of an individual to the university hospital potentially reduces service access barriers and could make this use behavior occur more frequently. The control mechanism applied (the analysis of indi-viduals who reported health-related reductions in usual activities) may have been insuffi cient to adjust for SES differences in health needs, which was evidenced by the variation in the proxy for severity need. Conversely, a statistical adjustment for “duration of activities restriction” would not be appropriate because it is an
intermediate variable between the exposure and the outcome, and its control in the regression model could bias the results.4,8 Even though the variables related
to services use and health needs were analyzed for the same period of time (the prior two weeks, which suggests acute morbidity) and the question on health services use was alluded to as the health reason that caused the restriction, there may have been a substan-tive correlation between them.12 A further issue concerns
the use of the proxy variable “services seeking” instead of “services use” to represent the construct of interest. Health services seeking may not represent the full dimension of services used. However, the satisfi ed demand index found in some Brazilian surveys suggests that services seeking sought provide an accurate repre-sentation of services used.9,13
1. Andersen RM. Revisiting the behavioral model and
access to medical care: does it matter? J Health Soc
Behav. 1995;36(1):1-10. DOI:10.2307/2137284
2. Barros AJD, Hirakata VN. Alternatives for logistic regression in cross-sectional studies: an empirical comparison of models that directly estimate the
prevalence ratio. BMC Med Res Methodol. 2003;3:21.
DOI:10.1186/1471-2288-3-21
3. Britton A, Shipley M, Marmot M, Hermingway H. Does access to cardiac investigation and treatment contribute to social and ethnic differences in coronary heart disease? Whitehall II prospective cohort
study. BMJ. 2004;329(7461):318-23. DOI:10.1136/
bmj.38156.690150.AE
4. Christenfeld NJS, Sloan RP, Carroll D, Greenland S. Risk factors, confounding, and the illusion of statistical
control. Psychosom Med. 2004;66(6):868-75.
DOI:10.1097/01.psy.0000140008.70959.41
5. Dever GEA. A epidemiologia na administração dos serviços de saúde. São Paulo: Pioneira;1988.
6. Faerstein E, Chor D, Lopes CS, Werneck GL. Estudo pró-saúde: características gerais e aspectos
metodológicos. Rev Bras Epidemiol. 2005;8(4):454-66.
DOI:10.1590/S1415-790X2005000400014
7. Godoffredo Filho GS, Faerstein E. Incapacidade para atividades habituais: relação com pressão
arterial e terapêutica anti-hipertensiva. Arq Bras
Cardiol. 2010;94(4):445-50. DOI:10.1590/S0066-782X2010005000011
8. Hernández-Díaz S, Schisterman EF, Hernán MA. The
birth weight “paradox” uncovered? Am J Epidemiol.
2006;164(11):1115-20.
9. Hulka BS, Wheat JR. Patterns of utilization – the
patient perspective. Med Care. 1985; 23(5):438-60.
DOI:10.1097/00005650-198505000-00009
10. Macedo LET, Chor D, Andreozzi V, Faerstein E, Werneck GL, Lopes CS. Estresse no trabalho e interrupção de atividades habituais, por problemas
de saúde, no estudo pró-saúde. Cad Saude Publica.
2007;23(10):2327-36. DOI:10.1590/S0102-311X2007001000008
11. Szwarcwald CL, Leal MC, Gouveia GC, Souza WV. Desigualdades sócio-econômicas em saúde no Brasil:
resultados da pesquisa mundial de saúde, 2003. Rev
Bras Saude Matern Infant. 2005;5(Supl 1):11-22. DOI:10.1590/S1519-38292005000500002
12. Travassos C, Viacava F, Pinheiro R, Brito A. Utilização dos serviços de saúde no Brasil: gênero,
características familiares e condição social. Rev
Panam Salud Publica. 2002; 11(5-6):365-73. DOI:S1020-49892002000500011
13. Travassos C, Martins M. Uma revisão sobre os conceitos de acesso e utilização de serviços de
saúde. Cad Saude Publica. 2004;20Supl 2:190-8.
DOI:10.1590/S0102-311X2004000800014
14. Travassos C, Oliveira EXG, Viacava F. Desigualdades geográfi cas e sociais no acesso aos serviços
de saúde no Brasil: 1998 e 2003. Cienc Saude
Coletiva. 2006;11(4): 975-86. DOI:10.1590/S1413-81232006000400019
15. Van Doorslaer E, Masseria C, Koolman X. Inequalities in access to medical care by income in developed
countries. CMAJ. 2006;174(2):177-80.DOI:10.1503/
cmaj.050584
REFERENCES
Paper based on Pavão ALB’s master’s dissertation presented to the Instituto de Medicina Social of Universidade do Estado do Rio de Janeiro in 2008.
Pavão ALB was supported by Brazilian Federal Agency for Support and Evaluation of Graduate Education (CAPES; master’s scholarship).