Parametric Study of a
Historical Masonry
Building Subjected to
Seismic Loading
Name: Enrique del Rey Castillo Email: [email protected]
Title of the Msc Dissertation:
Parametric study of a historical masonry building subjected to seismic loading.
Supervisor(s): Paulo B. Lourenço Year: 2011/2012
I hereby declare that all information in this document has been obtained and presented in accordance with academic rules and ethical conduct. I also declare that, as required by these rules and conduct, I have fully cited and referenced all material and results that are not original to this work.
I hereby declare that the MSc Consortium responsible for the Advanced Masters in Structural Analysis of Monuments and Historical Constructions is allowed to store and make available electronically the present MSc Dissertation.
University: Universidade do Minho Date: July 17th, 2012
Le quiero dedicar ésta tesis, fruto de varios meses de
duro trabajo, a mi familia, a mis amigos (esos que se
pueden contar con los dedos de una mano) y al azar, por
haber nacido donde he nacido y haberme criado bajo
las condiciones en que me he criado. Pero le quiero
agradecer especialmente a mis padres su apoyo
incondicional, siempre y a todos los niveles.
Earthquakes are one of the natural hazards that have caused more losses to the mankind. Besides countless human lives, earthquakes have destroyed buildings and even cities in many places and civilizations around the world. However, the nature and origin of earthquakes, as well as their effect in built structures, have been studied in detail only recently. An important factor that influenced the progress of this science is the development of computing, which allowed to carry out complex calculations. In parallel to that, many researches have been done in the last years aimed at understanding and reproducing the effects of earthquakes in built structures.
Thanks to the combination of new methods of structural analysis and powerful computing resources, accurate approaches of the behavior of a specific structure can be done nowadays. The two more widely used structural analysis methods are adopted in this thesis, namely Pushover Analysis and Time Integration Analysis. The Finite Element Method (FEM) is used to model a case study and to discuss the obtained results in detail.
The case study is a ‘‘Gaioleiro’’ building, a traditional stone masonry typology used mainly in Lisbon, Portugal, between the 19th and 20th century. The study of this building started years ago with a shaking table test carried out by the National Laboratory of Civil Engineering in Lisbon (LNEC), together with University of Minho. Subsequently, a FEM model was calibrated by other authors according to the results obtained in this test.
The present thesis starts with a brief introduction, some basic background about seismic engineering and a brief description of the adopted FEM model. Then the results obtained for the model with Pushover and Time History Analyses are discussed, with the aimed to contribute for the validation and application of pushover analysis in the seismic assessment of historical masonry buildings without box behavior. The main body of the thesis includes a sensitivity analysis intended to assess the influence of the material properties in the behavior of the structure, as well as the impact of rigid diaphragm floor structures and the load pattern distribution in the response of the building. The sensitivity analysis is performed for both Pushover and Time History Analyses, in order to discuss the objectivity of the results.
Estudo paramétrico de um edifício de alvenaria histórica submetido a ações sísmicas
Os terremotos são um dos perigos naturais que causaram mais perdas para a humanidade. Além de inúmeras vidas humanas, os terremotos destruíram edifícios e até cidades em muitos lugares e civilizações ao redor do mundo. No entanto, a natureza e a origem de sismos, bem como o seu efeito em estruturas construídas, têm sido estudadas em detalhe apenas recentemente. Um fator importante que influenciou o progresso desta ciência é o desenvolvimento da computação, o que permitiu a realização de cálculos complexos. Em paralelo a isso, muitas investigações têm sido feitas nos últimos anos que visam compreender e reproduzir os efeitos de terremotos em estruturas construídas.
Graças à combinação de novos métodos de análise estrutural e recursos computacionais poderosos, as abordagens precisas do comportamento de uma estrutura específica podem ser feitas hoje em dia. Os dois métodos de análise estrutural mais utilizados são adotados nesta tese, a saber a Análise Pushover e Análise dinâmica com integração no tempo. O Método dos Elementos Finitos (MEF) é usado para modelar um estudo de caso com estas técnicas e discutir os resultados obtidos em detalhe.
O caso de estudo é um edifício gaioleiro, uma tipologia tradicional de alvenaria de pedra usado principalmente em Lisboa, Portugal, entre os séculos XIX e XX. O estudo deste edifício começou há alguns anos com um ensaio de mesa sísmica realizado pelo Laboratório Nacional de Engenharia Civil, em Lisboa (LNEC), em conjunto com a Universidade do Minho. Subsequentemente, um modelo MEF foi calibrado por outros autores de acordo com os resultados obtidos neste teste.
A presente tese começa com uma breve introdução, algumas informações básicas sobre engenharia sísmica e uma breve descrição do modelo MEF adotado. Em seguida, os resultados obtidos para o modelo com Análises Pushover e com integração no tempo são discutidos, com o objetivo de contribuir para a validação e aplicação de análise avançada na avaliação sísmica de edifícios históricos de alvenaria sem comportamento do tipo caixa. O corpo principal da tese inclui uma análise de sensibilidade destinada a avaliar a influência das propriedades do material no comportamento da estrutura, bem como o impacto da rigidez da de diafragma do pavimento e do padrão de distribuição de carga na resposta do edifício. A análise de sensibilidade é realizada tanto para Pushover como para a integração no tempo, a fim de discutir a objetividade dos resultados.
Estudio paramétrico de un edificio histórico de albañilería sometido a cargas sísmicas.
Los terremotos son uno de los fenómenos naturales que han causado más pérdidas en la historia de la humanidad. Aparte de incontables vidas humanas, los terremotos han destruido edificios e incluso ciudades enteras en muchos lugares y civilizaciones diferentes alrededor del mundo. Sin embargo, la naturaleza y origen de los terremotos, así como su efecto en las estructuras, han sido estudiados en detalle solo en tiempos recientes. Un factor importante que ha influido en el progreso de esta rama de la ingeniería es el desarrollo de la informática, que ha permitido llevar a cabo cálculos complejos. En paralelo a esto, muchas investigaciones han sido realizadas en los últimos años, enfocadas a comprender y reproducir los efectos de los terremotos en las estructuras.
Gracias a la combinación de nuevos métodos de análisis estructural y potentes recursos computacionales, aproximaciones precisas del comportamiento de una estructura específica ante cargas estáticas y dinámicas pueden ser realizados actualmente. Los dos métodos de análisis estructural más ampliamente usados en el campo académico son adoptados en esta tesis, a saber; análisis de Pushover y análisis de tiempo-historia. El método de elementos finitos (MEF) es usado para modelar el objeto de estudio y discutir en detalle los resultados obtenidos.
El objeto de estudio es un edificio ‘‘Gaioleiro’’, una tipología tradicional basada en albañilería de piedra y usada principalmente en Lisboa, Portugal, entre los siglos 19 y 20. El estudio de este edificio comenzó hace años con un ensayo realizado en una mesa de vibración por el Laboratorio Nacional de Ingeniería Civil (LNEC) en Lisboa, junto con la Universidad de Minho. Posteriormente, un modelo realizado con el método de elementos finitos fue calibrado por otros autores de acuerdo con los resultados obtenidos en este ensayo.
La presente tesis comienza con una breve introducción, algunos conocimientos básicos sobre ingeniería sísmica y una breve descripción del modelo adoptado. Los resultados obtenidos con el análisis de Pushover y de tiempo-historia son analizados y discutidos. El principal objetivo de este análisis es la contribución en la validación y aplicación del análisis de Pushover en la valoración sísmica de edificios históricos de albañilería sin comportamiento de ‘‘caja’’. El cuerpo principal de la tesis incluye un análisis de sensibilidad con el objeto de evaluar la influencia de las propiedades de los materiales en el comportamiento de la estructura, así como el impacto que diafragmas rígidos y diferentes patrones de distribución de cargas pueden tener en la respuesta del edificio. El análisis de sensibilidad es llevado a cabo para ambos análisis, los de Pushover y de tiempo-historia para discutir la objetividad de los resultados.
TABLE OF CONTENTS
1 Introduction 4
1.1 Masonry and Earthquakes 5
1.2 Contents of the thesis 7
2 Seismic analysis 9
2.1 State of the art 10
2.2 Safety assessment 15
3 Description of the case study 18
3.1 Geometrical description 19
3.2 Finite element model 20
3.3 Material properties of the finite element model 20
3.3.1 MDF panels and timber joists 20
3.3.2 Masonry walls 21
3.4 Load cases of the model 23
3.4.1 Static – Pushover analysis 24
3.4.2 Dynamic – Time history analysis 26
3.5 Analysis procedure 27
4 Reference model - Pushover analysis 29
4.1 Introduction 30
4.2 E-W direction 30
4.2.1 Deformed mesh (displacements) E-W direction 31 4.2.2 Principal tensile strains (maximum) E-W direction 32 4.2.3 Principal compressive stresses (minimum) E-W direction 34
4.3 N-S direction 36
4.3.1 Deformed mesh (displacements) N-S direction 37 4.3.2 Principal tensile strains (maximum) N-S direction 38 4.3.3 Principal compressive stresses (minimum) N-S direction 39
4.4 Conclusion 40
5 Reference model - Time history analysis 42
5.1 Introduction 43
5.2 Lisbon area earthquake – 100% PGA 43
5.2.1 Acceleration history response 43
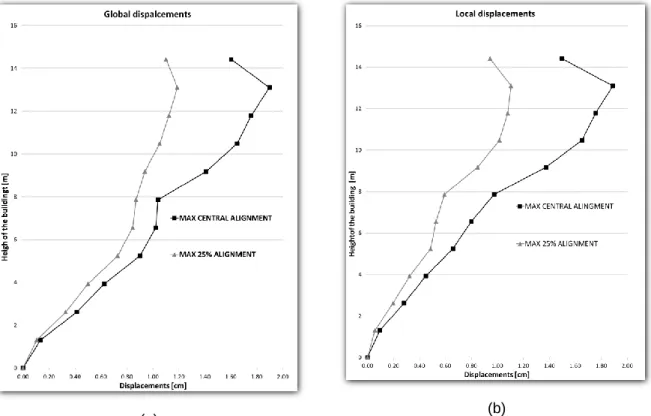
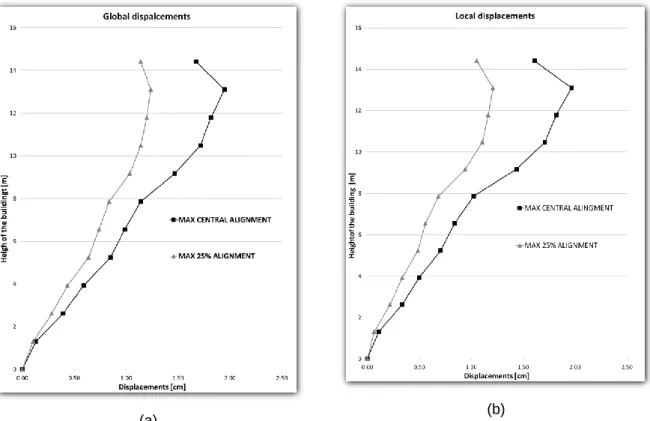
5.2.2 Displacements and drifts 46
5.3.1 Acceleration history response 54
5.3.2 Displacements and drifts 57
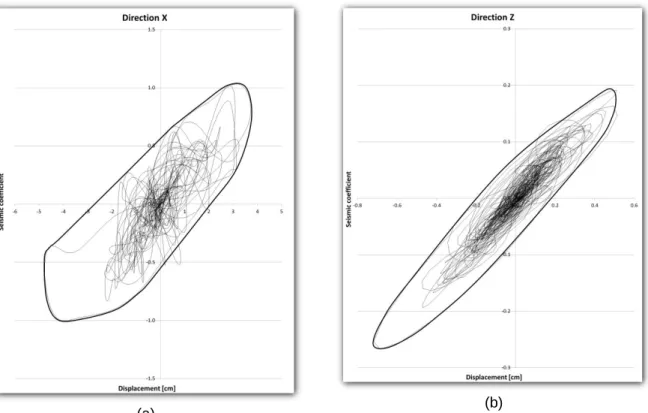
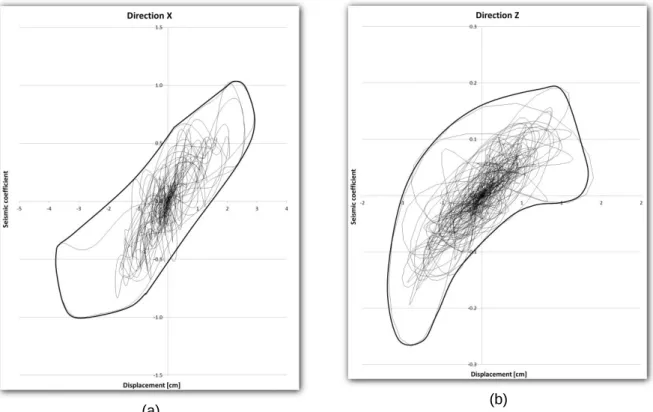
5.3.3 Envelopes 61
5.3.4 Principal tensile strains 64
5.4 Conclusion 65
6 Sensitivity analysis 67
6.1 Introduction 68
6.2 Non-linear static analysis – Pushover method 68
6.2.1 Stiffness of the MDF panels 68
6.2.2 Stiffness of the masonry walls. 76
6.2.3 Tensile strength 82
6.2.4 Fracture energy tensile 86
6.2.5 Conclusion 91
6.3 Non-linear dynamic analysis – Time history – 300% PGA earthquake 92
6.3.1 Stiffness of the MDF panels 92
6.3.2 Stiffness of masonry 94
6.3.3 Damping ratio. 96
6.3.4 Tensile strength 97
6.3.5 Fracture energy tensile. 98
6.3.6 Conclusion 99
7 Conclusion and future works 102
Chapter 1
1 Introduction
1.1 Masonry and Earthquakes
Masonry is a construction technique used for centuries all over the world, from Europe to Asia, as well as in Africa or America. In places where stone was available the buildings started to be made just placing one stone over another without any mortar. The stones could be placed just as found in nature, but later on, when carving tools were developed, stones were dressed to assure a better adjustment. As man started to find out how to use clay, lime or other mortars, masonry evolved to more sophisticated arrangements, bonding the units with these mortars. In places where stone was not available, construction techniques were slightly different. The units needed to be made by man, usually mixing mud and straw, and letting the mix to dry at the sun. It was common to use the same mud as mortar in the joints. This earth based technique is still much in use today in developing countries. The third big family of masonry techniques is the one made by using clay brick fired in ovens. Again different kind of mortars can be used in the joints, made with clay, cement, lime, glue, etc. To summarize, the evolution of humanity is connected to the history of architecture and of the materials used to build, (Musgrove and Fletcher, 1987), (Davey, 1961).
Nowadays there is a large range of materials and construction techniques available in the market. Some examples of masonry are shown in Figure 1, (Roca, P et all, 1998) In the case study the units are granite stone and the joints are made with lime mortar.
(a) (b)
Figure 1 - Different masonry bond: (a) bond in the wall face; (b) internal structure.
The seismic performance of masonry structures is related with many characteristic of the materials, as well as the quality of the workmanship and the structural configuration. The seismic performance of stone masonry construction is generally very poor. The main reason is the low tensile strength of the masonry and the poor bond provided by the irregular units. Timber roof and floor structures are usually light and they do not induce large additional seismic forces, in contrast to masonry that is rather heavy. However, the connections and horizontal structures are not very stiff and thus the structures are flexible and are not able to form a rigid diaphragm; there is not box behaviour. Several researches have been done already regarding the behaviour of flexible-rigid diaphragms. Some examples can be seen in (Brignola et al. 2008, Yi 2004, Paquette and Bruneau 2000, Tomaževic et al. 1996 and
A “Gaioleiro” building is a traditional stone masonry typology used between the middle of the 19th
century and the beginning of the 20th century, in the Lisbon (Portugal). The development of the city in the middle of the 19th century attracted many constructors from small villages, who extrapolated the methods from one or two storey buildings to these four or five storey buildings, Construir Portugal (2012). These buildings are part of the transition period from the ‘pombalino’ buildings, with anti-seismic practices as timber frames in the walls, and the modern reinforced concrete frame buildings, ( Lourenço, Mendes, et al. 2011, Ramos and Paulo B Lourenço 2004). Many examples of these buildings remain in use nowadays, as shown in Figure 2, (Mendes and P.B. Lourenço 2009)
Their typology is usually based on masonry walls with timber floors and roof. The external walls are, usually, in rubble limestone masonry with lime mortar. A key feature regarding the seismic assessment of these building is the fact that the connection between walls and floors is very weak.
Figure 2 - Examples of “Gaioleiro” buildings, Lisbon, Portugal.
Lisbon is located in a region of moderate seismicity and suffered a catastrophic earthquake in 1755. An earthquake is the result of the release of energy in the crust of the earth, originating, basically, due to two factors; volcanic activity and tectonic drifts. Earthquakes due to volcanic activity are usually weak, so the most important earthquakes to take into account are the ones produced by tectonic drifts. Tectonic plates are in constant drift. When two tectonic plates are drifting against each other all the energy used to move these plates is stored in the material where the two plates contact. This energy is stored till it reaches a certain limit, which the material is able to bear. Then, the two plates moves and this energy is suddenly released, causing seismic waves.
A map with the frequency of earthquakes in the years between 1963 and 1998 is shown in Figure 3, Digital Tectonic Activity Map (2012), with the main faults between tectonic plates. In places where there is higher concentration of earthquakes the tectonic plates are pushing against each other. If the concentration is not so high it means the tectonic plates are moving apart.
Figure 3 - Map of earthquake concentration between 1963 and 1998.
The point where this energy is released is called hypocentre. As shallower the hypocentre is the more damage it causes to buildings. From the hypocentre the seismic waves travel through the earth. The point just above the hypocentre is called epicentre, and it is in the surface of the earth. In this surface the earthquakes cause horizontal and vertical waves, which affect to the structures in different ways, Oliveira (2012).
1.2 Contents of the thesis
The main goal of the thesis is to contribute in the validation and application of pushover analyses in the seismic assessment of historic masonry structures. To achieve this objective the thesis has been divided in two different parts. In the first part a parametric study is performed to compare the results between pushover analysis and time history analysis. A thorough sensitivity analysis of the parameters involved is carried out in order to evaluate their influence in the results. As an example, the influence of stiffness of the floor diaphragm in the global behaviour is assessed. In the second part pushover analyses are performed considering force based and displacement based approaches for the mass distribution. Within these two possibilities of performing pushover analysis, also different usual load patterns are applied: the typical mass proportional, inverted triangle and first mode proportional. Besides these load patterns, innovative load patterns are applied as well, namely adaptive modal and multimodal.
The thesis starts with some basic concepts about seismicity, as well as a description of the different analysis techniques used in the subsequent chapters. Afterwards a description of the case study is given, with a brief description of the process followed to calibrate the model. The description includes
the characteristics of the finite element model, the properties of the materials and the loads, both for static and dynamic loads.
The main body of the thesis starts thereafter, with the parametric study, i.e. the comparison between pushover analysis and time history analysis, as well as the discussion of the influence of different parameters in the final results. Then, a comparison between different load patterns for pushover methods is carried out, with a distinction between force based and displacement based but also between the different load patterns to apply in the model.
Chapter 2
2 Seismic analysis
Abstract
This chapter provides a brief review about seismic behaviour and basic knowledge about seismic analysis. Afterwards the main analysis techniques to be used in the thesis are introduced, namely nonlinear static and nonlinear dynamic analyses. Besides a brief explanation on how the techniques work and some of their advantages and disadvantages are highlighted. In the last part of the chapter, the concept of safety assessment is addressed and descriptions of the different pushover methods to be used are given, together with a discussion on the load patterns later used in the pushover analyses.
2.1 State of the art
Earthquakes have caused countless losses in the humanity history. Besides the earthquake itself, seismic waves can cause several different natural disasters such as land sliding, floods, tsunamis or fires. However, this thesis is focused in the effect of earthquake in structures, i.e. how the ground motion due to the earthquake affects a specific building. Earthquakes have affected the built heritage from the beginning of the history. The earliest cultures in Middle East had already some kind of anti-seismic construction techniques. These construction techniques and others developed in different civilizations have been employed in many parts of the world and in different times. But there is a common feature: all of them were based in the experience of the builders and the trial and error method.
In recent times several researches have been carried out regarding the nature, origin, and effects of earthquakes in the built heritage. Several factors have influenced this development, mainly from two sources. The first one and most obvious is the progress of the science, which allowed to carry out more advanced calculations (especially with the introduction of computing), more complex and higher buildings and, at the same time, build them in a safer a more economical way. The second source is related with the advance of the society itself, which gives a higher value for human life and provides more understanding and appreciation of the value of ancient buildings as a source of knowledge and a cultural heritage. A new branch of the structural analysis science was born and is growing day by day: seismic analysis. The aim of this science is to understand and explain the seismic behaviour of the buildings. The seismic behaviour, or seismic response of a building, is a complex science which depends on many factors. Thus, there are several research fields involved in this process; computational engineering, structural engineering, material engineering, soil engineering, seismic engineering, etc.
In a simplified way, the building features that influence more the response of the building to an earthquake are, basically, the construction techniques, the material properties and structural configuration. In this paper the construction techniques and structural configuration are fixed, as only one case study is analysed. Thus, only possible changes in the material properties will be assessed, regarding their influence in the structural behaviour of a given earthquake. Besides the building features, the influence of the applied load is assessed as well.
Vibration modes or modes of response are oscillation systems with a pattern of motion in which all
parts of the system move sinusoidally with the same frequency and with a fixed phase relation i.e. how the building will move depending on its structural configuration. Modes of response do not depend on the load the building is subjected to. Even simple buildings usually have too many modes of response and they need not to be all taken into account. Usually, only the first ones are important and have
used in the calculations of the building response. Figure 4 shows examples of the first three modes of response of a Gaioleiro building, (Mendes et al. 2010): 1st mode is transversal, 2nd mode is rotational and 3rd mode is longitudinal.
1st Mode [4.93 Hz] 2nd Mode [8.45 Hz] 3rd Mode [12.08 Hz]
Figure 4 - First three modes of response for a Gaioleiro building.
Macro-block analysis consists of dividing the model into several rigid blocks, which have a common
feature or behaviour. This method is a simplification of the actual performance of the building and the number of blocks to divide the building depends on the behaviour predicted to occur in the case study. For masonry structures under seismic loading, in most cases collapse occurs with loss of equilibrium in masonry portions or blocks. The verification for these mechanisms has a meaning if a certain monolithic behaviour within the blocks themselves is guaranteed i.e. if the blocks remain together. There are two types of local mechanisms in masonry building; perpendicular to the plane of the wall (out of plane) or parallel of the plane of the wall (in plane). The first type of mechanisms is more common in historical buildings since the tensile performance of the masonry is poor and connections are poor.
Two examples of mechanisms of macro block analysis are shown in the Figure 5. In the case (a) a tower is falling apart of the rest of the building. In the case (b) the whole façade overturns and separates from the main body of the building, (Lourenço et al. 2011). This method of analysis is recommended for assessment and design, but requires a good definition of the possible failure mechanisms. This might be a difficult challenge in many practical applications.
(a) (b)
Figure 5 - Examples of mechanisms due to block analysis. (a) overturning of the bell towers and (b) overturning of the main façade.
Non-linear static analysis is usually required for existing masonry structures because the response is
expected to be controlled by the inelastic properties. Pushover methods usually assume that the seismic behaviour depends only in the fundamental mode, and that this mode does not change when the structure yields. For historical buildings, higher modes can be important for the final behaviour or significant torsional irregularities can be present in the building, meaning that pushover methods can provide unrealistic results. Still, this is a much used technique in the seismic assessment of masonry buildings.
In static analysis (pushover) horizontal forces are applied, without dynamic effects, incrementally to define a capacity curve. This process can be combined with a demand curve such as an equivalent response spectrum, reducing thus the problem to a single degree of freedom one, (PAN and Ohsaki 2006). This procedure is based on the assumption that the response is controlled by the elastic fundamental mode and that the mode shape remains unchanged after the structure yields, (Krawinkler and Seneviratna 1998). To perform this analysis the gravity loads have to be constant and the horizontal loads are increased monotonically. According to (CEN 2003a, 2003b), at least two distributions of the lateral loads should be applied:
a “uniform” pattern, based on lateral forces that are proportional to mass regardless of elevation (uniform response acceleration);
a “modal” pattern, proportional to lateral forces consistent with the lateral force distribution in the direction under consideration determined in elastic analysis (in accordance with lateral force method or modal response spectrum analysis).
Besides these two load patterns that the (CEN 2003a, 2003b) defines as compulsory, three other load patterns will be used in this thesis. One of them is the inverted triangular pattern, which is well known and represents an approximation of the first mode of response. The other two load patterns used, adaptive modal pattern and multimodal pattern, have been proposed more recently and have been scarcely used, particularly for masonry structures is limited. These load patterns will be explained in detail in the Section 3.4.
After applying the incremental loading, the relation between the shear force at the base and a control displacement at the top has to be determined for values in a range between zero and 150% of the target displacement. The target displacement is the maximum displacement that the structure is able to bear, obtained from the elastic response spectrum of an equivalent SDOF system. Since the target displacement is not available in the case study, its value depends on the calculation. However, the displacement for each assumption is big enough to assure that the results are valid. The relation between shear force and displacement is the so-called ‘‘capacity curve’’, which is basically the response of the structure. Each point of the capacity curve represents an effective and equilibrated stress-state of the structure, i.e. a deformation shape which corresponds to the applied external lateral loads, (Antoniou and Pinho 2009). Besides the capacity curve, it is possible to obtain the collapse mechanisms and different values of quantities, such as maximum displacements, maximum stresses, etc. Figure 6 shows examples of capacity curves for a structure with different materials, (Jianguo et all 2006).
In non-linear dynamic analysis (time integration) the earthquake accelerograms are given as external actions which duration is the same than the duration of earthquake itself. The structure is thus considered with dynamic properties, which change throughout time. This method is based on the equation of motion, shown in Eq. (1);
( )
mucuku p t (1)
Where;
m
is the mass andu
is the accelerationc
is the damping andu
is the velocityk
is the stiffness andu
the is displacementp
is the external force andt
is the time stepA time step needs to be selected and the initial conditions need to be given. Then the acceleration, velocity and displacement are calculated step by step based on these assumptions. Thus, it is possible to obtain the values of acceleration, velocity and displacement during the duration of the earthquake.
Time history analysis is the most accurate method for assessing the response of structures subjected to earthquake actions. However, such type of analysis has also difficulties or drawbacks, particularly for what concerns application in a design office context. The first inconvenience, as it is said in (Bommer and Acevedo 2004), is to find a specific ground motion compatible with the seismic hazard spectrum for the place where the case study is located. Nonlinear time-history analyses are also computationally demanding and require much time for the calculation and for analysing the results obtained. To run this kind of calculations, powerful computers are also usually needed. Usually, preliminary simpler analyses, such as modal and static analyses, are run to allow a first check of the model, (Antoniou and Pinho 2009). Usually several different earthquake records need to be used, assuming the results as the average of the most conservation response. For a low number of records, the value of Ed is the most unfavourable of the response quantity among the analyses. Ed is the design
value of the action effect due to the seismic effect. This value should be lower than Rd, which is the
design resistance value of the element and depends on the material used.
Parametric studies are particularly relevant and have several aims because of the scarce use of time
history analysis and the potential effect of changing the control parameters. To start a parametric study some assumptions are required. First of all the parameters to change and their ranges must be defined. Once the parameters for use in the simulation and their ranges have been established it is convenient to set up various possible parametric configurations. The first parameter to be changed here is the stiffness of the floor panels, to evaluate the influence of rigid diaphragm floor structure in
other parameters are assessed, namely the modulus of elasticity assessed, tensile strength and tensile fracture energy. All these parameters are explained in detail in the Section 3.3.
2.2 Safety assessment
Safety assessment is a very important part of the design of new structures because it ensures the integrity of the construction and saves human lives. In the case of ancient construction, it also preserves the architectural and cultural heritage. Seismic safety assessment is a compulsory evaluation established in the (CEN 2003a, 2003b), which aims at determining the expected collapse mechanism and the building lateral strength and displacement capacity. The building integrity has to be verified at the relevant limit states;
Ultimate limit state: under the design seismic action (probability of exceedance of 10% in 50 years) the buildings are heavily damaged, both in structural and non-structural elements. The buildings have to keep residual resistance, lateral stiffness and the whole bearing capacity with reference to the vertical loads. Collapse of the building is not allowed.
Damage limitation state: under the seismic actions with lower return period (probability of exceedance of 50% in 50 years) the buildings cannot be heavily damaged. Structural damage is limited.
Pushover methods are used to perform the safety assessment. They can be divided in force based methods and displacement based methods. Within each method there are different ways to apply the force; mass proportional, first mode proportional, adaptive modal pushover analysis and multimodal pushover analysis. These methods are a static approach; the response spectrum is used as input instead of the whole accelerogram of the earthquake. Thus, only peak values will be obtained and not the whole time history of the displacements of the building.
The force based design procedure starts by proportioning the strength and stiffness for the structure in critical elements to calculate the periods. From there it is possible to calculate the seismic forces and analyse the structure. If the displacements are bigger than the maximum allowed it is necessary to start from the beginning, Máca and Oliveira (2011) (“Assessment and improvement of the structural performance of Buildings in Earthquakes” 2006). This method is not widely used because iterations are needed and it is more time consuming than displacement based methods.
The displacement based design approach starts from the target displacements. Then the analysis is performed and strength and stiffness are determined (as the end result of the design process) to achieve the design displacements. The method defines the capacity of a building relating the potential deformation (displacements) with its fundamental period of vibration at different limit states. Afterwards
building. Figure 7 shows an example of the relation between expected displacements (straight line with circles) and capacity curve. In this example, for the periods between 0.9 and 3.15 second the building would collapse, see (Crowley et all 2004).
Chapter 3
3 Description of the case study
Abstract
In this chapter the case study is fully described. The chapter starts with a geometrical description of the model and an explanation of how the adopted parameters were set up. Then the material properties are described from the modelling point of view. The chapter includes both the parameters to be assessed in subsequent chapters and those which will not be modified. The material behaviour is also explained. The last part of this chapter defines the load to be applied in the model. For static loads the different modal patterns that are going to be used in subsequent chapters are defined. For dynamic loads the accelerograms of the input in both North-South and East-West direction are given and described.
3.1 Geometrical description
The building chosen for this case study is representative of a typical building typology used from middle of the 19th century to the beginning of 20th century, with four storeys. The load bearing structural configuration of the building, which is semi-detached to the surrounding buildings, is constituted by two parallel gabble walls without openings and two main parallel façades. All walls are made of masonry and are considered to have the same characteristics. The building is considered to be isolated next, instead of semi-detached, as this is the way it was tested on the shaking table. The floors are made with timber joists and MDF panels. There are timber beams attached to the walls, connected with the floor system and to the masonry walls. These panels are taken into account in the parametric study to discuss the influence of rigid diaphragm floors on the seismic behaviour, (Mendes and P.B. Lourenço 2009)
The dimensions of the whole building in real scale are 9.45 X 12.45 meters in plan with an inter-storey height of 3.60 meters. Since the building has 4 storeys, the total height is 14.40 meters. The façades have 16 openings of 2.70 X 0.90 meters, which results in a percentage equal to 28% of openings. The walls have a thickness of 0.51 meters. The thickness of the MDF panels is 0.036 meters. The dimensions of the timber joists are 0.30 X 0.225 meters. In Figure 8 a general view of the building with the dimensions and the orientation of the façades can be seen.
3.2 Finite element model
The numerical code used for the finite element modelling is Diana V.9.4. Shell elements are used in the finite element modelling for the walls and MDF panels. For the timber joists modelling, beam elements are used. The shell element used is called CQ40S, which is an eight-node quadrilateral isoparametric curved shell element. This element is based in quadratic interpolation with Gauss integration over the area and Gauss or Simpson over the thickness. The adopted integration scheme has four integration points in the plan and five Simpson integration points in the thickness. Thus, each element has 20 integration points. The beam element used is called CL18B and it is a three-node, three-dimensional class-III beam element. The variables are the translations and the rotations in the nodes, in the three directions. The boundary conditions were assigned to the base of the building, which is totally fixed to the ground; both translational and rotational movement are restricted.
The calibration of the model was made previously by (Yang 2010).To calibrate the model a mock-up was prepared to reproduce the characteristics of the case study; geometrical, physical and dynamical. There was a size limitation due to the shaking table measures, so all the dimensions of the mock-up were reduced 1:3 from the real ones. The tests carried out at the 3D shaking table of the National Laboratory of Civil Engineering (LNEC), Lisbon, and can be seen at (Candeias et al. 2004). In this work, full scale values were used because the objective is not to compare the model with the experimental tests. Using a full scale model allows to avoid any size effect.
3.3 Material properties of the finite element model
3.3.1 MDF panels and timber joists
In order to assess the influence of rigid diaphragms in floor structure the stiffness of the MDF panels is modified to perform four different calculations, besides the reference one. The parameter changed to assess the stiffness is the modulus of elasticity, which is underlined next; the other parameters explained in this section (Poisson ratio and density) are not changed in the parametric study, and they are just italicized.
The modulus of elasticity is also known as the Young’s modulus, and it is defined as the ratio of the uniaxial stress over the uniaxial strain in the range of stresses in which the Hooke’s law governs. Thus, the floor structures have only linear behaviour. Another two properties of the timber joists and MDF panel need to be assigned: Poisson ratio and density. When a material is stretched or compressed it tends to shrink or expand. This is called the Poisson effect. Poisson ratio is the relation between these shrinkages or expansions and their related tensile or compression stresses. The
density is the quantity of mass per volume of material. These two values, Poisson ratio and density,
properties of the MDF panels. The underlined property (Modulus of elasticity) is changed in the sensitivity analysis. The italicized ones (Poisson ratio and density) remain constant.
Timber joists:
o Modulus of elasticity equal to 12x103 MPa o Poisson ratio equal to 0.3
o Density equal to 580 kg/m3
MDF panels:
o Modulus of elasticity equal to 0.14x10³
MPa o Poisson ratio equal to 0.3
o Density equal to 760 kg/m3
3.3.2 Masonry walls
The masonry is considered to have inelastic behaviour. The modulus of elasticity defines the elastic stiffness and its influence in the final results is assessed. The inelastic behaviour is mostly governed by the strength and the fracture energy. The influence of these two parameters is evaluated only in tension. Since the collapse in masonry is usually due to the lack of tensile strength the values of compression are not modified for the sensitivity analysis. Damping is also assessed to study the influence of the oscillations in the structure. All of the evaluated parameters are underlined, while the parameters which are not taken into account in the parametric study are just italicized.
Modulus of elasticity, Poisson’s ratio and density were already explained in the definition of the
properties of the floor structure. Tensile strength is the maximum stress that a material is able to withstand while being axially stretched.
The behaviour of the material is linearly dependent from zero to the point where the tensile strength is reached, which is equivalent to the crack point. After that, the softening starts and, in the case study, it has an exponential behaviour. At the beginning strains decrease slowly for a large variation of stresses. At the end of the curve the strains experiment a big variation for a small decrease of stresses. A graphic representation of this exponential behaviour is shown in Figure
9, Diana user’s manual, Manie, J. 2010. Figure 9 - Exponential behaviour.
Fracture energy in tension (Gft) is defined as the energy consumed to cause the total breakage of the
material by tensile forces per unit area of the fracture plan. The fracture area is the projected area on a plane parallel to the crack direction, (Hillerborg 1985).
f
absorbed
fracture energy
G
fracture area
(1)Compressive strength is the maximum capacity of materials to withstand the stresses while being
axially compressed. Fracture energy in compression (Gfc) is defined as the energy consumed to cause the total breakage of the material by compressive forces per unit area of the fracture plan. In the case study the compressive behaviour of the
masonry is parabolic. The strains decrease as the stresses decreases following a parabolic equation. When the compressive strength is reached the softening behaviour of the masonry follows the same equation, but in this case the stresses decrease as the strains increase. A graphic representation of this parabolic behaviour is shown in Figure 10, Diana user’s manual,
Manie, J. 2010. Figure 10 - Exponential behaviour.
Shear retention factor is the coefficient which modifies
the shear strength after the crack point. Shear strength is the maximum stress the material is able to withstand when it is subjected to shear forces before failure. Shear force tends to cause the failure of the material in a plain parallel to the force. In the case study the shear retention factor is constant. Thus, the shear behaviour is linearly dependent. This value is not involved in the sensitivity analysis; its value is constant for every calculation. A graphic representation of this parabolic behaviour is shown in Figure 11, Diana user’s manual, Manie, J. 2010.
Figure 11 - Shear constant behaviour.
Damping reduces the amplitude of oscillations in the system. In other words, it is the mitigation of the
vibration effects in a structured due to the dissipation of energy. Damping is linearly related to the velocity of the vibrations. For structures with many different mode shapes and a wide range of natural frequencies the most common and suitable type of damping is Rayleigh damping. Rayleigh damping is a linear combination of mass and stiffness of the initial elastic system. This damping varies with frequencies, following the formula given by the EQ 3, (Spears and Jensen 2009).
2
2
(2) Where; is the damping ratio for each natural frequency
is the first Rayleigh damping coefficient, related with the mass is the second Rayleigh damping coefficient, related with the stiffness
is the natural frequencyHowever, it is easier and simpler to assume the Rayleigh damping in a way that all the frequencies are involved. The equation (4), which governs these matrix calculations, is shown below, (Chowdhury and Dasgupta 2007).
C
M
K
(3) Where;
C
is the damping matrix
is the first Rayleigh damping coefficient, related with the mass is the second Rayleigh damping coefficient, related with the stiffness
M
is the mass matrix
K
is the stiffness matrixThus, the values that change in the sensitivity analysis to assess the influence of damping in the final results are
and .All the values regarding masonry are listed below as a summary. The values that are evaluated are underlined, while the other values are just italicized.
Masonry:
o Modulus of elasticity equal to 1x10³
MPa o Poison ratio equal to 0.2
o Density equal to 2150 kg/m2
o Tensile strength equal 0.1 MPa with exponential behaviour o Fracture energy in tension equal to 0.12 kPa/m
o Compressive strength equal to 6 MPa with parabolic behaviour o Fracture energy in compression equal to 9.6 kPa/m
o Shear retention factor 0.1
For vertical forces only self-weight is taken into account, as the additional loads are not significant in this type of structures. These loads are constant and depend on the density of the elements. For horizontal forces of seismic origin there are several loading possibilities. They are divided between static loads (with different load patterns) and dynamic loads (in which the input is the earthquake accelerograms).
3.4.1 Static – Pushover analysis
The horizontal loads are applied in a static way, independently of time. Sequences of load steps are defined to perform the analyses incrementally. All the load patterns applied will take into account both E-W and N-S directions. The simplest load pattern is mass proportional, in which the self-weight of the structure is applied in a horizontal way. This is the load pattern applied in the model and used in the parametric analysis, since the first mode proportional load pattern is too conservative, as it can be concluded by comparing the results obtained using the pushover methods with those obtained with time history analysis. The comparison between the capacity curves for mass and first mode proportional with both displacement and force based load pattern distribution can be seen in the Figure 12 for the east-west direction and in the Figure 13 for the north-south direction.
Figure 13 - Comparison capacity curves N-S direction.
In the first mode proportional load pattern the input is applied proportional to the first mode of response. These load patterns suffer from some drawbacks: (1) they do not take into account the effects of the progressive changes in the mode shapes because of structural yielding and damages. In order to remedy this disadvantage some researches have proposed multimodal procedures, see (Aydinoglu 2003) and (Antoniou and Pinho 2004). The damage progression has effects on the response of structures when the load levels are increased. In this kind of pushover analysis these effects are taken into account, updating the loading vector at each analysis step. The application of this incremental loading vector leads to better response predictions (without additional modelling or analysis effort) and its structural response estimations correspond to equilibrated structural stress states, (Antoniou and Pinho 2009); (2) they are restricted to a single-mode response, not considering the contribution of the higher modes. Even in small buildings of a few storeys and regular building configurations many modal shapes influence the final response of the structure. For simplification, in normal pushover analysis only fundamental vibration mode is considered in the calculations. To find a solution for this problem adaptive modal procedures have been proposed, see (Shakeri et al. 2012), (Chopra and Goel 2002) and (Shakeri et al. 2007) This improved method aims to make pushover analysis more accurate considering the contribution of higher modes to the response, in addition to the fundamental one. Thus, the contribution of multiple modes and the effects of their interactions are taken into account, (PAN and Ohsaki 2006)
3.4.2 Dynamic – Time history analysis
In the case study two different earthquakes, each with two horizontal ground motions are considered. The accelerograms corresponding to the first earthquake were generated based on the response spectrum given in (CEN 2003a)(CEN 2003b), type 1. The soil type chosen is type A, corresponding to region of Lisbon and the selected damping is 5%. The accelerograms are obtained from the Portuguese National Annex (LNEC 2009). The vertical ground motion is neglected because it was also not considered in the shaking table test. The horizontal accelerograms are in East-West direction and in North-South direction. The earthquake records have a full duration of 36 seconds. They are divided into 6000 time steps. The E-W direction accelerogram is shown in Figure 14. The numbers at the bottom represents the time step history. In the Y axis the acceleration is labelled in m/s2. This earthquake is called 100% PGA in this work. A second calculation is made with a PGA increased three times, called 300% PGA, just scaling up the acceleration. This calculation is made to try to obtain the maximum shear base capacity of the structure.
Figure 14 - Accelerogram in E-W direction.
The highest accelerations of the earthquake in E-W direction are between second 15 and 25 seconds. In the E-W direction the largest value is 1.7 m/s2 and it takes place in the time step number 1849, which corresponds with the second 22.2.
-2 -1.5 -1 -0.5 0 0.5 1 1.5 2 0 5 10 15 20 25 30 35 Acc ele ra tio n [ m /s 2]
Time history [seconds]
N-S earthquake
The N-S direction accelerogram is shown in Figure 15. As well as for the earthquake in E-W direction, the highest accelerations of the earthquake in N-S direction are between second 15 and 25. In the N-S direction the largest value is 1.9 m/s2 and it takes place in the step number 1333, which corresponds with the second 16.0.
Figure 15 - Accelerogram in N-S direction.
3.5 Analysis procedure
For the pushover analyses the procedure the force applied in each step is equal to 2.5% of the self-weight of the structure. When the steps do not converge the load is modified to different values, never larger than 5% of the self-weight. The arc-length displacement control is used, combined with the spherical path method, being the control point at the top of the gabble walls for east-west direction and at the top of the façades for north-south direction. The iteration method used is Newton-Raphson regular with energy convergence criteria. The tolerance is established as 0.001.
For time history calculations the size of the time steps is 0.006 second. Since the duration of the earthquake is 36 seconds there are 6000 steps. However, in order to have shorter times of analysis, measurements are taken only in one step every two. The integration method is HHT, also called alpha method. Linear iteration method is used for this type of calculation as it fits better loading-unloading systems. The convergence criteria and tolerance are the same as in the pushover analyses.
-2 -1.5 -1 -0.5 0 0.5 1 1.5 2 0 5 10 15 20 25 30 35 Acc ele ra tio n [ m /s 2]
Time history [seconds]
Chapter 4
4 Reference model - Pushover
analysis
Abstract
The response of the case study building to horizontal incremental static loads replicating the earthquake is discussed in this chapter. Directions east-west and north-south are considered and the results obtained in the analysis are discussed. The incremental analysis continues until collapse is found, the so-called pushover analysis. Thus, it is possible to distinguish and identify the macro blocks and failure mechanisms. This analysis is helpful to understand the global behaviour of the structure As expected, different behaviour is found for each main building direction and the stiffness of the floor is not enough to replicate a box response, with rigid floors. The influence of this feature is especially noticeable for the north-south direction, due to the orientation of the timber joists in the east-west direction.
4.1 Introduction
The interpretation of results from a pushover analysis is based mostly in the capacity curves, which give the relation between the static loads applied in horizontal direction and a selected control displacement caused by these loads. Here, the seismic coefficient is used to quantify the horizontal load, which is defined as the ratio between the applied loads and the weight of the building.
For every step analysed several figures are shown, illustrating the deformed mesh, and the distribution of stresses and strains in the structure. These figures help to explain and understand the global structural behaviour.
4.2 E-W direction
The capacity curve for the east-west direction can be seen in the Figure 16 for the collapse mechanism indicated in Figure 17, and three different branches are observed. The first branch has almost linear properties. The displacement increases in a proportional way to the applied load and no damage is observed in the model in this first part. The first step in which figures are shown (Figure 18 and Figure 21) is immediately after this section and it is the step number 5. The second branch starts in this point, in which the ratio between displacement increments and applied loads is higher than in the previous branch i.e. the curve softens. It means that some damages are appearing in the structure, so it is able to bear smaller loads for the same displacements. In this branch the Figure 19 and Figure 21, corresponding to the step number 9, can be seen. The collapse of the structure is expected to occur around this step number 9. The last part starts after this step. In this last structural behaviour a small increment of load causes a big rise of displacements. The curve tends to have idealistic behaviour; almost horizontal. This part is not considered to be realistic; the actual building would be already collapsed. The figures corresponding to the last step, which is the number 19, are shown in Figure 17, Figure 20 and Figure 23.
Figure 16 - Capacity curve in E-W direction.
4.2.1 Deformed mesh (displacements) E-W direction
The deformed mesh can be seen in Figure 17 for the step number 19, which is the last step of the analysis. For more detailed examination, the deformed meshes corresponding to the steps number 5 and 9 can be seen in Annex A. The magnification factor has different values for every step. For the step 5 the value is 100, for the step 9 it is 50 and for the step 19 the value is equal to 10. It means that the displacements are much higher in the last step than at the beginning, as expected. The deformation of the structure presents, undoubtedly, the consequence of applying horizontal loads in the direction perpendicular to the gabble walls (from east to west). All the building is leaning to the west direction, being the largest displacements at the top of the structure. The windows are being deformed, losing their rectangularity; the corners are opening or closing. It is in these corners that the concentration of strains and stresses is larger, as can be seen in the Figure 19 and Figure 22. The large deformation of the piers at the basement can also be observed. Two of the piers are being split; the strains in that point can be seen in Figure 20 (b). It is important to mention that the deformation of the gabble walls is larger than the deformation of the façades. The out-of-plane stiffness of the gabble walls is lower than the in-plane stiffness of the façades, so the middle point of the gabble walls is more deformed than the façades.
0.00 0.05 0.10 0.15 0.20 0.25 0 5 10 15 20 25 Se ism ic c o e ff ic ie n t [α h] Displacement [cm] 5 9 29 1st branch 2nd branch 3rd branch
Figure 17 - Deformed mesh in the step number 19, units in meters.
4.2.2 Principal tensile strains (maximum) E-W direction
The images shown here give an idea of the crack pattern. Figure 18 and Figure 19corresponding to the steps 5 and 9 respectively, show the inner side of the north and east walls. For the other two walls, south and west, the outer sides are shown. For detailed results, see Annex A, where two different perspectives are shown for each step. For each perspective the interior and exterior side of the walls are shown. The objective of these images is to show the walls that are closer to the observer, because the ones in the back are less clear. In other words, for the S-W perspective only the south and west walls are more important, while for the N-E perspective the north and east walls are more important. This configuration is the same for every perspective shown in this work. A view of the different orientations and axes is shown in the Figure 8.
In the step number 5, which corresponds to the end of the almost linear behaviour, there are only larger strains in the corners of the windows, see Figure 18. Since the wall is bending slightly, the strains are larger in the outer side of the façades, when compared to the inner side. As mentioned before, the strains are rather low at this step.
Around the cracking point, which corresponds to the step number 9, the strains in the corners of the openings become wider and new damage in the gabble walls appear. The east and west walls are bending and a long line of large strains concentrate in the vertical direction, in the inner side of the walls, close to the edges. These strains appear here due to the stiffness of the edges as they constrain the walls. In the middle of the wall the material is not so constrained so it can deform more freely. New damages appear as well at the base of the piers, which indicate that the piers are overturning. As they are fixed to the ground, larger strains appear at that point. A graphic representation of this step can be seen in the Figure 19.
The ultimate strain state can be seen in Figure 20 and it corresponds to the step number 19. The strains in the corners are much larger than in the previous step. The line of strains along the height of the gabble walls are also larger and new damages appear in the outer side of the edges due to the bending of the walls. The strains at the base of the piers disappear because they concentre in the centre due to splitting, as already mentioned above. New damages appear along the base of the gabble walls. The tensile strains are rather large and the walls are starting to overturn. Given the very large displacement attained, the building would be possibly already collapse and the damage concentration is excessive, which is the reason why the red area is so extensive.
Figure 18 - North-east perspective of the tensile principal strain state in the step
number 5.
Figure 19 - North-east perspective of the tensile principal strain state in the step
number 9.
(a) (b)
Figure 20 - North-east perspective of the tensile principal strain state in the step number 19, showing (a) the inner side and (b) the outer side of the walls.
4.2.3 Principal compressive stresses (minimum) E-W direction
In this section the minimum compressive stresses are shown for the steps selected in the capacity curve of Figure 16, see Annex A for more details.
The stress state for the almost linear initial behaviour can be seen in the Figure 21. It corresponds to the step number 5. Only the south-west perspective is shown in this section. In the gabble walls the stresses are larger at the bottom and in the west side. This is the expected behaviour since the horizontal loads are applied in this direction and the walls tend to overturn. These stresses are larger in the edges because the whole façade is loading the gabble wall towards west, while in the middle of the gabble wall only the wall itself provides loading. These stresses are opposite to the strains appeared in the step 19, see Figure 20, i.e. there are compressive stresses in one side and tensile strains in the opposite side. Other compressive stresses appear in the corners of the openings. They are showing the way that the horizontal load is driven to the ground by the structure, in a perpendicular line from the gabble wall to the ground. However, the concentration of stresses is larger in the corners of the openings and this effect is more visible in the subsequent steps.
(a) (b)
Figure 21 – Principal compressive stress state in the step number 5, from the south-west perspective, showing the (a) outer side of the walls and the (b) inner side of them, units in kPa.
The stress state in the cracking point can be seen in the Figure 22, which corresponds to the step number 9. The south-west perspective is shown, like for the previous step. The outer side of the walls is shown in the left side while the inner side is shown in the right side. The stresses at the bottom of the gabble walls are larger than in the previous step, as expected. The thrust line that drives the horizontal loads to the ground is now more obvious than in the previous stress state. The loads in this step are so big that the timber floor beams are causing some punching in the walls. This effect can be
compressive stresses are larger in the proximity of the façades than in the middle of the gabble walls. The compressive stresses in the gabble walls are spread by the walls themselves, more especially in vertical direction, causing the long concentration of stresses close to the edge that can be seen in the Figure 23.
(a) (b)
Figure 22 – Principal compressive stress state in the step number 9, from the south-west perspective, showing (a) the outer side of the walls and (b) the inner side of them, units in kPa.
For the ultimate state all the views are shown, to make the behaviour easier to understand. They correspond to the step number 19, and they can be seen in the Figure 23. The stresses at the bottom are much larger than in the previous steps and the diagonal stresses are more visible. It is also possible to notice the compressive diagonal stresses in the piers that cause their split. Also the punching stresses are larger than before and they affect every floor structure, not only to the first and second floor like in the step number 9. New stresses concentrations also appear and one example is the one in the interior part of the edges, due to the closing of the corner. The bending of the gabble walls is so large than new stresses appears at mid-height. They are reflected in the green patch visible in the Figure 23.
Step 19
(a) (b)
(c) (d)
Figure 23 - Principal compressive stress state: (a) N-E view inside (b) N-E view outside (c) S-W view outside and (d) S-W view inside, units in kPa.
4.3 N-S direction
In the Figure 24 the capacity curve for the north-south direction can be seen. The curve has a similar shape to the one in the east-west direction. The first branch corresponds to the almost linear behaviour, the second one to the more extensive stress redistribution and definition of a failure mechanism, and the third branch is almost ideal-plastic.
In the first branch it is seen that the stiffness in the north-south direction is higher than in the east-west direction. Images are shown in the point where the almost linear behaviour finishes, which is the step number 26 (Figure 25). The seismic coefficient is much higher than for the east-west direction, and the displacements are smaller. The difference of stiffness is due to the gabble walls, which do not have any opening and their stiffness is higher than the global stiffness of the façades.
The jump point between the second and the third branch, which can be considered a collapse point, is more obvious and drastic than for east-west direction. Some images (Figure 25 (b), Figure 26 (b) and Figure 27 (b)) are taken in this point, step number 31, where a sudden decrease of loads occurs with a displacement increase. The last branch is almost horizontal and some pictures (Figure 25 (c), Figure 26 (c) and Figure 27 (c)) are shown in the last point, step number 37.
Figure 24 - Capacity curve in N-S direction.
4.3.1 Deformed mesh (displacements) N-S direction
In the Figure 25 the deformed mesh in the steps 26, 31 and 37 is shown. The magnification factors are different in every step. The value is equal to 100 in the step number 26, 50 in the step number 31 and 20 in the step number 37. These graphics are also shown in Annex A.
The behaviour of the structure is obvious. The whole building is leaning, tending to move to the north, since the load is applied in this direction. The discontinuous lines help to see this leaning. It is easy to notice that the façades’ displacements are larger than those in the gabble walls. The dots lines mark those local displacements. This feature is in accordance with the stiffness of the walls, which is bigger for the gabble walls. However, it is mainly caused because the displacements of the façades are out-of-plane. It is also interesting to notice that, at the beginning, the most displaced points are not at the
0.0 0.1 0.2 0.3 0.4 0.5 0.6 0.7 0.00 0.01 0.02 0.03 0.04 0.05 0.06 0.07 0.08 0.09 0.10 Se ism ic c o e ff ic ie n t [α h] Displacement [m]