BJRS
RADIATION SCIENCES
07-03A (2019) 01-16ISSN: 2319-0612 Accepted: 2019-05-16
Criticality safety analysis of spent fuel pool for a PWR
using UO
2, MOX, (Th-U)O
2and (TRU-Th)O
2fuels
Achilles
J.P., Cardoso
F., Faria
V., Pereira
C., Veloso
M.
Federal University of Minas Gerais/Department of Nuclear Engineering, 31270-90, Belo Horizonte, MG, Brazil
email: claubia@nuclear.ufmg.br
ABSTRACT
A spent fuel pool of a typical Pressurized Water Reactor (PWR) was evaluated for criticality studies when it uses spent nuclear fuels. PWR nuclear fuel assemblies with four types of fuels were considered: standard PWR fuel,
MOX fuel, thorium-uranium fuel and reprocessed transuranic fuel spiked with thorium. The MOX and UO2
benchmark model was evaluated using SCALE 6.0 code with KENO-V transport code and then, adopted as a reference for other fuels compositions. The four fuel assemblies were submitted to irradiation using three operating cycles with burnup equal to 16 GWd/teHM. The burnup calculations were obtained using the TRITON sequence in the SCALE 6.0 code package. The fuel assemblies modeled use a benchmark 17x17 PWR fuel assembly dimensions. After irradiation, the fuels were inserted in the pool. The criticality safety limits were performed using the KENO-V transport code in the CSAS5 sequence. It was shown that mixing a quarter of
reprocessed fuel withUO2 fuel in the pool, it would not need to be resized
INTRODUCTION
There has been a continued interest in reprocessing nuclear fuels to recycle useful nuclear materials such as uranium, thorium, and plutonium [1]. Today, nuclear reactors operate mainly with uranium-plutonium cycle but since the beginning of nuclear power development, thorium was considered as an alternative fuel option for reactors [2].
Mixed Oxide (MOX), as well as thorium and transuranic spiked with thorium are alternatives to the Low-Enriched Uranium (LEU) fuel used in Light Water Reactors (LWRs). There has been a revival of interest in the use of thorium in light water reactors because its use in the nuclear fuel could provide longer life cycles and high burnup in the reactors while increasing in-repository durability [3]. Moreover, thorium is three times more abundant in nature compared to uranium and has an attractive potential for breeding to a fissile isotope [4]. On the other hand, in-reactor, MOX fuel behavior is similar to that of UO2 in terms of crystallographic, physical and neutronic
properties. Thus, MOX has been used to replace UO2 in thermal reactors [5].
The reactivity of nuclear fuel decreases with irradiation (or burnup) due to the transformation of heavy nuclides and the formation of fission products. Burn-up credit studies aim at accounting for fuel irradiation in criticality studies of the nuclear fuel cycle (transport, storage, etc.). Several benchmark exercises were conducted in order to compare computation tools used in this context [6]. In addition to MOX recycle, other non-proliferating reprocessing fuels such as Pu, U e Th-TRU(transuranic) has also been studied [7].
Recently, the interest in the thorium cycle has increased and many researches on thorium are carried out [11-14]. The purpose of this paper is to understand the magnitude and trends in the burn-up credit of three spent nuclear fuel (SNF); being mixed oxide, natural thorium and natural thorium with plutonium, as well as typically low-enriched uranium fuel, at same conditions. This approach is then used to calculate the criticality under spent fuel pool based on Angra 2 pool. This work aims to use the criticality safety parameter to investigate whether or not the Angra 2 pool size needs to be remodeling in case of using spent nuclear fuel as disposal.
MATERIALS AND METHODS
2.1. MOX and
UO2 Benchmark descriptionIn this paper, standard PWR fuel, mixed oxide (MOX), thorium (Th-U)O2 and transuranic fuel
spiked with thorium (TRU-Th)O2 froma typical Pressurized Water Reactor (PWR) were evaluated.
MOX and UO2 fuels compositions have been derived following Phase IV-B Burn-up Credit
Criticality benchmark [8].
The MOX fuel adopted from the Phase IV-B benchmark derived from the reprocessing of thermal reactor UO2 fuels.This exercise is based upon fuel compositions provided by the MOX
benchmark organizers and considered the impact of plutonium isotopic compositions in the MOX fuel, associated with first-generation MOX recycle. The MOX assembly pre-irradiation fuel composition is shown in Table 1.
Table 1: Initial MOX fuel compositions for given fuel pin (Atoms/barn.cm) [8].
The MOX fuel assembly geometry adopted is a 17 x 17 PWR fuel assembly with three enrichment zones as shown in Figure 1. The initial MOX enrichments for these zones are shown in Table 2 [8].
Nuclide High Medium Low Average (for
pin cell calculation)
U-234 2.5718E-07 2.6436E07 2.6789E-07 2.5952E-07
U-235 5.3798E-05 5.5300E-05 5.6040E-05 5.4287E-05
U-238 2.1194E-02 2.1786E-02 2.2077E-02 2.1387E-02
Pu-238 4.1677E-05 3.6128E-05 2.8473E-05 4.6610E-05
Pu-239 1.1259E-03 7.8717E-04 6.2038E-04 1.0156E-03
Pu-240 5.3500E-04 3.7403E-04 2.9478E-04 4.8255E-04
Pu-241 1.9392E-04 1.3557E-04 1.0685E-04 1.7491E-04
Pu-242 1.4636E-04 1.0233E-04 8.0644E-05 1.3201E-04
Figure 1: MOX fuel assembly [8].
Table 2: Initial MOX fuel enrichments from Phase IV-B benchmark [8].
MOX Fuel Case A MOX Fuel Enrichment,
w/o Pufissile/[U+Pu]
High 5.692
Medium 3.984
Low 3.142
Average 5.136
The UO2 fuel assemblies have an initial enrichment of 4.3 w/o 235U/U taken from Phase IV-B
exercise as well as a typical 17 x 17 PWR fuel assembly geometry. The composition of the UO2 fuel
is presented in Table 3 [8].
Table 3: Initial composition for 3.4w/o 235U/U UO2 fuel, from Phase IV-B exercise [8].
Nuclide Composition Atoms/barn.cm U-234 8.1248E-06 U-235 1.0113E-03 U-236 8.0558E-06 U-238 2.2206E-02 O 4.6467E-02
In Phase IV-B exercise, the same geometry related to a typical PWR assembly with 3.6568 m of height and 1.26 cm of pitch distance was adopted for MOX and UO2 fuels. The assembly
geometry with reflective boundary conditions was considered and no air gap between fuel and cladding is assumed. The 24 guide tubes and one instrumented tube were modelled as water-filled zircaloy-2 tubes. The assembly dimensions are presented in Table 4 [8].
Table 4: Fuel model parameters considering guide and instrumented tubes dimensions [8].
Parameter Dimension
Fuel pin pitch 1.26 cm
Fuel pin radius 0.475 cm
Fuel pellet radius 0.410 cm
Cladding thickness 0.065 cm
Guide tube outer radius 0.613 cm Guide tube inner radius 0.571 cm
Wall thickness 0.042 cm
A reduced-density zircaloy has been specified for the fuel pin cladding to take into account the air gap between the fuel and cladding. The guide tubes were also modelled using this reduced-density zircaloy composition as reported in the Phase IV-B benchmark. The non-fissile material compositions are specified in Table 5 [8].
Table 5: Non-fissile material compositions [8].
The benchmark validation for MOX and UO2 fuels was performed using KENO-VI sequence
making use of CSAS6 module in the SCALE6.0 code and ENDF/B-VII collapsed 238-energy-group library. The irradiation history was performed following Phase IV-B benchmark. The material temperatures are specified in Table 6 [8].
Table 6: Material temperatures.
Attempting to find a multiplication factor for thorium and thorium-transuranic fuels as close as possible to the MOX fuel multiplication factor, supplied by the benchmark, successive simulations using SCALE6.0 code with KENO-VI module and ENDF/B-VII collapsed 238-energy-group library were performed and the composition for (Th-U)O2 and (TRU-Th)O2 fuels were obtained.
After setting all assemblies composition, the fuels assembly were irradiated over three operating cycles, following Phase IV-B Burn-up Credit Criticality benchmark, two cycles consisting of 420 days full power with end of cycle (EOC) burnup equal to 16 GWd/teHM followed by 30 days
Nuclide Atoms/barn.cm
Zircaloy-2 (5.8736 g/cm³ - reduced density)
Zr 3.8657E-02 Fe 1.3345E-04 Cr 6.8254E-05 Coolant/moderator (600 ppm boro, 0.7245 g/cm³) H 4.8414E-02 O 2.4213E-02 10B 4.7896E-06 11B 1.9424E-05 Material Temperature (K) Fuel temperature 900 Cladding temperature 620 Coolant/moderator temperature 575
downtime, and one cycle consisting of 420 days full power with EOC burnup equal to 16 GWd/teHM. For the irradiation, SCALE 6.0 code with KENO-VI sequence and ENDF/B-VII collapsed 238-energy-group library was adopted.
After irradiation, all fuels assemblies shall be conveyed to a spent fuel pool (SFP), maintaining the system under the upper criticality limit of 0.95 [10]. The criticality was calculated using KENO-V sequences making use of CSAS5 module and v7-238-energy-group library, including bias and uncertainty.
RESULTS AND DISCUSSION
3.1. MOX and UO2 Benchmark Validation
The MOX and UO2 benchmark results were compared with the results obtained in this study
(DEN). Table 7 summarizes the three operating cycles (EOC 1, EOC 2 and EOC 3) taking into account the values obtained for kinf as well as Average (Ave), Standard Deviation (SD) and relative
Standard Deviation (RSD) calculations for the eight groups that contributed for MOX and UO2
benchmark and DEN value.
Table 7: kinf and reactivity change up for all benchmark participants and DEN.
Participant kinf
Relative difference in kinf
(%)
EOC 1 EOC 2 EOC 3 EOC 1 EOC 2 EOC 3
NUPEC 1.05978 1.00753 0.96100 0.19 0.45 0.63 CEA 1.05624 0.99968 0.94869 -0.14 -0.32 -0.66 GRS 1.05910 0.99909 0.94752 0.13 -0.38 -0.79 PSI 1.06088 1.00618 0.95837 0.30 0.31 0.35 BNFL 1.04976 0.99654 0.94974 -0.75 -0.64 -0.55 JAERI 1.05541 0.99749 0.95292 -0.22 -0.55 -0.21 DTLR 1.05900 1.00460 0.95100 0.12 0.16 -0.42 ORNL 1.06269 1.01166 0.96610 0.47 0.87 1.16 DEN 1.0567 1.0041 0.9598 0.10 0.11 0.50 Average Before 1.05786 1.00108 0.95442 After 1.05773 1.00298 0.95502 Stand.dev. Before 0.00402 0.00543 0.00667 After 0.003430 0.00455 0.00667 Stand.dev Before 0.38 0.54 0.70 (%) After 0.32 0.45 0.69
According to Table 7, the value obtained for kinf using the different library with KENO-VI
sequence is within the range of value obtained by other institutions, validating thus, the procedure adopted. In the Phase IV-B benchmark, a kinf =1.1540 ± 0.0037 was verified for MOX fuel while in
this study, an initial kinf =1.1517 ± 0.0033 was obtained, ensuring benchmark validation. In the same
benchmark an initial kinf=1.3312 ± 0.0044 was found for the standad UO2 fuel and the composition
that gives this kinf was used in this paper.
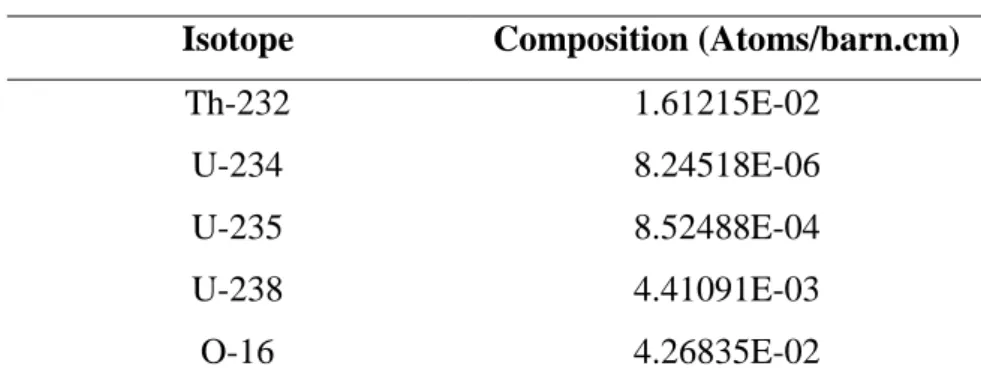
3.2. Th-UO2 and TRU-ThO2 Fuels
For thorium fuel, a mixture at 94% of theoretical density consisting of 75w/o Th and 25w/o U on a heavy metal basis latter enriched to 16 w/o U-235 giving an overall enrichment of 3.985 w/o U-235 in total heavy metal was adopted. It was found the pre-irradiation composition for the Th-UO2 fuel assemblies which provided an initial kinf =1.1587 ± 0.0036, using the same assembly
geometry adopted for MOX fuel. The pre-irradiation fuel composition obtained is shown in Table 8.
Table 8: Initial composition for 16 w/o 235U/U (Th-U)O2 fuel
Isotope Composition (Atoms/barn.cm)
Th-232 1.61215E-02
U-234 8.24518E-06
U-235 8.52488E-04
U-238 4.41091E-03
O-16 4.26835E-02
For the reprocessed transuranic fuel spiked with thorium, denominated (TRU-Th)O2,
characterization, the composition of the UO2 fuel of a typical PWR, with initial enrichment of 3.1%
with 33 GWd/tonHM of burnup, after 5 years in cooling pool was considered. Then, it was theoretically reprocessed by UREX+ reprocessing technique, a non proliferation reprocessing technique, that proposes the uranium and actinides co-extraction. The first stage involves the recuperation of uranium, plutonium and neptunium by extraction in 16 steps with 19% TBP in kerosene diluent and organic-to-aqueous ratio (O/A) equal to 3. With this stage, 99.99% U, 99.9% Pu, and 95% Np, beyond 0.1% of Am and Cm are recovered. There is also some contamination
with these removals: 1.2% Ru, 1.6% Zr, 0.2% Ce and 0.1% Nd [9]. The reprocessed fuel was then spiked with Th-232 and the amount of fissile material contained therein being varied; starting at 1% and increasing to 30% in order to obtain the infinite neutron multiplication factor as close as possible of the MOX fuel benchmark. Table 9 represents the initial thorium-transuranic fuel composition. TRU-ThO2 fuel also uses Phase IV-B exercise assembly dimensions.
Table 9: Initial (TRU-Th)O2 fuel compositions atoms/barn.cm
Isotope Composition Isotope Composition
Th-232 2.185E-02 Pu-240 8.586E-04
Np-235 2.286E-14 Pu-241 4.638E-02
Np-236 5.315E-11 Pu-242 2.426E-04
Np-237 1.343E-04 Pu-244 5.706E-09
Np-238 5.217E-14 Am-241 1.414E-04
Np-239 3.337E-11 Am-242m 3.770E-07
Pu-236 6.273E-09 Am-243 5.279E-05
Pu-237 2.874E-21 Cm-242 1.078E-07
Pu-238 7.066E-05 Cm-243 5.728E-06
Pu-239 2.058E-03 Cm-244 4.306E-04
The (TRU-Th)O2 fuel composition was obtained after successive simulations and verified that a
43 w/o spiked with thorium , would give an overall fissile material of 10 w/o in this fuel and an initial kinf=1,1531 ± 0.0041, the closest value of the initial MOX benchmark kinf.
3.3. Fuels Assemblies
Once that MOX, (Th-U)O2 and (TRU-Th)O2 fuels have the initial kinf values close to each other,
and equal to 1.15, the four assemblies were then irradiated in a PWR core unit using the same three operating cycles previously described from Phase IV-B Burn-up Credit Criticality benchmark. Figure 2 represents the four assemblies simulated and Table 10 summarizes the pre-irradiation kinf
Figure 2: Fuel elements geometry adopted for Spent Fuel Pool criticality analysis. a) MOX, b)
(Th-U)O2, c) (TRU-Th)O2 and d) UO2.
a) b) c) d)
Table 10: Initial kinf obtained for the four cases fuel.
Fuel Pre irradiation kinf
MOX 1.1517 ± 0.0033
(Th-U)O2 1.1587 ± 0.0036
(TRU-Th)O2 1.1531 ± 0.0041
UO2 1.3312 ± 0.0044
3.4. Burnup Calculation
In order to preserve maximum accuracy during the depletion calculation, for (Th-U)O2 and
(TRU-Th)O2 fuels, the legacy addnux value of 3 has been included. TRITON allows the user to
determine the set of nuclides added to the combustible material by means of control parameter parm = (addnux = N), where N is an integer 0 ≤ N ≤ 3. In N = 3, 166 nuclides are added, adding a total of 232 allowing a more detailed configuration. At these high burnup levels, these nuclides have a small effect on the neutron spectrum of the system but generally contribute to the overall reactivity of the system. Figure 3 shows the criticality curves plotted considering the 3 cycles for all the investigated fuels.
Figure 3: kinf considering the 3 cycles for a single assembly irradiated in PWR reactor.
UO2 fuel has a significant concentration of U-238 and U-235. In U-238 and U-235 chain decay
there are no other fissile materials which explains the rapid decrease of UO2 fuel curve. Although
(Th-U)O2 fuel has a high concentration of Th-232, achieving 75%, and the consequent produce of
U-233, a fissile material, it has also a considerable concentration of U-238 and U-235 (20.61 and 3.985% respectively) which do not give rise to new fissile materials, ensuring a steep incline, but not as much as the curve of UO2 fuel. MOX fuel, in reverse, it is a low-enriched uranium (LEU)
fuel with only 0.233% of U-235 and 5.344% on fissile material. The presence of fissile material such as Pu-239 makes possible the chain reaction maintenance, ensuring a smooth curve for this fuel. (TRU-Th)O2 fuel is spiked with thorium, so it has 82.72% of Th-232, this isotope can absorb
neutrons and become U-233. This fact, added to any presence of uranium in this fuel, contribute for the smoother inclination of the curve.
kinf 0,8 0,9 1 1,1 1,2 1,3 1,4 Burnup (GWd/ teHM) 0 6 12 18 24 30 36 42 48
kinf UO2 fuel
kinf (TRU-Th)O2 fuel kinf (Th-U)O2 fuel kinf MOX fuel
The above mentioned results suggest that the thorium-transuranic fuel still have burnup potential after the 3 cycles.
The composition, after burnup, containing the mainly nuclides for all fuels assemblies studied are shown in Table 11.
Table 11: Fuel’s Composition after burnup (atom/barn.cm). Composition after irradiation in PWR reactor
Nuclide MOX Fuel (Th-U)O2 Fuel (TRU-Th)O2 Fuel UO2 Fuel
U-232 1.837E-11 1.209E-06 1.269E-06 2.226E-11
U-233 2.494E-11 2.509E-04 3.528E-04 9.687E-11
U-234 1.024E-06 3.911E-05 2.659E-05 4.108E-06
U-235 2.663E-05 2.442E-04 4.083E-06 2.082E-04
U-236 6.241E-06 1.358E-04 4.611E-07 1.412E-04
U-237 2.063E-06 1.498E-07 5.932E-10 2.215E-06
U-238 2.067E-02 3.989E-03 1.662E-09 2.141E-02
Pu-238 3.848E-05 4.423E-06 1.509E-04 6.848E-06
Pu-239 5.195E-04 4.684E-05 5.956E-04 1.491E-04
Pu-240 4.188E-04 1.620E-05 7.951E-04 6.563E-05
Pu-241 2.341E-04 1.504E-05 4.168E-04 4.070E-05
Pu-242 1.530E-0-4 6.509E-06 2.961E-04 1.750E-05
Th-232 3.680E-13 1.555E-02 2.130E-02 9.495E-12
Th-230 1.565E-12 1.667E-08 4.085E-08 3.947E-11
Am-242m 5.541E-07 5.501E-07 5.068E-06 3.029E-08
Xe-135 3.986E-10 6.631E-10 4.550E-10 3.480E-10
3.5. Spent fuel pool criticality
The pool model used in this study was based on the cooling pool described in the Angra 2, Final Safety Analysis Report - FSAR (2013) [10]. The pool’s dimensions are 15.914 x 5.668 m and 11.6568 m depth. The criticality safety analysis considers the minimum boron concentration of 2300 ppm specified in FSAR and required for spent fuel pool [10]. It was important to evaluate the criticality under spent fuel pool conditions for these four fuels individually, considering the fuel assemblies at 298 K once that at this temperature would be expected the higher multiplication factor possible due to the Doppler effect.
The minimum pitch distance in the SFP was found using KENO-V sequences making use of CSAS5-S module in the SCALE 6.0 code. It was verified that a 0.695cm pitch distance would
maintain the criticality under the upper criticality limit of 0.95 and assure the maximum elements’ capacity in the SFP maintain the sub criticality. Figure 4 illustrates the SFP filled in with its entirely capacity.
Figure 4: Spent fuel pool using Angra 2 FSAR (2013) as a model.
Aiming to make a close analysis of the nuclear power plants and to ensure a safety project, two different load patterns were designed for assemblies while into the pool. In a first moment, an uniform configuration was adopted with just a single type of fuel. In a second instance, the reprocessed fuels or (Th-U)O2 fuel were placed together with the standard fuel into the SFP taking
into consideration a ratio of 1:3, correlatively. Figure 5 shows mixed distribution for the assemblies in the SFP.
Figure 5: 1:3 ratio configuration for SFP using MOX ,(Th-U)O2 or (TRU-Th)O2 with standard
UO2 fuel. MOX/(Th-U)O2/(TRU-Th)O2 Fuels Standard Fuel
Table 12 summarizes the kinf values for the fuels in the pool containing only one type of fuel
and kinf for the mixed spent fuel pool using the reprocessed fuels (MOX, (TRU-Th)O2) or (Th-U)O2
fuel with the standard PWR UO2 fuel .
Table 12: kinf when the fuel assemblies were inserted into the pool.
Only one fuel in pool
kinf Mixed-pool (𝟑⁄𝟒UO2) kinf
MOX 0.84409 ± 0.00032 ¼ MOX 0.81084 ± 0.00027
(Th-U)O2 0.64962 ± 0.00022 ¼ (Th-U)O2 0.75507 ± 0.00023
(TRU-Th)O2 0.93698 ± 0.00028 ¼ (TRU-Th)O2 0.85139 ± 0.00026
UO2 0.78256 ± 0.00029 -- --
The values for multiplication factor showed in Table 11 are in accordance with curves plotted in Figure 3 once that follow the same kinf descending order.
Fill the UO2 fuel in a mixed spent fuel pool, together with MOX or (TRU-Th)O2 fuels, made the
criticality decrease 3.939% and 9.135% respectively. Even though criticality has increased on 13.97% when UO2 fuel assemblies were inserted with (Th-U)O2 fuel assemblies in the pool, for all
three cases of mixed spent fuel pool a ksafe ≤ 0.95 remains guaranteed as established by Angra 2,
Final Safety Analysis Report [10].
CONCLUSION
The results presented in the MOX benchmark were firstly validate and then compared with the results obtained from the simulations performed in this work. This study demonstrated the possibility of insertion of spent fuels based on transuranic elements and spiked with thorium in a PWR core as it extends the burning, decreases radioactive waste and decreases the risk of proliferation. The insertion of the fuels in the pool showed that the system remains subcritical. It was shown that by using a quarter of reprocessed fuel in the mixed spent fuel pool, the dimensions of the pool would not need to be modified.
ACKNOWLEDGMENT
The authors are also grateful to Brazilian research funding agencies, CNEN – Comissão Nacio-nal de Energia Nuclear (Brazil), CNPq – Conselho NacioNacio-nal de Desenvolvimento Científico e Tec-nológico (Brazil), CAPES – Coordenação de Aperfeiçoamento de Pessoal de Nível Superior (Bra-zil) and FAPEMIG – Fundação de Amparo à Pesquisa do Estado de Minas Gerais (MG/Bra(Bra-zil) for the support. Furthermore, we are also grateful to sponsors and donor volunteers for their support of this event.
REFERENCES
[1] A. G. Croff and S. L. Krahn, Comparative Assessment of Thorium Fuel cycle radiotoxicity, Nuclear technology, Vol. 194, pp271-280, Nashville (2016)
[2] OECD-NEA, 2015. Introduction of Thorium in the nuclear fuel cycle, short-to long term considerations.
[3] K. D. Weaver et al., A PWR Thorium Pin Cell Burnup Benchmarck, INEEL-/CON 2000-00227, Idaho National Laboratory, 7-11 may, USA (2000).
[4] M. Ding and J. L. Kloosterman, Thorium utilization in a small long-life HTR. Part I: Th/U MOX fuel blocks, Nuclear Engineering and Design, Vol. 267, pp. 238–244 (2014).
[5] S. Yatabe et al., Canadian experience in irradiation and testing of MOX fuel, Journal of Nuclear Materials, Vol. 502, pp. 177-190, Canada (2018).
[6] International Atomic Energy Agency, Spent Fuel Reprocessing Options, IAEATECDOC-1587, IAEA, 144 pp, Vienna (2008).
[7] F. B. A Monteiro et al., Micro Heteregeneous Approaches for the Insertion of Reprocessed and Combined Thorium Fuel Cycles in a PWR System, MRS Proceedings, v. 1814, (2016) [8] G. J. O’Connor and P. H. Liem, Burn-up Credit Criticality benchmarck Phase IV – B: Results and Analysis of MOX Fuel Depletion Calculations, Nuclear Energy Agency, France (2003).
[9] S. Cota and C. Pereira; Neutronic Evaluation of the Nonproliferating Reprocessed Nuclear Fuelsin Pressurized Water Reactors, Annals of Nuclear Energy, Grã-Bretanha, v. 24, n. 10, p. 829-834, (1997)
[10] Eletrobras Eletronuclear, FSAR - Final Safety Analysis Report - Central Almirante Álvaro Alberto - Unit 2,( 2013).
[11] R.C. Lopez-Solis et al., Fuel depletion analysis of a small sodium fats reactor with KANEXT and SERPENT, Ann. Nuclear EnergyVo. 98, pp. 26-35, (2016)
[12] N. R. Brow et al., Sustainable thorium nuclear fuel cycles: a comparision of intermediate and fast neutron spectrum systems, Nuclear Engineering and design, Vol 289, pp. 252-265. [13]A. B. Lindley et al., Thorium breeder and burner fuel cycles in reduced-moderation LWRs compared to fast reactors, Progress in Nuclear Energy, Vol. 77, pp. 107-123, (2017).
[14] M. A Mohamed, Nader et al., Use of thorium-plutonium MOX in the inner pins of CANDU fuel bundles, Progress in Nuclear Energy, Vol. 91 pp. 49-55, (2016).
![Table 1: Initial MOX fuel compositions for given fuel pin (Atoms/barn.cm) [8].](https://thumb-eu.123doks.com/thumbv2/123dok_br/18278315.881348/3.892.137.754.618.872/table-initial-mox-fuel-compositions-given-fuel-atoms.webp)
![Figure 1: MOX fuel assembly [8].](https://thumb-eu.123doks.com/thumbv2/123dok_br/18278315.881348/4.892.180.685.110.643/figure-mox-fuel-assembly.webp)
![Table 4: Fuel model parameters considering guide and instrumented tubes dimensions [8]](https://thumb-eu.123doks.com/thumbv2/123dok_br/18278315.881348/5.892.266.626.390.637/table-fuel-model-parameters-considering-guide-instrumented-dimensions.webp)
![Table 5: Non-fissile material compositions [8].](https://thumb-eu.123doks.com/thumbv2/123dok_br/18278315.881348/6.892.244.647.176.518/table-non-fissile-material-compositions.webp)