THIS
DOCUMENT
IS
NOT
AN
INVESTMENT
RECOMMENDATION
AND
SHALL
BE
USED
EXCLUSIVELY
FOR
ACADEMIC
PURPOSES
(SEE DISCLOSURES AND DISCLAIMERS AT END OF DOCUMENT)See more information at WWW.NOVASBE.PT Page 1/30
M
M
M
A
A
A
S
S
S
T
T
T
E
E
E
R
R
R
S
S
S
I
I
I
N
N
N
F
F
F
I
I
I
N
N
N
A
A
A
N
N
N
C
C
C
E
E
E
E
E
E
Q
Q
Q
U
U
U
I
I
I
T
T
T
Y
Y
Y
R
R
R
E
E
E
S
S
S
E
E
E
A
A
A
R
R
R
C
C
C
H
H
H
EDP’s regulated nature (electricity contracted generation, special regime, CMEC’s, electricity and gas distribution, electricity supply of last resource and renewables regulation) allows the company to maintain stable and relatively predictable cash flows. Nevertheless, its exposure to changes in regulation is a risk factor in EDP’s profile.
Some of the areas operated by the company are only economically viable given the existing regulation (subsidies granted
to renewable energies, special regime production, CMEC’s).
However, such regulation may translate into market inefficiencies and distortions.
Its presence in Brazil is a strong growth driver, given the shortage of electric energy in this country, which will have to grow fast to meet the increasing demand and the economic development.
The present economic scenario, namely the entry of the International Monetary Fund in Portugal, and the upcoming
economic recovery measures may reduce incentives given to EDP’s
generation, specifically in wind and special regime production.
Moreover, the company has suffered an increase in its cost of debt of 20% (from 4% in 2010 to 4.99% in May 2011 according to our calculations), due in part to a positive but not direct relation with the Portuguese Government Bond Yields (the 5-year maturity bond rose from 3.1% to 11.3% in the same period). To conclude, EDP´s Debt is around 10% of Portuguese GDP – about 168.1 Bn.
Company description
EDP Energias de Portugal is a Portuguese electricity and gas operator listed in the Lisbon Stock Exchange and present in the Iberia Peninsula. It also holds operations in the renewable energy sector in USA, Central Europe, Brazil and Iberian Peninsula. Moreover, with EDP Energias do Brasil it is now a player in the Brazilian electricity market. The markets where these operations take place are both regulated and liberalized.
“
EDP
E
NERGIAS DE
P
ORTUGAL
”
C
OMPANY
R
EPORT
“
E
LECTRIC
U
TILITIES
”
6
M
AIO2011
S
TUDENT
:
“
A
NA
F
ERNANDES
”
[email protected]
EDP
–
Back Foot
Recommendation: BUYPrice Target FY11: 3.02 €
Price (as of 6-Jun-11) 2.56 €
Reuters: EDP.LS, Bloomberg: EDP PL
52-week range (€) 2.38-2.92
Market Cap (€m) 9,945.78
Outstanding Shares (m) 3,656
Source: EDP website
Source: Euronext
(Values in € millions) 2010 2011E 2012E
Revenues 14,171 15,299 17,342
EBITDA 3,613 3,089 3,501
Net Profit 1,235 1,295 1,543
EPS 0.34 0.35 0.42
“EDP ENERGIAS DE PORTUGAL” COMPANY REPORT
THIS
DOCUMENT
IS
NOT
AN
INVESTMENT
RECOMMENDATION
AND
SHALL
BE
USED
EXCLUSIVELY
FOR
ACADEMIC
PURPOSES
(SEE DISCLOSURES AND DISCLAIMERS AT END OF DOCUMENT)z
PAGE 2/30
Table of Contents
VALUATION ... 4
SUM OF THE PARTS ... 4
WACC ... 5
Cost of debt ... 5
Cost of equity ... 5
ENERGY OUTLOOK ... 6
ECONOMIC SCENARIO ... 8
COMPANY OVERVIEW ... 9
COMPANY DESCRIPTION ... 9
SHAREHOLDER STRUCTURE ... 10
IBERIAN OPERATIONS ...11
GENERATION ... 11
Hydro ... 12
Thermal ... 13
CMEC’s ... 14
Special Regime Production ... 15
Conventional Regime Production ... 16
MIBEL ... 17
DISTRIBUTION ... 17
SUPPLY ... 18
GAS ... 19
EDB ENERGIAS DO BRASIL ...20
FOREX IMPACT ...22
EDP RENOVÁVEIS ...22
FOOD FOR THOUGH ...25
SUM OF THE PARTS ...26
FINANCIALS ...27
APPENDIX ...28
FINANCIAL STATEMENTS ...28
“EDP ENERGIAS DE PORTUGAL” COMPANY REPORT
THIS
DOCUMENT
IS
NOT
AN
INVESTMENT
RECOMMENDATION
AND
SHALL
BE
USED
EXCLUSIVELY
FOR
ACADEMIC
PURPOSES
(SEE DISCLOSURES AND DISCLAIMERS AT END OF DOCUMENT)z
PAGE 3/30
Executive summary
EDP Energias de Portugal is a Portuguese electric utility, listed in the Lisbon Stock exchange. It operates in the electricity generation, distribution and supply in Portugal, Spain and Brazil (through EdB Energias do Brasil), gas distribution and supply in Portugal and Spain and in the renewable sector, namely with its wind operator, EDP Renováveis, present in Portugal, Spain, Central Europe, Brazil and USA.
EDP’s business strategy relies on three main pillars: focused growth: the
company maintains a strong investment in hydro and wind, with a 3,5 GW hydro pipeline and several developing plants, which makes it the company with higher development in hydro in Europe, and ranking #3 in wind capacity worldwide;
Moreover, the significant share of Brazilian operations in EDP’s portfolio, gives it
great exposure to a fast growing market; High efficiency: both in terms of operations and costs, given that EDP invests in longer useful life generating plants, with lower replacement and maintenance needs, and reduced CO2
emissions. More so, EDP’s Opex plan aims at the reduction of operating
expenses, with a target of Operating Expenses over Gross profit of 27% for 2012 (see Graph 1); Controlled risk: high reliance on regulated and stable cash flows (85% of EBITDA from regulated business segments or contracted activities), diversification of business and geographic areas and operations financially covered until 2012.
The economic scenario faced by EDP brings much challenge, as the Portuguese economy is now in a downturn. In fact, the national level of indebtness has reached historical levels and the political instability has brought the Portuguese
state to ask for external help. The impact on EDP’s cost of debt has already been
felt, as in March 2011 the credit rating agency S&P downgraded the company to BBB. The Spanish economy presents the same problems, even though not as deep as in Portugal. The Spanish public debt also suffered a downgrade, as have 30 Spanish financial institutions (whose problem tightens with the lack of capital associated with these banks). However, there are also opportunities, for instances in Brazil, which is a fast growing market, with great potential for expansion (boost of population and strong and stable correlation between energy consumption and GDP growth increases the potential market – Graph 2, 3). The possible sale of up to 14% of EdB (EDP will maintain the control with 50.1% of the capital) should be seen as a way of reducing Net Debt, an opportunity to bring new and valuable shareholders (possibly Eletrobras and China Power Strategic planning
EDP’s operations
Graph 2 –GDP and Population
Source:Energy International Agency
0,0 200,0 400,0 600,0 800,0 1000,0 1200,0 1400,0 1600,0 1800,0 2000,0 184,0 186,0 188,0 190,0 192,0 194,0 196,0 198,0 200,0 202,0 200820092010201120122013201420152016 G D P , bi ll ion s P op ul a ti on , m il li on s
Brazil - key figures GDP constant prices
Population
Graph 1 –Operating Expenses over Gross
Profit for EDP and competitors
Source:EDP, Iberdrola and Endesa Annual Reports
Graph 3 – Energy to GDP in Brazil
“EDP ENERGIAS DE PORTUGAL” COMPANY REPORT
THIS
DOCUMENT
IS
NOT
AN
INVESTMENT
RECOMMENDATION
AND
SHALL
BE
USED
EXCLUSIVELY
FOR
ACADEMIC
PURPOSES
(SEE DISCLOSURES AND DISCLAIMERS AT END OF DOCUMENT)z
PAGE 4/30 International) and a business opportunity (market expects a sale 35% above the current price).
For the valuation of EDP, we used a Sum Of The Parts model, to explore and
study separately each of the company’s businesses and their different profiles. Each business unit was valued through a Discounted Cash Flow model, resulting in a Free Cash Flow, which was discounted at a Weighted Average Cost of
Capital (that takes the company’s capital structure into account). The values
obtained were then added up to achieve EDP’s Enterprise Value, resulting in a target price for 2011 year end of 3.02€, which is translated in a 18% return, considering the current price per share.
Valuation
Sum Of The Parts
EDP is composed by several business areas, which operate under very different conditions:
- subsidiaries separately listed;
- mature business segments with less risks associated with their cash flows; - new investments;
For the valuation of EDP we have used a Sum Of The Parts valuation model, given the existence of several operational segments in this company, that are fairly different in terms of operations, regulation and risk profile. Considering this diversified nature of EDP, we studied each business area separately and summed up the Enterprise values of each one of them, considering annual Free Cash Flows up to 2016 and computing perpetuity afterwards. Note that, as we explore each area as one independent company, we also consider the different risk profile they assume, so we can adapt to the specificities of each business. For that reason, we have different risk measures for each business unit (betas) and not for EDP as a whole. The advantage of this model is that it enables one to assess the contribution of each segment to the company as a whole.
“EDP ENERGIAS DE PORTUGAL” COMPANY REPORT
THIS
DOCUMENT
IS
NOT
AN
INVESTMENT
RECOMMENDATION
AND
SHALL
BE
USED
EXCLUSIVELY
FOR
ACADEMIC
PURPOSES
(SEE DISCLOSURES AND DISCLAIMERS AT END OF DOCUMENT)z
PAGE 5/30
discounting them to achieve each unit’s Enterprise Value and then deducting Net
Debt and minorities to obtain the Equity Value. We used real prices and rates and all Free Cash Flows are in Euro currency.
WACC
The discount rate used to discount the cash flows is the Weighted Average Cost of Capital. The cash flows obtained represent the Free Cash Flows to the Firm, as we used the cash flows before paying any interest (before considering the existence of debt in the company capital structure). For this reason, when discounting the cash flows, one needs to consider all the stakeholders of this cash flow to the firm. This usually includes debtholders and equityholders.
Cost of debt
Cost of debt represents the opportunity cost that bondholders demand to be paid by EDP to have EDP´s debt at a certain moment in time. One way to determine EDP’s cost of debt is to compute an average of the different current yields in each debt issue it has (for this, we equal the price of the bond in the market to their future cash flows discounted at the yield rate) and weight it with their respective nominal values. Taking EDP’s debt nominal values, coupons (both bond issued and bank loans) and current yields we get a cost of debt of 5.42%. Another way to determine this cost of debt is to take a risk free rate and add the default spread associated to a company with the same credit rating as EDP. According to S&P, the credit rating of EDP, BBB, has a default risk associated of 1.60%. Using as risk free rate the 5-year German bond (because it is default free and its maturity does not contain reinvestment risk) we get a debt cost of 4.56%. Averaging the results obtained with both approaches we get a debt cost of 4.99%
Cost of equity
“EDP ENERGIAS DE PORTUGAL” COMPANY REPORT
THIS
DOCUMENT
IS
NOT
AN
INVESTMENT
RECOMMENDATION
AND
SHALL
BE
USED
EXCLUSIVELY
FOR
ACADEMIC
PURPOSES
(SEE DISCLOSURES AND DISCLAIMERS AT END OF DOCUMENT)z
PAGE 6/30 We preferred this approach, as a way of also taking into account, the effect of macroeconomic variables.
In this case, to obtain EDP’s beta (to measure how EDP’s stock returns react to
market variations), we ran regressions of several electric utilities sock returns to the market returns (we used the Eurostoxx 600 index to have a reasonable base for comparison of these companies), to figure the beta of each of those assets (table 1). We then performed beta shrinkage to reduce the estimation error, by using a weighted average of the betas obtained by the regressions and the market beta (which is 1). By doing this, we consider the fact that all agents operating in the market tend to react according to that market, in one way or another, which translates into the fact that the betas of the companies operating in the market tend to the market beta, in the long-run.
For the risk free rate, we used the German Bund with a five-year maturity, because it is the one with less default risk associated and also because most of EDP´s cash flows are in Euros. Also, the maturity of 5-years was chosen since our chosen risk free has to be reinvestment risk free, meaning that if we used a short-term maturity, such as one month, there would be the risk of not being able to invest at the same rate after one month. A five-year maturity gives us more stability. Also, this valuation is assuming long term cash flows and therefore it would not make sense to use a short term risk free rate.
As for the market premiums, the historical standard interval is 4 to 6% and we assumed a value in between of 5% (even though a current implied Market Premium – forward looking rate considering current expected cash flows in all stocks - would be significantly lower). Still, the fact that EDP is a Portuguese based company brings additional risks, since Portugal now faces great political, economic and financial turmoil. This represents an additional risk for Portuguese companies (see graph 4 on the correlation of Portugal´s Republic CDS and EDP CDS values). Because of this, we added a country risk premium, calculated by subtracting the 5-year Portuguese Government Bond Yield to the German one (since the difference is assumed to be the default risk of that specific country).
Energy Outlook
The world energy consumption tends to increase, as population grows fast and societies develop themselves with resource to energy. As population growth and society development are sharper in non-developed countries, it is expectable that
Graph 4 – 5 Year CDS Portugal and EDP
Source:Bloomberg
Table 1 – Industry Betas
Industry Betas
EDP 0,66 EDPR -0,06 Endesa 0,82 Iberdrola 1,04 Iberdrola
Renovables 0,80 Enagás 0,64 Naturgas 0,83 Union Fenosa 0,25 REE 0,67 REN 0,47
“EDP ENERGIAS DE PORTUGAL” COMPANY REPORT
THIS
DOCUMENT
IS
NOT
AN
INVESTMENT
RECOMMENDATION
AND
SHALL
BE
USED
EXCLUSIVELY
FOR
ACADEMIC
PURPOSES
(SEE DISCLOSURES AND DISCLAIMERS AT END OF DOCUMENT)z
PAGE 7/30 in those countries, energy consumption will grow faster, given the existence of a gap they have to overcome to reach the living standards of developed countries. Furthermore, the share of each energy source in the contribution for energy generation will also evolve differently (graph 5). While social pressure towards a more sustainable and cleaner approach to energy production favours the political acceptance and investment in renewable sources, technical and economic issues (such as intermittence of production and high prices) will allow for an increase in energy generation from natural gas and coal (widely used in industry production). The recession that hit the world economy brought down the levels of energy consumption due to the slowdown on economic activity (production and consumption fell). Energy prices also went down, as the demand decreased. However, as the economy recovers, these levels start to pick up, and the natural trend is for energy demand to increase in the future, as well as energy prices (see graph 6).
The security of energy supply in the future may also trend in an opposite direction as the one of today, since China´s external politics of supporting corrupt governments in exchange for energy commodities easy access may boost intra country instability. Furthermore, the disaster of Fukushima may prevent public opinion of allowing more nuclear power plants centrals, which will in the long term, create more pressure on energy prices such as oil and coal. In the short term, nuclear energy shortage and Middle East political and social upward tensions (several oil companies, such as Shell in Libya were forced to cease their operations and BP is reassessing its expansion plans) have brought gas and oil prices to sudden increase due to fears of energy shortages.
In the case of Brazil, the country experiences a sharp population expansion and a much accelerated economic development. Such increases only come with a boosting demand for energy. However, the installed generation capacity is not enough to match this increasing demand, and the country experiences energy
shortages. To overcome such shortages, the country’s national energy agency
(ANEEL) has proposed a tariff and consumption plan, in which for different hour consumptions, different prices are charged. This would smooth the consumption levels during the day and avoid blackouts. Such an approach may be an opportunity for electric utilities operating in this country, as they can easily smooth their electricity production along the day hours, avoiding generation pauses and picks.
Graph 5 – World Traded Energy by source
Source:Energy International Agency
0 50 100 150 200 250
1990 200020072015 2025 2035
E n e rg y u se i n q u a d ri ll io n B tu
World marketed energy use by fuel type, 1990-2035 Liquids Natural Gas Coal Nuclear Renewables
Graph 6 – World Oil Prices Forecast
Source:Energy International Agency
0 50 100 150 200 250
1990 2000 2009 2015 2025
W or ld oi l pr ic e s in 2 0 0 7 dol la rs pe r ba rr e l
World oil prices in three Oil Price cases, 1990-2035
“EDP ENERGIAS DE PORTUGAL” COMPANY REPORT
THIS
DOCUMENT
IS
NOT
AN
INVESTMENT
RECOMMENDATION
AND
SHALL
BE
USED
EXCLUSIVELY
FOR
ACADEMIC
PURPOSES
(SEE DISCLOSURES AND DISCLAIMERS AT END OF DOCUMENT)z
PAGE 8/30
Economic Scenario
As we can see in Graph 7, EDP has a geographical distribution strongly concentrated in Portugal, Spain, Brazil and the USA (where 51% of the Installed Capacity of EDPR is in). Therefore these countries’ economic outlook is relevant for EDP. By analyzing Graph 8, we conclude for a significant deterioration of Public Finances after 2007. In Portugal, adding to the serious problem on Governmental Debt, we can see through table 2 that GDP forecasts are negative until 2012. The political and social instability has brought to the country a financial aid package lead by the IMF, which will strongly intervene in government expenses and social benefits but also promoting the privatization of several companies, mainly EDP in which the government has a share of 25.7%. Portugal is seeing its bond rates hedging higher and its rating dropping (example from A- to BBB by S&P). Spain suffers from similar structural economic problems as Portugal (such as lack of competitiveness); it has extremely high unemployment rates (above 20% until 2013) and has suffered a contagion effect (as we can see by its CDS on a 5-year maturity increasing to 216 bp in 05/01/11). Brazil is an economy in clear expansion. The new president Rousseff has continued the policies of its predecessor, mainly to what concerns social programs for example in the global access to education or water and energy. The markets estimate a pressure on the Balance Current Account (graph 9).
Moreover, the USA will most likely have to proceed to a fiscal consolidation in the next years. Still, GDP growth will remain above Europe´s average. The 2012 elections may represent a risk for EDPR since in case a republican candidate wins, the government support through subsidies will most likely decrease. The economic projections for countries where EDP operates are as follows:
2010 2011 2012 2013 2014 2015 2016
Portugal Real GDP 1.40% -1.50% -0.50% 1.20% 1.20% 1.20% 1.20% Inflation 1.40% 2.40% 1.40% 1.80% 1.80% 1.80% 1.80%
Spain Real GDP –0.1% 0.80% 1.60% 1.70% 1.70% 1.70% 1.70% Inflation 2.00% 2.60% 1.50% 1.80% 1.80% 1.80% 1.80%
USA Real GDP 2.80% 2.80% 2.90% 2.70% 2.70% 2.70% 2.70% Inflation 1.60% 2.20% 1.60% 2.00% 2.00% 2.00% 2.00%
Brazil Real GDP 7.50% 4.50% 4.10% 4.20% 4.20% 4.20% 4.20% Inflation .00% 6.30% 4.80% 4.50% 4.50% 4.50% 4.50% Table 2 – World Economic Outlook, April 2011, IMF
Graph 7 – Geographical Distribution of EDP
Source:EDP, Data for 2010
Graph 8 – Government Debt to GDP
Source: IMF Economic Outlook 2010
Graph 9 – Balance on Current Account Brazil
“EDP ENERGIAS DE PORTUGAL” COMPANY REPORT
THIS
DOCUMENT
IS
NOT
AN
INVESTMENT
RECOMMENDATION
AND
SHALL
BE
USED
EXCLUSIVELY
FOR
ACADEMIC
PURPOSES
(SEE DISCLOSURES AND DISCLAIMERS AT END OF DOCUMENT)z
PAGE 9/30
Company overview
Company description
EDP is an electric utility operating in the electricity generation, distribution and supply, and gas distribution and supply in Portugal and Spain. EDP operates both in the regulated and liberalized markets in Iberia, which are regulated by ERSE (Entidade Reguladora dos Serviços Energéticos) in Portugal and CNE (Comisíon Nacional de Energía) in Spain. It is listed in PSI 20 (weight of 13,3%), PSI Geral (weight of 16,2%), DJ Eurostoxx, DJ Eurostoxx Utilities, DJ Stoxx 600, Euronext Top 100, S&P Euro Utilities and MSCI EURO indexes, in the Lisbon Stock Exchange.
Moreover, EDP has activities in the renewable energies sector through its 77.5% participation in the wind operator EDP Renováveis, which is present in the Iberian Peninsula (Portugal and Spain), Brazil, Belgium, France, Italy, Poland, Romania, UK and USA, with Renewables Europe, Renewables Brazil and Renewables North America. It is listed on Dow Jones and PSI 20 indexes. Furthermore, EDP has entered the Brazilian electricity market with its 64.8% participation in EdB Energias do Brazil, which performs electricity generation, distribution and supply activities in the states of Espírito Santo, Mato Grosso do Sul, Tocantins and Ceará (generation), São Paulo and Espírito Santo (distribution) and Santa Catarina, through its participation of 45% in EDPR Brazil. EdB Energias do Brasil is listed on the Bovespa in São Paulo Stock Exchange. In graph 10, we can conclude for a low profitability of the distribution business in Portugal as opposed to EDPR, EdB and Generation in Portugal. Also, since 1976, the company has suffered several privatizations stages and nowadays, the Portuguese state participation in the company does not exceed 25%.
The operating environment in the Iberian Peninsula is highly regulated by the Portuguese and Spanish states through their regulating entities (ERSE and CNE), including the regulation of renewable energy generation and other types of energy such as mini-hydro. The creation of MIBEL, an Iberian electricity market,
shows the regulators’ goals of making it a more competitive market, with
electricity prices set by supply and demand equilibrium. EDP’s competitors are mainly Spanish companies Endesa and Iberdrola, which also have operations in electricity generation, distribution and supply, gas and renewable energies.
Graph 10 – Business Distribution of EDP
“EDP ENERGIAS DE PORTUGAL” COMPANY REPORT
THIS
DOCUMENT
IS
NOT
AN
INVESTMENT
RECOMMENDATION
AND
SHALL
BE
USED
EXCLUSIVELY
FOR
ACADEMIC
PURPOSES
(SEE DISCLOSURES AND DISCLAIMERS AT END OF DOCUMENT)z
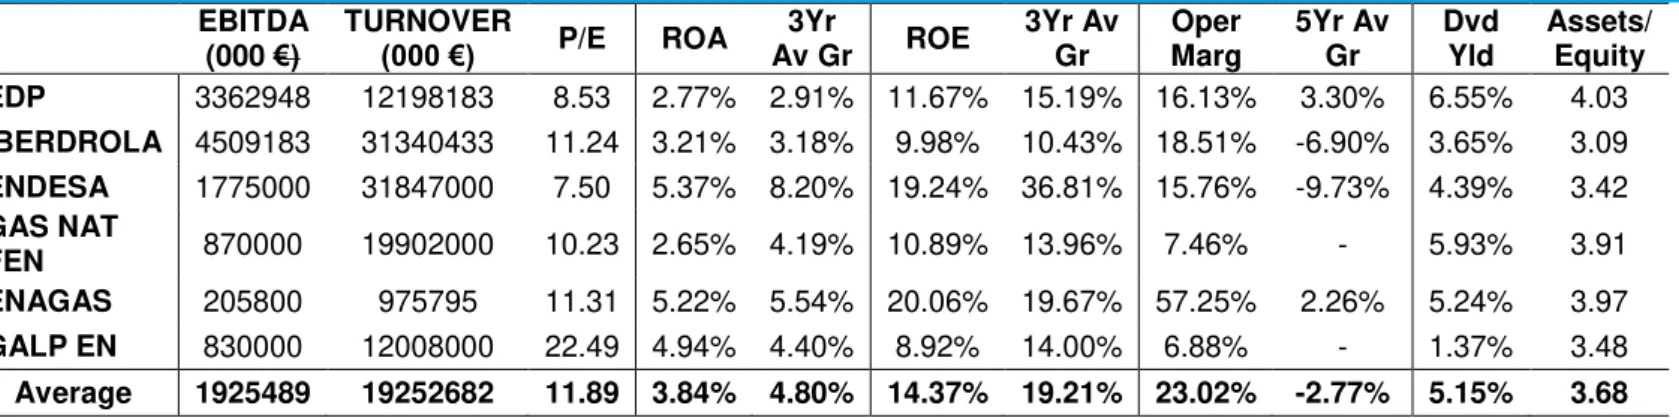
PAGE 10/30 EBITDA
(000 €)
TURNOVER
(000 €) P/E ROA Av Gr 3Yr ROE
3Yr Av Gr
Oper Marg
5Yr Av Gr
Dvd Yld
Assets/ Equity EDP 3362948 12198183 8.53 2.77% 2.91% 11.67% 15.19% 16.13% 3.30% 6.55% 4.03
IBERDROLA 4509183 31340433 11.24 3.21% 3.18% 9.98% 10.43% 18.51% -6.90% 3.65% 3.09
ENDESA 1775000 31847000 7.50 5.37% 8.20% 19.24% 36.81% 15.76% -9.73% 4.39% 3.42
GAS NAT
FEN 870000 19902000 10.23 2.65% 4.19% 10.89% 13.96% 7.46% - 5.93% 3.91
ENAGAS 205800 975795 11.31 5.22% 5.54% 20.06% 19.67% 57.25% 2.26% 5.24% 3.97
GALP EN 830000 12008000 22.49 4.94% 4.40% 8.92% 14.00% 6.88% - 1.37% 3.48
Average 1925489 19252682 11.89 3.84% 4.80% 14.37% 19.21% 23.02% -2.77% 5.15% 3.68
Table 3 – Bloomberg (2009)
By analyzing table 3, we conclude for EDP being a medium size among its main competitors in terms of Turnover. Still, the company is the most financially leveraged. On the other hand, it presents a good operation margin, with a good annual growth. Also, EDP is the one with higher share of Brazil in its operations portfolio (19% of 2010 EBITDA and 1.7 GW installed capacity), which makes it the company with the largest presence in a fast-growth country. It is the single electricity distributor in Portugal, with a generation capacity of 9.9 GW. In Spain,
EDP’s installed capacity is 3.5 GW and it represents 16% of the EBITDA in 2010.
EDPR is the 3rd world wind operator, with an installed capacity of 6.2 GW in 11 countries (Portugal, Spain, Belgium, Brazil, Poland, France, Italy, Romania, UK, USA, Canada).
Shareholder structure
EDP´s current Shareholder Structure is presented on Table 4. More so, the following Table will show the several privatization stages that EDP has suffered:
YEAR
Stocks Sold
% of Capital
Price
Implicit Value (€)
Nº Shares (MM)
1997
179970000
29.99%
2.16
1.296.216.072
600
1998
Strategic Partnership between EDP and IBERDROLA;
Possibility of acquiring 2.25% of the other company´s capital;
600
1998
97100000
16.20%
4.12
2.469.456.790
600
2000
600000000
20%
3.1
1.860.000.000
3000
2004 Capital Increase of 656537715 shares
18%
1.84
1.345.244.316
3656.54
2005
Bond Issue of EUR 572.8 million with exchange price of EUR 3.58;
Price never achieved during the exercising period;
3656.54
2007
Bond Issue of EUR 1015 million with exchange option from 18/12/12 to 18/12/14
at EUR 6.70
3656.54
Table 5 – Source: EDP
EDP’s shares are classified into shares of type A and shares of type B. Type A
shares are shares with limited voting rights and are held by private investors,
Table 4 –EDP’s current shareholder structure
Source:EDP
Shareholder No. Shares % Capital % Exercisable Votes
PARPÚBLICA - Participa 915.977.598 25,1% 24,1% Iberdrola Energia S.A.U. 248.437.516 6,8% 5,0% CAJA DE AHORROS DE A 183.257.513 5,0% 5,0% JOSÉ DE MELLO - Soc. G 176.340.958 4,8% 4,8% Senfora SARL 148.431.999 4,1% 4,1% Grupo BCP + FUNDO DE 123.241.223 3,4% 3,4% BANCO ESPÍRITO SANTO 99.173.971 2,7% 2,7% SONATRACH 81.713.076 2,2% 2,2% Norges Bank 97.247.888 2,7% 2,7% AllianceBernstein L.P. 76.553.268 2,1% 2,1% CAIXA GERAL DE DEPÓS 23.365.116 0,6% 0,6% EDP (Acções próprias) 33.324.941 0,9%
“EDP ENERGIAS DE PORTUGAL” COMPANY REPORT
THIS
DOCUMENT
IS
NOT
AN
INVESTMENT
RECOMMENDATION
AND
SHALL
BE
USED
EXCLUSIVELY
FOR
ACADEMIC
PURPOSES
(SEE DISCLOSURES AND DISCLAIMERS AT END OF DOCUMENT)z
PAGE 11/30
which means that any investor holding some share of EDP’s capital cannot have
more than 5% exercisable vote rights. Type B shares have no limited voting rights and these are held by the Portuguese state. Through its Parpública and Caixa Geral de Depósitos participations, the Portuguese state holds 25.7% of
EDP’s capital, with 24.7% voting rights. Given this, the state is the largest
shareholder in EDP’s shareholder structure. Because of EC legislation favoring a
free and competitive market and also due to the requirements of the IMF/EFSM, the 8th stage of reprivatization of EDP may occur this year. Still, after the failure of December 2010, when Parpública failed to sell, through convertible bonds, 10% of EDP´s capital (in an operation valued around EUR 980 millions), it is likely that the solution may now be through the entrance of new strategic partners. EDP has 55% of its revenues coming from outside Portugal and this reinforces the idea of EDP´s CEO that the company does not require the state as a granter of stability as it did in the past. The focus is now on a larger base of long term stockholders and in particular, those with access to new markets. We project some difficulties in this process, mainly due to a negative market sentiment towards Portuguese Government Debt and its correlation with EDP´s risk.
Iberian Operations
Generation
EDP holds operations in the electricity generation in the Iberia Peninsula. Its installed capacity was around 9,900 MW for Portugal and 3430 MW for Spain in end 2009. Electricity generation is operated by EDP Produção in Portugal and by Hidroeléctrica del Cantábrico in Spain and overall, it has seen an increase in market share since 2007 (graph 11). More so, EDP has power generation much more based in hydro than its competitors (Graph 12). The existence of CMEC´s (with 4095 MW of hydro plants against 3069 MW in thermal plants under CMEC), creates an artificial situation in which EDP is compensated above market remuneration. Hydro sources production volatility is significantly higher, since they are dependent on climacteric conditions (see graph 13 and 14).
According to Direcção Geral de Energia e Geologia, the total electricity consumption in Portugal in 2010 was 52.2 TWh, 4.7% higher than in 2009 and 3.2% higher than in 2008, having EDP generated around 34.3 TWh. In Spain, the electricity consumption totalized around 260 TWh, 3.2% higher than in 2009, having EDP generated 15.9 TWh.
Graph11- Market Share for Power Generation in Iberia 2009 (Installed Capacity)
Source:EDP, Endesa, Iberdrola, Gas Natural Fensa
Graph 12- Energy Sources (Installed Capacity) 2009
“EDP ENERGIAS DE PORTUGAL” COMPANY REPORT
THIS
DOCUMENT
IS
NOT
AN
INVESTMENT
RECOMMENDATION
AND
SHALL
BE
USED
EXCLUSIVELY
FOR
ACADEMIC
PURPOSES
(SEE DISCLOSURES AND DISCLAIMERS AT END OF DOCUMENT)z
PAGE 12/30
Hydro
In Portugal, around 52.4% of EDP’s installed capacity is thermal (coal-fired power, fuel and natural gas) and 47.6% is hydro power. Hydro power represents a clean energy source, as the level of carbon emissions produced during hydroelectricity generation is zero. Given the goals set by the European countries of increasing the use of clean sources of energy (20% less carbon emissions in 2020) and given the unused hydro potential in Portugal, this becomes an economic viable way to achieve European environmental goals. In fact, the Portuguese government approved in 2007 a national plan for hydro plants (8 new hydro power plants) to explore the unused hydro potential in Portugal (around 50%) and intends to increase this capacity to 8,600 MW in 2020.
Currently, EDP has 5,005 MW of hydro installed capacity, of which 4,579 MW in Portugal, distributed by 61 power plants.
These hydro power plants provide an important source of electricity generation, decreasing the national needs for energy imports (fuels). EDP uses these plants coordinated with wind power as way of smoothing the production of electricity, so that it matches the levels of consumption at any hour of the day (the levels of consumption are variable during the 24 hours day, for instances, during the night, the consumption drops). In periods of higher wind generation, the dam fills up with water, which is used to produce electricity during higher consumption hours. EDP aims at increasing its hydro installed capacity in 70% in Portugal and a total of 57% in the Iberian market, enhancing its efficiency in terms of carbon emissions and consequently reducing costs with CO2 emissions licenses. From the 8 hydro plants in the national plan for hydro power, EDP will be responsible for the operations of 3 of them, predicted to start operations in 2015 and 2016, while Endesa and Iberdrola will operate the other 5, starting operations in 2018. Foz Tua, Fridão and Alvito are the 3 power stations EDP will operate, representing 25% of the 2,913 MW of its new installed capacity at that time. The company has two more projects under construction, Baixo Sabor and Ribeiradio Ermida, which will start operations in 2015, and will have an installed capacity of 171 and 77 MW respectively. In addition, several power reinforcements are already being made, namely Picote II (2011), Bemposta II (2011), Alqueva II (2012), Venda Nova III (2015), Salamonde II (2015) and Paradela II (2017). The
Graph 13
Source:EDP
Graph 14
Source:EDP
3800 4000 4200 4400 4600 4800
1997 1999 2001 2003 2005 2007 2009
MW
Hydro Installed Capacity in Portugal
Hydro Installed Capacity
0 5.000 10.000 15.000 20.000
G
W
h
Hydro Generation in Portugal
“EDP ENERGIAS DE PORTUGAL” COMPANY REPORT
THIS
DOCUMENT
IS
NOT
AN
INVESTMENT
RECOMMENDATION
AND
SHALL
BE
USED
EXCLUSIVELY
FOR
ACADEMIC
PURPOSES
(SEE DISCLOSURES AND DISCLAIMERS AT END OF DOCUMENT)z
PAGE 13/30 predicted installed capacity evolution is presented in the table 6 below:
In total, EDP will have in 2017, 72 hydro power stations and a total of 7,617 MW of installed capacity in hydro power, (EDP predicts to invest 3,000 Million € in this 2,913 MW increase).
Overall, the electricity produced by hydro generation has increased with the increase in installed capacity. However, this type of generation highly depends on the level of rainfall in a given year. Portugal is a country with moderate level of rainfall which is a driver to the increase of hydroelectricity generation.
Hydro generation costs are generally lower than other types of generation, as costs such as CO2 emissions costs are eliminated as well as combustibles. In the case of conventional regime production, the production is sold in the retail Iberian market and all electricity sources are remunerated with the price established in the Iberian Market, which are determined according to supply and demand laws, resulting in the equilibrium price. The average price in 2010 was 37.33€/MWh, according to OMEL. Considering the load factor, the number of hours per day, and the number of days per year and the installed capacity of each plant, we obtain the electricity generated in one year. Taking the product of the average price operated by EDP (price in the Iberian market and price of bilateral contracts) and the electricity generation in one year; we achieve the turnover corresponding to each type generation.
Thermal
Thermal energy is the one generated from heat. EDP’s thermal generation
includes coal-fired plants, fuel oil, natural gas and nuclear. These technologies have an efficiency of 35% to 40%, or 45% to 55% in the case of combined cycle gas turbine (CCGT). The equipment used has an average lifetime of 30 years, except for nuclear plants, which can reach 45 years. The latter type of plants does not have any carbon emissions, which reduces the costs with carbon emissions licenses, however, the costs with operation and maintenance are
higher (6 to 10€/MWh against a maximum of 3€/MWh in the other types of
thermal generation. The lowest cost type of generation is natural gas electricity generation, with 0.5 to 1€/MWh. Tables 7 and 8 show the distribution of EDP’s
Table 6 - EDP’s Installed Capacity Evolution
Year 2010 2011E 2012E 2013E 2014E 2015E 2016E 2017E
Installed capacity MW 4,704 5,141 5,397 5,645 5,645 6,836 7,299 7,617
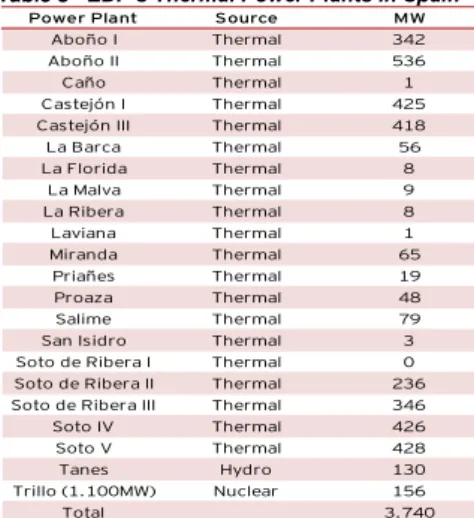
Table 7 - EDP’s Thermal Power Plants in
Portugal
Source:Research Estimates
Coal Natural Gas Sines(1256MW) Energin(43,7MW) Ribatejo(1200MW) Fueloil Carregado(750MW) Setúbal(1000MW) Carriço(30MW) Carregado(750MW) Soporgen(67,4MW) Mortágua(9MW) Diesel Lares(862MW) Tunes(199,2MW) Fisigen(24MW) Cogeneration Biomass Energin(43,7MW) Rodão(13MW) Carriço(30MW) Mortágua(9MW) Soporgen(67,4MW) Constância(13MW)
Fisigen(24MW) Figueira da Foz(30MW)
Table 8 - EDP’s Thermal Power Plants in Spain
Source:Research Estimates
Power Plant Source MW
Aboño I Thermal 342 Aboño II Thermal 536 Caño Thermal 1 Castejón I Thermal 425 Castejón III Thermal 418 La Barca Thermal 56 La Florida Thermal 8
La Malva Thermal 9 La Ribera Thermal 8 Laviana Thermal 1 Miranda Thermal 65 Priañes Thermal 19 Proaza Thermal 48 Salime Thermal 79 San Isidro Thermal 3 Soto de Ribera I Thermal 0 Soto de Ribera II Thermal 236 Soto de Ribera III Thermal 346 Soto IV Thermal 426 Soto V Thermal 428 Tanes Hydro 130 Trillo (1.100MW) Nuclear 156
Total 3.740
Graph 15 – Evolution of Oil and Iberian
Electricity Prices (Baseload Power)
“EDP ENERGIAS DE PORTUGAL” COMPANY REPORT
THIS
DOCUMENT
IS
NOT
AN
INVESTMENT
RECOMMENDATION
AND
SHALL
BE
USED
EXCLUSIVELY
FOR
ACADEMIC
PURPOSES
(SEE DISCLOSURES AND DISCLAIMERS AT END OF DOCUMENT)z
PAGE 14/30 thermal power plants and their installed capacities, in Portugal and Spain (where EDP is present with Hidroeléctrica del Cantábrico), respectively.
Thermal energy sources use fossil fuels as an input to electricity generation. In result, this type of generation is especially exposed to oil markets, resulting in a high correlation between the oil prices and the electricity prices. The operating prices in oil markets are now stabilizing, according to reports published by ERSE and oil futures, consequently leading to the stabilization of electricity prices (at
45€/MWh, according to ERSE) (refer to graph 15).
According to Graph 16 and 17, thermal installed capacity has been increasing while electricity generation has been decreasing. The strong investment in cleaner sources such as wind power (1,690 and 1,232 million Euros in 2009 and 2010) or hydro may explain this. Because the production of energy through wind power (and at a lower extent hydro) suffers from lack of continuity, there is a necessity of availability of traditional sources such as cogeneration centrals. This brings usage factors down (decreasing thermal electricity generation), while the necessity for installed capacity remains. With HC generation capacity, EDP generation in Spain in 2010 was as shown in table 9.
The electricity generation activities remuneration scheme includes:
- CMEC’s (only in Portugal)
- Special Regime Production - Conventional Regime Production.
CMEC’s
Before the liberalization of the electricity Iberian market, some power plants in Portugal were operated under Power Purchase Agreements (PPA or CAE – Contracto de Aquisição de Energia). These plants were part of projects financed by loans obtained from banks, which funded specific projects (Project Finance) and not EDP itself. These initiatives were part of an attempt of the Portuguese government to develop the national electric system, and as a protective measure of this initiative, the electric national system was obligated to buy the electricity produced by these plants, and EDP was obligated to feed the national electric system with the electricity generated in these plants.
However, as the electricity market became more competitive, more liberalized and more in sync with the Spanish market (creation of MIBEL in 2004 joining the two markets into one single Iberian market), the existence of such a binding
Graph 16 Source:EDP 0 2.000 4.000 6.000 8.000 10.000
1997 2000 2003 2006 2009
MW
EDP's Thermal Installed Capacity
Thermal Installed Capacity
Table 9 - EDP Generation in Spain
Source:EDP
Power Plant Regime Source GWh 2010
Aboño I Conventional Thermal 1.069 Aboño II Conventional Thermal 2.327 Castejón I Conventional Thermal 1.423 Castejón III Conventional Thermal 1.316 Centrais Hídricas HC Conventional Hydro 1.038 Cogeradores HC (Industriais) Special Thermal 356
Parques eólicos EDPR Special Wind 4.355 Pequena Hídrica Special Hydro 7
Resíduos HC Special Thermal 553 Soto de Ribera I Conventional Thermal 213 Soto de Ribera II Conventional Thermal 634 Soto de Ribera III Conventional Thermal 1.384 Soto de Ribera IV Conventional Thermal 64 Trillo (1.100MW) Conventional Nuclear 1.190
Total 15.930 Graph 17 Source:EDP 0 20.000 40.000 60.000
1997 2000 2003 2006 2009
M
W
h
EDP's Thermal Electricity Generation
“EDP ENERGIAS DE PORTUGAL” COMPANY REPORT
THIS
DOCUMENT
IS
NOT
AN
INVESTMENT
RECOMMENDATION
AND
SHALL
BE
USED
EXCLUSIVELY
FOR
ACADEMIC
PURPOSES
(SEE DISCLOSURES AND DISCLAIMERS AT END OF DOCUMENT)z
PAGE 15/30
Graph 18 - EDP Plants under PPA/CMEC contracts and its evolution (in MW)
Source:EDP
Graph 19 -Special Regime Production in Spain
Source:EDP
54% 42%
4%
Special Regime Production Spain
Waste
Cogeneration
Biomass
relation in the Portuguese market ceased to make sense and these PPA’s were
terminated in July 2007. Nevertheless, the loans to the banks still existed, and to repay these loans, CMEC’s were created, as a way of preserving the value of
the PPA’s (as an example, in 2007 the forecasted compensation was of 833 million Euros), adding to the NPV of the gross profit in the market segment, and at the end, significantly reducing market exposure. This compensation is achieved through a fee, charged to the consumers in their electricity bills,
whether they are EDP’s clients or not, for as long as CMEC’s remain (we can see the evolution in MW under this contracts in Graph 18). In case the prices practiced in the market are higher than what they should be (the pool price is
assumed to be 50€/MW rebased to 2007 prices) to obtain the NPV of the PPA
contracts, the consumers should be paid the difference. In practical terms, only until 2011 the old PPA´s gross profit was above the gross profit of the CMEC contracts, having those difference been hedged in the financial markets
Special Regime Production
“EDP ENERGIAS DE PORTUGAL” COMPANY REPORT
THIS
DOCUMENT
IS
NOT
AN
INVESTMENT
RECOMMENDATION
AND
SHALL
BE
USED
EXCLUSIVELY
FOR
ACADEMIC
PURPOSES
(SEE DISCLOSURES AND DISCLAIMERS AT END OF DOCUMENT)z
PAGE 16/30
Graph 20 -Annual Historical Electricity Price
Source:EDP
This special regime pressures energy production costs in cogeneration centrals, since, while priority is given to the special regime production, the necessity of availability of traditional sources such as cogeneration centrals is not reducing, mainly due to the lack of regularity on the wind power energy production. This brings the usage factors of cogeneration downwards.
When under special regime production, the producer may choose to operate with fix tariffs applied to this regime, or with the market prices. This means, that the producer whether sells the electricity to the Spanish electric system (to last resource supplier) at a fix regulated tariff (regulated market) or operates under market conditions in the Spanish electricity pool (liberalized market). In the latter case, the price has a cap price and a floor price, to reduce the volatility patent in the electricity market. This is a way of protecting the producer from the impact of price changes for instance in oil international markets, which are not directly connected to the renewable energy costs (Real Decreto 661/2007).
Conventional Regime Production
In Portugal, the generation of electricity is based on licenses granted by the Portuguese state, but fully operated by private companies. The electricity related activities are operated under free market principles, and the state only intervenes to ensure the electricity supply to all consumers. The electricity generated may be either sold in the retail market or under special regime production. The tariffs paid for the electricity sold in the market are the prices set by equilibrium of the demand and supply, according to the order of entry of the electricity in the system, being the lowest price generation the one going in first (except for special regime production and renewable energies).
“EDP ENERGIAS DE PORTUGAL” COMPANY REPORT
THIS
DOCUMENT
IS
NOT
AN
INVESTMENT
RECOMMENDATION
AND
SHALL
BE
USED
EXCLUSIVELY
FOR
ACADEMIC
PURPOSES
(SEE DISCLOSURES AND DISCLAIMERS AT END OF DOCUMENT)z
PAGE 17/30
Graph 23 – Historical Distribution Network
in Kms for Portugal and Spain
Source:EDP Graph 21 - Equivalent Interruption Time
Source:REN
Graph 22 – Imports and Exports in PT
(GWh)
Source:REN
equivalent interruption time in the grid, the difference between prices was more significant (Graph 21).
MIBEL
The existence of a fully liberalized and Iberian market was the aim behind the creation of MIBEL. In such a market, electricity supply and demand would set the final price of the electricity and the quantity sold, without the intervention of more regulatory mechanisms other than the market agents, operating in the market. However, some obstacles appear in the way of that goal. For instances, the overflow of electricity in the transport grid sometimes blocks the passage of electricity from one country to another (usually Portugal is the importing country as we can see in Graph 22) and this causes a market split, which means that, temporarily and depending on the magnitude of the effect of the saturation in the interconnection, two price zones appear. These market splits would be mitigated if this interconnection capacity was higher and this capacity depends on the electricity transport operator (REN in the case of Portugal).
Distribution
Electricity distribution is the activity which ensures that the electricity generated in the power plants reaches the transportation grid (operated by Rede Nacional de
Transporte in Portugal and by Red Eléctrica de España in Spain) and from the
transportation grid to the consumer centres. This electricity is traded between the electricity suppliers and the electricity producers, and the electricity distributors are paid for the access to their distribution networks (which adds to the final tariff to the consumer), allowing the electricity to flow from one centre to another. This sector is regulated by ERSE in Portugal and by CNE in Spain, as well as the tariffs paid to the distributors for each regulatory period of 3 years.
“EDP ENERGIAS DE PORTUGAL” COMPANY REPORT
THIS
DOCUMENT
IS
NOT
AN
INVESTMENT
RECOMMENDATION
AND
SHALL
BE
USED
EXCLUSIVELY
FOR
ACADEMIC
PURPOSES
(SEE DISCLOSURES AND DISCLAIMERS AT END OF DOCUMENT)z
PAGE 18/30
Supply
Electricity supply is the activity which operates the trade of electricity between the electricity producer and the final consumer. In Portugal and Spain, this sector has both regulated and liberalized segments. Regulated markets are operated by the last resource supplier, which is obligated to buy the electricity generated in special regime. The tariff applied to the consumers under regulated conditions is a fixed price set by the regulator (ERSE in Portugal and CNE in Spain) and it should cover the main costs incurred by the supplier (electricity purchase, transport and distribution), but should also translate into the lowest possible amount for the consumer, to maintain the equilibrium in the electricity system and ensure the supply of all consumers. EDP operates in the regulated market with EDP Serviço Universal in Portugal and HC Energía in Spain.
In the liberalized market, suppliers buy electricity in the Iberian market at market set prices, daily or in bilateral contracts. The electricity is then sold to final consumers that choose to be supplied in the liberalized market, with prices negotiated between supplier and consumer. EDP operates in the liberalized market with EDP Comercial in Portugal and HC Energía and Naturgas Comercializacíon in Spain. Both in Portugal and Spain, consumers are allowed to choose whether to be supplied in the regulated or liberalized market and their electricity supplier having EDP in Portugal a large market share, even though this share decreased from 65% in 2009 to 51% in 2010 (see graph 24), while in Spain in slightly went up from 11% to 12%. The distribution of clients supplied by EDP in both markets is shown in table 9.
In the mean time, also the market share for last resource supply in Portugal decreased from 82% in 2009 to 64% in 2010. To conclude, there is a clear trend for the passage of clients from the regulated to the liberalized market (see graph 25). More so, EDP seems to be decreasing market share (graph 26), so that the prospects of consolidation as a strong player in the future unique supply market (assuming the trend of increased share of liberalized market, as it is the will of government regulators ERSE and CNE) are clearly affected, negatively impacting future cash flows in this sub-sector of EDP´s performance.
Table 9 -Distribution of Clients
Source:EDP
Portugal
Spain
Regulated Market 5.791.683
359145
Liberalized Market 357363
291856
Graph 24 –Supply in the Liberalized Market
Portugal (MWh) - 2010
Source:EDP
Graph 25 –Share of Liberalized Retail
Business in Portugal and Spain
Source:EDP
Graph 26 – EDP´S Market Share in the
Liberalized Market in Iberia
“EDP ENERGIAS DE PORTUGAL” COMPANY REPORT
THIS
DOCUMENT
IS
NOT
AN
INVESTMENT
RECOMMENDATION
AND
SHALL
BE
USED
EXCLUSIVELY
FOR
ACADEMIC
PURPOSES
(SEE DISCLOSURES AND DISCLAIMERS AT END OF DOCUMENT)z
PAGE 19/30
Gas
In Portugal, the natural gas market is divided into several activities which are: - reception, storage and regasification of LNG
- underground storage - transportation - distribution - supply
- market operation
- logistic operations for switching suppliers.
The reception, storage and regasification of Liquified Natural Gas (LNG) are made in Sines natural gas plant, which receives LNG coming from the Maghreb pipeline and methan vessels. The gas import is based on bilateral contracts. The supply and transportation activities cannot be operated by the same market agent, they must be separated. The latter one is operated exclusively by REN Gasodutos, concession attributed by the Portuguese government. Distribution activities are regulated by ERSE, which determines the tariffs applicable to all customers. Distributors are obliged to give access to the national natural gas grid to any agent in the market, which consists in the low and medium pressure network. The supply activity is done by the last resource supplier, which is obligated to supply natural gas to clients that prefer to be supplied under regulated tariffs. However, as the market becomes more liberalized, clients may choose their supplier, according to their preferences and consumer profile. To consumers over 10,000 m3, the last resource tariff is no longer applicable. EDP operates in the natural gas distribution and supply (both last resource and liberalized) through its subsidiary, EDP Gás. Around 60% of its supplied natural gas goes to industrial clients. The 6 distribution concessions granted by the
Portuguese state to EDP’s operations will last until 2048, a 40-year concession attributed to EDP in 2008. EDP operated the primary distribution grid which takes the natural gas from the transmission grid until the secondary grid.
If we analyze the Iberian Supply market, we conclude for a strong concentration in 4 players and mainly, in Gas Natural Fenosa (see Graph 27). EDP presents itself as the second Iberian player due to an increase in the participation in Naturgas by the EDP´s subsidiary HC Energia. In Spain, the trend of reduction of the regulated market space is in a more advanced phase than Portuguese, reason why EDP´s market size started diminishing in 2009 (end of tariffs started
Graph 27 –Iberian Supply Market (MM Costumers)
Source:EDP
Graph 28 –EDP´s evolution (MWh)
Source:EDP
Graph 29 – Supply in the Liberalized Market
2010
“EDP ENERGIAS DE PORTUGAL” COMPANY REPORT
THIS
DOCUMENT
IS
NOT
AN
INVESTMENT
RECOMMENDATION
AND
SHALL
BE
USED
EXCLUSIVELY
FOR
ACADEMIC
PURPOSES
(SEE DISCLOSURES AND DISCLAIMERS AT END OF DOCUMENT)z
PAGE 20/30 in Spain in 2008). Still, the consolidation of Naturgas in the EDP Group numbers has caused a strong increase in supply of Gas in 2010 (see graph 28).
From 2009 to 2010, EDP consolidated his position as a player in the liberalized, both en Portugal as in Spain. Also, it is important to mention that the main portion of the liberalized market of EDP is in Spain (see graph 29). As we can see through table 10, the gross margins in the liberalized market suffered a strong downward pressure. This was mainly due to the pressure of higher cost of Gas that is indexed to the cost of oil.
In the long term, because of the correlation between Natural Gas and oil, the forecasts are for an increase in Natural Gas price which may cause downward pressures on the gross margins, hence reducing profitability. On graph 30, we can see the forecast of Natural Gas prices over the long term. In fact, this price is indexed with the price of oil which is also set to increase in the long term (as seen previously).
Concerning the capacity of adjusting in the short term to a lower consumption of Gas, EDP has in my opinion some flexibility (table 11 we can see the different sources to serve gas liberalized clients and CCGT´s). First, the acquisition of a gas supply portfolio in Cantabria and Murcia with no gas attached acts as buffer for lower demand. Also, several LT contracts are being negotiated and there are forecasts of an increase in gas supply to final clients both in Portugal and Spain. Just as in the electricity market, Portuguese and Spanish agents aim at the creation of a single Iberian natural gas market MIBGAS (the fourth largest market in natural gas in Europe, according with ERSE). The goal of such a unified market is the increase of number of participants in this market, creating competition, and simpler regulation in this segment. The regulator entities are the Portuguese and Spanish energy market regulators, ERSE and CNE, which are responsible for determining the operating rules for this market. In these rules are also included the tariffs applied to all consumers (Portuguese and Spanish), to avoid discrimination between domestic and international flow.
EdB Energias do Brasil
In Brazil, the growth of electricity consumption jeopardizes the supply of all the population with electricity (EDB reported an increase from 2009 to 2010 of 25.3% on the number of electrical shortages and unexpected shortages). To overcome such energy shortage, the Brazilian government and ANEEL (Agência Naional de Energia Eléctrica) have implemented the new electricity law, which focus on
Table 10 – Liberalized Market of Gas Supply
Source:EDP
Graph 30 –Natural Gas Prices Forecast
Source:Petroleum Consultants
$0,00 $2,00 $4,00 $6,00 $8,00
2011 2015 2019 2023 2027
U
S
$
/M
cf
Natural Gas
Prices
Table 11 – EDP Sourcing