1
Directed Research Internship Work Project, presented as part of the requirements for the Award of a Masters Degree in Economics from the NOVA – School of Business and
Economics.
Estimation of price-cost margins for Portuguese firms: a contribution for the assessment and monitoring of product market competition
Luis Folque
697
A Project carried out on the Economics course, under the supervision of:
Professor Susana Peralta Professor Ana Gouveia
2 Estimation of price-cost margins for Portuguese firms: a contribution for the assessment
and monitoring of product market competition
Abstract
This work project estimates price-cost margins for 163 Portuguese markets (defined at 3-digit level of CAE), with the aim of assessing the degree of product market competition. During the Economic and Financial Assistance Program of 2011-14, a set of product market reforms was implemented, with the objective of increasing competition in output markets. We provide a first assessment of the effectiveness of these reforms. We use Portuguese firm-level data to estimate price-cost margins, allowing for worker’s bargaining power. By then aggregating markets into sectors, our results allow us to conclude that the degree of competition did increase in most sectors.
3
“The entrepreneur is the one who first sees its economic viability, bucks the odds, fights or worms his way into the market, and eventually wins or loses. (...) In the course of this process, which cannot possibly run smoothly, many businesses, individuals, and institutions will be undermined and swept away. Schumpeter called this process creative destruction, and realized before anyone else that it was the main source of economic growth.”
Solow, Robert. 2007. Heavy Thinker. The New Republic May 2007, 48-50.
1. Motivation and Introduction
During the course of April 2011 and motivated by an unbearable pressure on fiscal sustainability, Portugal publicly requested external financial help. In return for immediate financial relief, Portugal agreed to comply on what was named the Memorandum of
Understanding- a document listing specific policies and economic goals, particularly of a
structural nature, to be implemented and expected to impact positively in the output market1.
In this regard, provided the economic contraction Portugal undergone between 2010 and 2013, it is extremely relevant to simultaneously assess and monitor the economic effects of new policies. As part of the Ministry of the Economy, the Gabinete de Estratégia e Estudos (G.E.E.) has a public role in the monitoring of economic indicators2. This work project was developed during a 3-month internship program at the G.E.E, in close cooperation with some of its members and carried out under the guidance of Professor Ana Gouveia3. The topic of the work project was motivated by the interest of the Ministry of the Economy in studying competition within the Portuguese Economy. All data used in this paper and the working conditions necessary to develop it were provided by the G.E.E.
1
Portugal: Memorandum of understanding on specific economic policy conditionality– signed by the major political parties and the European Commission, the ECB and the IMF
2
Office for Strategy and Studies
3
4
Shortly, the work aims at presenting an empirical assessment on the degree of competition in the product market of the Portuguese Economy, for the period between 2010 and 2013. In addition, this work project is a tool that will allow the continuous monitoring of the Portuguese Economy, as the methodology is now at the disposal of both the G.E.E and the G.P.E.A.R.I, the two offices of the Ministries of the Economy and Finance, respectively, in charge of economic analysis. Such contribution is intended to overcome the problem that “the lack of a comprehensive and systematic approach to monitoring and evaluation makes it difficult to assess the full impact of reforms on the functioning of the economy”4.
The body of the paper consists in the Literature Review present in Section 2. Section 3 presents a brief description of the macroeconomic context of the Portuguese Economy, during the considered time period. The methodology and the variables are presented in Section 4 and 5, respectively. Lastly, in Section 6, results are presented and discussed.
2. Literature Review
The degree of competition existent in product markets is an important part of the characterization of any economy. According to classic economic theory, the higher the competition in the product market, the more efficient is the allocation of resources within an economy – in the absence of market failures, perfect competition delivers an efficient allocation of resources. On the other hand, less competition leads to increased market power of firms operating within such markets. In fact, considerable market power allows firms to capture rents by practicing prices above marginal costs – generating equilibrium prices higher than those of perfect competition, thereby reducing the quantity exchanged in the market and inducing a loss in social welfare.
4
5
Moreover, entry in less competitive markets is far more difficult as incumbents may hold sufficient resources to fight entrants, thus preventing, at the same time, innovation and development. However, mark-ups by themselves do not depict entirely the state of competition within a market. In reality, several other factors need to be taken into account, such as the market structure, the number of firms or the products traded in the market. For instance, even within a context of extreme competition, firms may charge higher prices due to the degree of differentiation of their products – whether it is because of better quality or a more adequate target market.
Nonetheless, the recent empirical literature has validated these theoretical developments, linking productivity growth with high degrees of competition, particularly for developed economies5. According to Syverson (2011), competition drives productivity through two key mechanisms: (1) intramarket competition and (2) trade competition. We focus on the former, taking advantage of the availability of firm-level data6.
As previously mentioned, defining robust measures of competition is a strong challenge both theoretical and empirically – and every attempt comes with its caveats. In principal, the most common way is to measure the degree of concentration of production in relevant markets – however, the premise that a small number of competitors suggest lack of competition is debatable, particularly for some types of market structures7. Alternatively, the turnover of firms for a particular sector is sometimes used as an indicator of competition – still, such approach does not take into account the size of firms that enter and leave the market8.
This paper relies on the direct estimation of price-cost margins. Whilst prices are easy to measure, the difficulty lies on the fact that marginal costs are not directly observed. Despite
5
Blanchard and Giavazzi (2003) argue that decreasing price-cost margins (i.e, mark-ups) have positive effects on output, according to their theoretical model (and as expected by economic theory)
6
IES database (available for G.E.E.) – more concrete details in section 5
7
Núnez and Pérez (2001)
6
being measurable individually by firms, these lack proper incentives to do so and even less to report them afterwards. Notwithstanding, considerable empirical research has been directed on this topic using structural econometric models to overcome these measurement issues.
One of the first empirical approaches to the estimation of price-cost margins was proposed in
Hall (1988). The methodology was based on the relation between the Solow residual (SR) and
the growth rate of inputs9. A major drawback is the endogeneity present in the model which prevents the possibility of estimation using standard econometric tools. In fact, input growth rates should be correlated with technological progress which, in turn, is not observable. In order to address this issue, Hall proposed the use of instrumental variables. Nonetheless, finding adequate instruments is a severe challenge and the ones selected were of doubtful validity. Alternatively, other literature suggests different responses such as the use of a control function as proposed in Olley and Pakes (1996) or a more exhaustive estimation by generalized method of moments to guarantee consistency as in Dobbelaere (2004).
As a response to the aforementioned problem, in Roeger (1995) an alternative methodology is proposed, consisting in the use of the difference between the Solow residuals obtained from the problem of profit maximization and that from the cost minimization (the dual problem) of the firm. By doing so, the source of endogeneity is eliminated as the technological parameters cross out10. The standard version of Roeger’s methodology assumes constant returns to scale, homogeneous inputs and perfectly competitive input markets (for capital, labour and intermediate inputs). Notwithstanding, the validity of such assumptions is debatable.
Moreover, empirical evidence indicates that market power is significantly underestimated when the degree of imperfection of the labour market is ignored, as will be made clear in our subsequent analysis. In this regard, contributions from Crépon et al. (2005) and Abraham et
9
Solow (1957) contribution on growth accounting laid the foundations for further research.
10
7
al. (2009), which take into account imperfect competition in the labour market, allow for the
computation of more consistent estimates.
The methodology used in this paper is similar to the one used Amador and Soares (2013) and also uses the same database. Given that this paper uses data from 2010 to 2013, it can be viewed as an extension of Amador and Soares (2013) – which uses data from 2005 to 200911. It is also worth noticing that the use of a production function framework which allows capturing some of the differences between technologies across sectors is particularly relevant in a context where a large number of markets are covered, as the present one.
3. Portuguese Economic Conjuncture
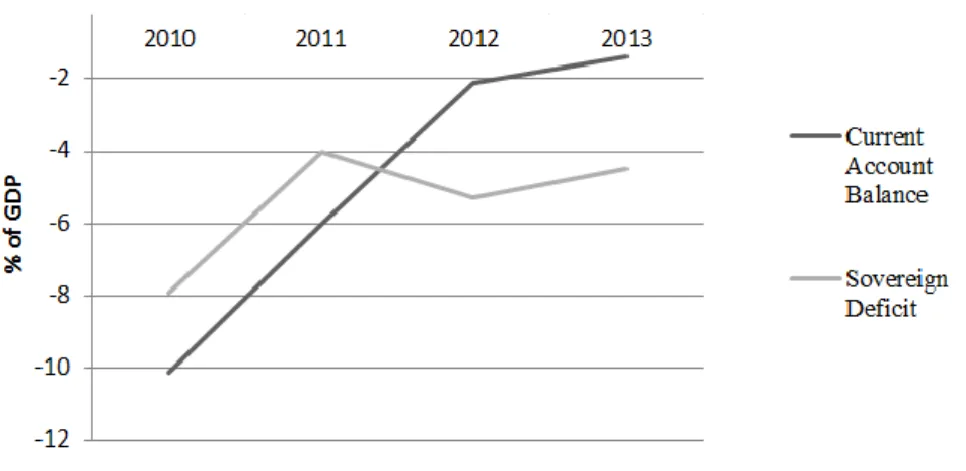
In the aftermath of the 2008 global financial crisis, abrupt output shocks widely spread amongst European Union member states. At first, EU response came in an expansionary form, as policymakers opted to try to boost growth and contain employment destruction via government spending. However, at this moment in time, some of these countries already held very high debt to GDP ratios. Hence, further accumulation of fiscal deficits after the crisis deteriorated sovereigns’ credibility and pushed secondary market yields through the roof, causing debt servicing to be too costly to bear – and subsequent request for external financial help12. From here, the focus of EU economic policy changed to the correction of structural imbalances, for the countries where it applied.
In the case of Portugal, in addition to a primary fiscal deficit, there was a negative current account balance, as displayed in Figure 1.
11
Unfortunately, the data available at G.E.E. only covers the period 2010-13. In this sense, this work is not an extension of Amador and Soares for a longer period (as it would have been if we would have been able to start our analysis in 2005), but rather a complement to their paper
12
Portuguese 10-year government bonds yield was 8.54 p.p. at the 6th of April 2011 (day of official request). Source: Bloomberg
8
Source: OECD
Shortly, European economic policy priorities started to be based on the following three pillars: (1) investment; (2) fiscal responsibility; (3) structural reforms13. Typical structural reforms can be divided into four fields: (1) product market; (2) labour market; (3) public sector; (4) financial sector, generally including policies that make labour markets more flexible and responsive, liberalise service sectors, enhance competition in product markets, improve the overall business environment and encourage innovation.
In this regard, the fact that several Euro Area countries – not only those which undergone assistance programmes – have been implementing product market reforms simultaneously ought to be beneficial for the overall objective of boosting growth in Europe. The question of the synchronization in reforming between countries is modelled by the IMF (2006)14, considering only Euro Area member states.
Particularly, product market reforms are of a microeconomic nature and aim to improve the functioning of markets by increasing competition amongst producers (of goods and services) and, consequently, improving their respective productivity growth. It is worth noticing that most product market reforms have no considerable budgetary impact – they can consist simply in reducing red tape or, for instance, improving the swiftness of licensing
13
European Commission Annual Growth Survey 2015
14
Working Paper/06/137 by Everaert and Schule
9
requirements. Yet, these reforms seem to be unpopular given the time they need to accrue tangible effects – additionally, the potential effects are spread across the economy as a whole, while the cost remain, in general, concentrated.
Given the need for a fast response to the official institutions requests and because structural reforms take time to accrue real effects, the Portuguese government resorted to immediate policy measures – in general, freezing collective bargaining and tampering wages (refocusing on exports via labour price decrease), cutting social benefits and social services (to balance the budget), whilst privatizing public assets (in order to repay debt)15.
Table 1 - Real GDP growth, Portugal
Year 2009 2010 2011 2012 2013
Real GDP growth (% of GDP) -3.0 1.90 -1.83 -4.03 -1.13
Source: OECD
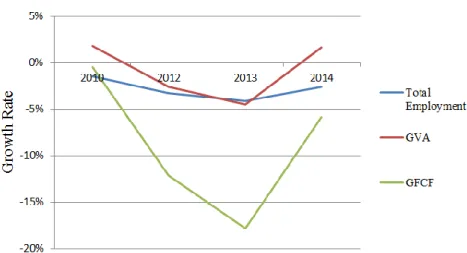
It is clear from Table 1 that between 2011 and 2013 there was a recession. In fact, total Employment steadily diminished and, consequently, so did Gross Value Added, as displayed in Figure 2. At the same time, an even greater shock affected overall Investment, which may put long-term output growth at risk.
Source: Eurostat and World Bank
15
IMF. 2015. First Post-Program Monitoring Discussions.
10
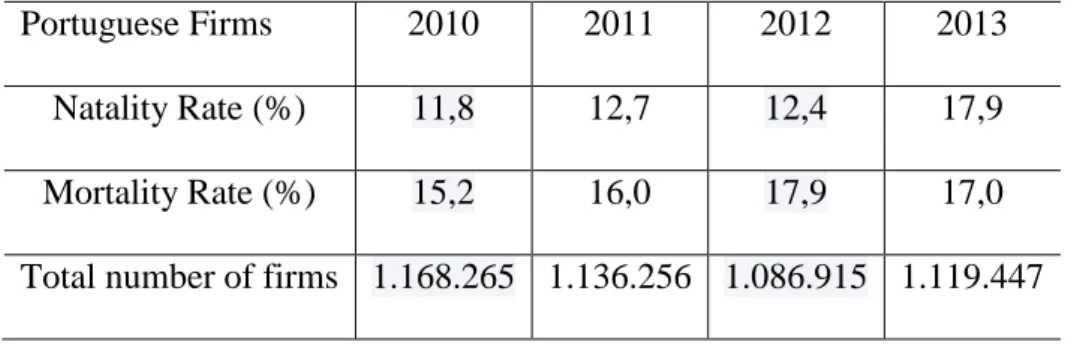
Regarding firm demographics (Table 2), the scenario was similar. Between 2010 and 2012, the number of firms steadily decreased – there was a recovery in 2013, but for a level below that of 2011. For the entire period, the mortality rate is over 15 p.p. – meaning that for 100 existent firms, at least 15 close during the year – signalling harsh economic conditions. In this context, mark-ups can be very relevant if we consider higher mark-ups to be beneficial for firms’ balance sheets – as it would induce firms trying to stay afloat to practice higher prices.
Table 2 - Firm demographics, Portugal
Portuguese Firms 2010 2011 2012 2013
Natality Rate (%) 11,8 12,7 12,4 17,9
Mortality Rate (%) 15,2 16,0 17,9 17,0
Total number of firms 1.168.265 1.136.256 1.086.915 1.119.447
Source: Eurostat
3.1 Product Market Reforms in Portugal
According to the IMF Country Report on Portugal, 152 product market reforms to be implemented were identified - these reforms are expected to impact in 10 economic areas and pursue 20 objectives.
The present work is not based on the study of a particular reform but rather an overall assessment of competition, which is itself a result of the regulatory framework. The effects generated by the implementation of product market reforms take time to accrue but are expected to impact positively on competition and output. Even though a full account of all the reforms in details is out of the scope of this work, a shortened but comprehensive list of the objectives is presented in Table 3.
11
Table 3 - Summary of Product Market Reforms’ goals for Portugal (IMF)
Area Objectives
Licensing environment
Reduce administrative burdens; Improve the licensing regimes and reduce approval timings; Foster urban renewal
Energy costs
Liberalization of the electricity and gas markets; Ensure sustainability of the national electric system;
Costs of telecommunications and postal services
Increase competition in the market by lowering entry barriers; Strengthen power of the National Regulator Authority
Cost of road use
Adopt strategic plan to rationalize networks and improve mobility and logistic conditions; Reduce the PPPs road costs
Cost of using railways
Strengthen competition in railway sector and attract more traffic
Cost of using ports Reform the Port model to reduce cots in about 25-30 p.p.
Cost of professional services
Remove barriers to entry in key professional regulated professions to increase competition
Cost of other services
Reduce entry barriers to a wide range of service activities to increase competition
Enforcement of competition
Strengthen the powers of the competition authority and the sector regulators; Eliminate special rights of the state
Housing market
Boost rental market by revitalizing city centers; Foster labour mobility; Reduce incentives to household excessive debt
12
4. Methodology
In essence, this paper uses the methodology put forward in Amador and Soares (2013). Both the source of information and the research theme are the same, hence the adaptation of the model used. In this Section, a step-by-step description of the methodology is presented, starting with Roeger’s approach, followed by the relaxation of the perfectly competitive labour market assumption, indispensable to ensure consistency.
4.1 Mark-up estimation using Roeger’s approach
The initial framework is a standard neoclassical production function:
𝑄 = 𝐴𝑓(𝐾, 𝐿, 𝑀) (1)
where 𝑄 stands for output, 𝐴 is the technological parameter (which is assumed to be Hicks-neutral to ease the logarithmic differentiation) and 𝐾, 𝐿, 𝑀 represent the inputs (capital, labor and intermediate inputs, respectively).
Within perfectly competitive input and output markets - profit maximizing firms have null market power - the productivity of each individual input can be replaced by its corresponding price (meaning that, for instance, output elasticity with respect to capital matches the share of capital in nominal output16). In that case, the Solow residual would equal the technological parameter 𝜃. This is not the case here as we intend to test the hypothesis of perfect competition in the output market.
Contrastingly, in the presence of market power, the Solow residual no longer corresponds to the technological progress, implying that output elasticities no longer match the corresponding production shares. In fact, there is a markup ratio such that 𝜀𝑗 = 𝜇 𝛼𝑗, where
16
𝜀𝑗≡𝑃𝑗𝐽
𝑃𝑄≡ 𝛼 𝑗,
13
𝜀𝑗 stands for output elasticity with respect to input 𝑗, 𝜇 corresponds to the mark-up and 𝛼𝑗 represents the share of input 𝑗 in output. In this this case, the growth rate of output – derived from Equation 1 - can be computed as follows:
Δ𝑞 = 𝜇(𝛼𝐾Δ𝑘 + 𝛼𝐿Δ𝑙 + 𝛼𝑀Δ𝑚) + 𝜃 (2)
where Δ𝑞 represents the growth rate of output and 𝜃 is the technological parameter.
In addition, assuming constant returns to scale17, the Solow residual is obtained as:
𝑆𝑅 = (1 −1
𝜇) (Δ𝑞 − Δ𝑘) + 1
𝜇𝜃 (3)
The last term is not observable (the technological parameter) which causes the OLS estimator to be inconsistent. Still, equation 3 allows us to obtain the classical price-cost margin as 𝐿𝑒𝑟𝑛𝑒𝑟 𝐼𝑛𝑑𝑒𝑥 = (1 −1
𝜇) = 𝑃−𝑀𝑔𝐶
𝑃 , where 𝑃 is price and 𝑀𝑔𝐶is marginal cost. Hence, the problem is directly related to the unobservable term only.
In this regard, considering the dual problem of cost minimization given a level of output for the firm, it is possible to eliminate the technological parameter. Assuming the same as previously, the Solow residual of the dual problem can be computed as:
𝑆𝑅𝑑 ≡ Δ𝑝 − 𝛼𝐾Δ𝑟 + 𝛼𝐿Δ𝑤 + 𝛼𝑀Δ𝑝𝑚 = (1 −1
𝜇) (Δ𝑝 − Δ𝑟) − 1
𝜇𝜃 (4)
where 𝑝 is log of output price and 𝑟, 𝑤 and 𝑝𝑚 are cost of capital, wages and cost of intermediate inputs in log.
The endogeneity source is eliminated by computing the difference between the Solow residuals:
14
𝑆𝑅 − 𝑆𝑅𝑑 = (1 −1
𝜇) [(Δ𝑝 + Δ𝑞) − (Δ𝑟 + Δ𝑘)] (5)
Therefore, the inconsistency problem is solved and the estimation of the mark-up can be performed by OLS consistently18. Still, the estimation requires a firm-level computation of the cost of capital.
4.2 Mark-up under imperfect labour market
Previously, mark-ups were estimated assuming a perfectly competitive labor market where workers’ bargaining power is null. Nevertheless, not only this assumption is strongly contested by empirical evidence but also will cause the mark-up to be significantly underestimated. Given this, it is beneficial to change the empirical approach and take into account imperfect competition in the labor market19. Assuming that wages (𝑊) and number of workers (𝐿) are chosen simultaneously given an efficient bargaining problem involving the sharing of the surplus between the firm and workers:
max𝐿,𝑊Ω = [(𝑊 − 𝑊̅ )𝐿]𝜙. (𝑃𝑄 − 𝑊𝐿)(1−𝜙) (6)
where 𝑊̅ is the reservation wage and 𝜙 represents the worker’s bargaining power (𝜙 = 0 corresponds to a perfectly competitive labor market; 𝜙 = 1 represents the case where workers capture the entire surplus of the firm). Assuming a case of imperfect competition and an isoelastic demand for output, one can derive the elasticity of output with respect to labor as20:
𝜀𝐿 = 𝜇𝛼𝐿+ 𝜇 𝜙 1−𝜙(𝛼 𝐿− 1) (7) 18 Remember, 𝑆𝑅 − 𝑆𝑅𝑑≡ (Δ𝑝 + Δ𝑞) − 𝛼𝐿(Δ𝑤 + Δ𝑙) − 𝛼𝑀(Δ𝑝𝑚+ Δ𝑚) − (1 − 𝛼𝐿− 𝛼𝑀)(Δ𝑟 + Δ𝑘) 19
See Dobbelaere (2004) and Abraham et al. (2009)
20
𝑃 = 𝑄−
1
𝜂 , where 𝜂 is the price elasticity of demand and 𝐿𝑒𝑟𝑛𝑒𝑟 𝐼𝑛𝑑𝑒𝑥 =1
𝜂. For detailed derivation please refer to
15
Afterwards, the remaining output elasticities are adjusted, given the assumption of constant returns to scale. With the adjusted elasticities, the Solow residuals entail a new term and equation 5 can be rewritten as:
𝑆𝑅 − 𝑆𝑅𝑑 = (1 −1 𝜇) [(Δ𝑝 + Δ𝑞) − (Δ𝑟 + Δ𝑘)] + 𝜙 1−𝜙(𝛼 𝐿− 1)[(Δ𝑙 + Δ𝑤) − (Δ𝑟 + Δ𝑘)] (8)
From Equation 8, we derive Equation 9 which allows estimating the mark-up and the worker’s bargaining power jointly, improving the consistency of the mark-up estimate.
𝑦𝑖,𝑗 = 𝛽1𝑥𝑖,𝑗1 + 𝛽2𝑥𝑖,𝑗2 + 𝜀𝑖,𝑗 (9)
We then proceed to derive the beta coefficients, which we use to compute the structural parameters (1 −1
𝜇) and 𝜙, the mark-up and the bargaining power, respectively, for each individual market. In the benchmark case, the Equation is run for 163 markets, with an average of approximately 441 firms by market. The terms of Equation 9 are the following:
𝑦𝑖,𝑗 = (Δ𝑝𝑖,𝑗+ Δ𝑞𝑖,𝑗) − 𝛼𝐿(Δ𝑙𝑖,𝑗 + Δ𝑤𝑖,𝑗) − 𝛼𝑀(Δ𝑚𝑖,𝑗) − (1 − 𝛼𝐿− 𝛼𝑀)(Δ𝑟𝑖,𝑗 + Δ𝑘𝑖,𝑗),
𝑥𝑖,𝑗1 = [(Δ𝑝𝑖,𝑗+ Δ𝑞𝑖,𝑗) − (Δ𝑟𝑖,𝑗+ Δ𝑘𝑖,𝑗)]
𝑥𝑖,𝑗2 = (𝛼𝐿− 1)[(Δ𝑙
𝑖,𝑗 + Δ𝑤𝑖,𝑗) − (Δ𝑟𝑖,𝑗 + Δ𝑘𝑖,𝑗)],
𝑖 = 2011, 2012,2013 and 𝑗 stands for firm.
5. Database and Variables
We use data from the annual accounts of Portuguese firms reported under Informação
Simplificada Empresarial (IES) for the period 2010-2013. This immense database provides
very detailed financial information for virtually the universe of Portuguese non-financial firms.
16
Still in line with the analysis from Amador and Soares (2013), we have eliminated observations with the following characteristics. To start, only firms reporting strictly positive sales, labor costs, intermediate inputs and net capital stock (tangible and intangible) were considered. As a means to exclude outliers, observations below the 1st and above the 99th percentile in the distribution of growth rates of sales, labor costs, intermediate inputs and net capital stock were excluded. In addition, observations with depreciation rates and share of labor costs and intermediate inputs in total sales outside the [0,1] range were not considered.
Moreover, to be consistent with profit-maximization in the long-rum, firms reporting negative operational results in at least two years were not considered. These poor performing firms represent a share of approximately 28%, as opposed to 22% for the period between 2005 and 200921. The increase is reasonable and can be attributable to the recession which resulted in the closing of several firms and in a severe increase in unemployment. This treatment is likely to increase the possibility of a sample selection bias – as one may be disregarding firms at an early stage/investment phase. Therefore, the impact of such bias is addressed with the use of the two-step Heckman procedure. Also, the sectors of “Agriculture”, “Education” and “Health” were withdrawn because of the relevance the government has on their functioning. Markets are defined at the 3-digit level in CAE Rev.3. This classification is different from the one present in Amador and Soares (2013), where the 3-digit level is used but from CAE Rev.1.1. Hence, market-to-market comparisons should be drawn carefully.
After the treatment, the sample is composed by 79,357 firms in 2011, 71,361 in 2012 and 65,366 in 2013. Overall, the benchmark case considers a total of 163 markets, where 113 are considered tradable and 50 non-tradable. The criterion used to distinguish between sectors is an adaption derived from the Work Project of Canas (2016), a research colleague at G.E.E.
21
17
Through a process of analyzing different criteria22 and sort out the differences they yield,
Canas (2016) proposes a new set of tradable goods sectors23. This classification is substantially different from the most commonly used in institutional economic research and also from the one present in Amador and Soares (2013)24. However, in this work, sectors “D” and “J” were considered to be non-tradable, so as to trace better improvements from product market reforms, in line with institutional classification25.
5.1. Variables
The present structural econometric model requires the use of an extensive set of variables. To start with, output is represented by total sales from goods and services with growth rate equal to Δ𝑝 + Δ𝑞. At the same time, labour costs are represented by nominal wages and other benefits, with growth rate equal to Δ𝑙 + Δ𝑤.
Additionally, shares of employment and intermediate inputs (𝛼𝐿 and 𝛼𝑀) are given by the ratio of labor costs and costs of intermediate inputs to sales, respectively.
Source: Author’s calculations
22
Aggregation at NACE Rev.2 sections
23
Agriculture, forestry and fishing; Manufacturing, mining and quarrying; Electricity, gas and water; Transportation and Storage; Accommodation and food service activities; Information and communication; Financial and insurance activities; and Professional, scientific, technical, administration and support service activities
24“The set of tradable markets includes all manufacturing markets plus those markets where exports to sales ratio exceeds 15
per cent.”
25Sectors “D” and “J” represent “Electricity, Gas and Water” and “Information and Communications”, respectively
18
Given that the distribution of shares of labour costs in Figure 4 is positively skewed (average of 26.58 p.p.), whilst the distribution of shares of intermediate inputs in Figure 3 is negatively skewed (average of 64.68 p.p.), the cost of goods sold weights heavier than nominal wages, for the average Portuguese firm.
Moreover, information regarding the stock of capital and its cost of use is required to perform the estimation. Firstly, the growth rate of net capital accumulation is represented by Δ𝑘. Even though it is not common practice within the literature, in the present work the stock of capital considered includes both tangible and intangible assets (net of depreciations at book value). Opting not to include intangibles may cause results to be biased - particularly, intangibles tend to assume a crucial role in the accounts of firms belonging to Services26.
The user cost of capital represents the cost of purchasing one unit of capital services and entails, simultaneously, a measure of the financial cost of capital and the depreciation rate. In the present paper, the user cost of capital is calculated at firm-level, using the book values directly reported from the firms27. The expression used for the user cost of capital is derived from Jorgenson and Hall (1967):
𝑟𝑖,𝑡 = (𝑖𝑖,𝑡− 𝑃̂ + 𝛿𝑡𝐼 𝑖,𝑡)𝑃𝑡𝐼 (9)
where 𝑖𝑖,𝑡 represents the financial cost of capital, 𝛿𝑖,𝑡 is the depreciation rate, 𝑃𝑡𝐼and 𝑃̂ 𝑡𝐼 represent the level and growth rate of investment goods price28, respectively.
Using an estimate of the depreciation rate at firm-level allows capturing some of the heterogeneity existent in the stock of capital and is calculated using the following expression29:
26
As argued in Amador in Soares (2013)
27
This procedure is expected to reduce the likelihood of measurement errors
28
19
𝛿𝑖,𝑡 =
𝑑𝑒𝑝𝑟𝑒𝑐𝑖𝑎𝑡𝑖𝑜𝑛𝑖,𝑡
𝐾𝑖,𝑡−1 (10)
Finally, the computation of the financial cost of capital is even more meticulous. To start with, it is assumed that funding through equity is equivalent to funding through debt. Additionally, in order to avoid a considerable loss of observations, the financial cost of capital of firms that either reported no debt neither interest payments or a ratio outside the [0,1] range was assumed to be equivalent to the average of the respective market in each year. The expression for the financial cost of capital, computed at firm-level, is given by:
𝑖𝑖,𝑡 = 𝑖𝑛𝑡𝑒𝑟𝑒𝑠𝑡 𝑝𝑎𝑖𝑑
𝑓𝑖𝑛𝑎𝑛𝑐𝑖𝑎𝑙 𝑑𝑒𝑏𝑡 𝑜𝑢𝑡𝑠𝑡𝑎𝑛𝑑𝑖𝑛𝑔30 (11)
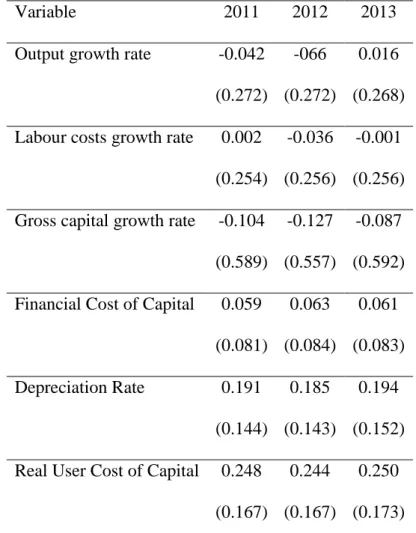
Moreover, Table 4 displays the average values and respective standard deviations for the variables used in Equation 8, in each year of the period considered31.
The distribution of the financial cost of capital is positively skewed for Portuguese firms, with an average of approximately 6 p.p. Regarding the distribution of the depreciation rate, it is also positively skewed but to a smaller extent, as compared to the financial cost of capital. For the overall economy, the average is around 19 p.p. This figure is higher but in line with the ones used in similar articles. For instance, while Konings and Vandenbussche (2005) assume a depreciation rate of 10 per cent, Amador and Soares (2013) obtain – for the period of 2004-2009 – precisely the same 10 per cent. Still, during a period of economic crisis and overall instability, more noise is expected from the data. Despite the calculation being made at the firm level, there is still room for potential measurement errors.
29
Note 𝐾 stands for gross capital stock
30
Short-term and long-term financial debt
31
20
Table 4 - Descriptive statistics of variables used, Portugal, Sample
Variable 2011 2012 2013
Output growth rate -0.042
(0.272)
-066 (0.272)
0.016 (0.268) Labour costs growth rate 0.002
(0.254)
-0.036 (0.256)
-0.001 (0.256) Gross capital growth rate -0.104
(0.589)
-0.127 (0.557)
-0.087 (0.592) Financial Cost of Capital 0.059
(0.081) 0.063 (0.084) 0.061 (0.083) Depreciation Rate 0.191 (0.144) 0.185 (0.143) 0.194 (0.152) Real User Cost of Capital 0.248
(0.167)
0.244 (0.167)
0.250 (0.173) Source: Author’s calculations – average; standard deviation in parenthesis
6. Results
In this section, the results from the estimation of Equation 9 are presented. Estimation is performed for each market and for the period 2010-2013. The benchmark case is estimated by OLS with clustered errors for each market. Additionally, fixed effects, random effects and two-step Heckman32 are also estimated to ensure robustness.
As the analysis is performed at market-level, presentation of all estimates would prove to be extensive33. Therefore, all estimates presented in this Section are significant at a 10 p.p. confidence level. Table 5 presents the benchmark case for market 351, where β1 gives the
32
Two-step Heckman procedure was used to test potential sample selection bias related with the exclusion of firms with negative operational profits. At a 10% significance level, the inverse Mills ratio is significant for approximately 20 percent of the markets.
33
21
mark-up directly, whereas β2 needs an algebraic transformation in order to derivate the bargaining power3435.
Table 5 – Benchmark estimates for Market 351
Parameters Coefficient Robust Std. Error P-value
β1 0.602 0.104 0.000
β2 0.345 0.108 0.003
R2 = 0.579; F-statistic = 0.000; N = 76
In order to trace improvements, estimates for the years 2012 and 2013 were drawn. The loss of two periods is due to the use of the growth rate of the depreciation rate. Hence, individually, only results for 2012 and 2013 can be derived.
It would be possible to test the paradigm of perfect competition in the product market of the Portuguese economy here. Still, because it is widely rejected (hypothesis is rejected for over 95 per cent36 of the markets), only statistically significant – at a significance level of 10 per cent – mark-ups are presented. For the overall economy, mark-ups range between a minimum of 4 per cent and a maximum of 76 per cent.
Source: Author’s calculations
34
351 Description: “Electric power generation, transmission and distribution”
35
β2 = ∅
1−∅, where ∅ is bargaining power. 36
Similar to Amador and Soares (2013)
22
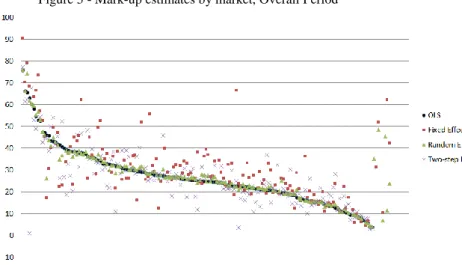
Figure 5 displays the estimates of the price-cost margins for the different regression, ranked by the estimates of the OLS (with clustered errors) from the highest to the lowest. It is worth noticing the considerable heterogeneity of mark-ups across markets, even though the rank of the estimates is robust to different specifications 37. Figure 6 displays the positive correlation between bargaining power and mark-up, at the market-level, thus confirming expectations of a potential omitted variable bias - under the assumption of a perfectly competitive labour market – as labour costs would incorrectly be assumed to correspond to workers’ productivity, hence underestimating firm’s market power38.
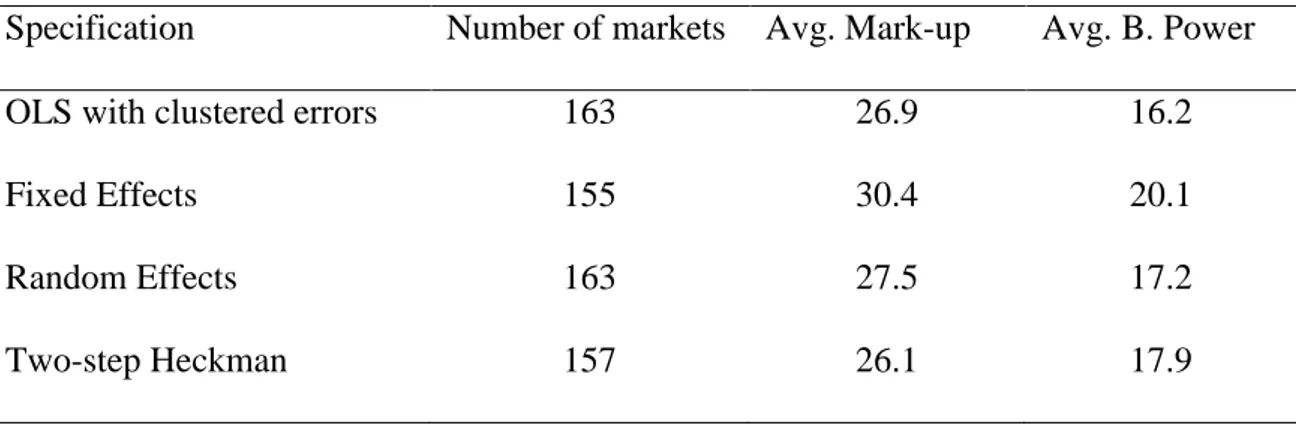
Table 6 and 7 present, respectively, the outcome for the different types of specifications and the benchmark case (OLS), depicted into smaller categories. The number of markets differs amongst specifications, as it only counts with estimates significant at a 10 p.p. confidence level, which change according to the estimation method used.
Table 6 - Different specification results, Overall Period
Specification Number of markets Avg. Mark-up Avg. B. Power
OLS with clustered errors 163 26.9 16.2
Fixed Effects 155 30.4 20.1
Random Effects 163 27.5 17.2
Two-step Heckman 157 26.1 17.9
Source: Author’s calculations
In line with the expectations, the mark-up for markets of Tradable goods is smaller than for the Non-Tradable. The imbalance in the state of competition between both sectors is considered to be the cause for an over-allocation of resources in the Non-tradable sector, within the recent history of the Portuguese Economy. Thus, an approximation between both
37
Isolated values on the right-side of the figures represent markets from which was only possible to draw results either by fixed or random effects
38
23
by mark-ups would prove to be beneficial in regards to an efficient allocation of resources. Table 6 presents a breakdown by sectors of the benchmark case. The overall average mark-up is 26.9 p.p. compared to 26.6 p.p. estimated in Amador and Soares (2013) – suggesting no significant changes.
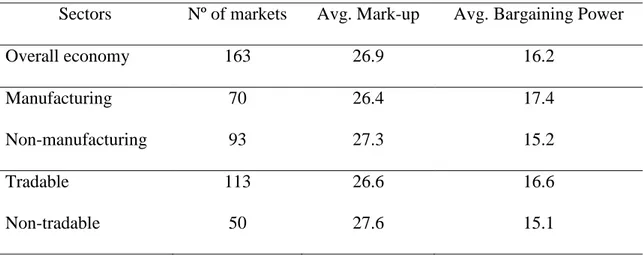
Table 7 - OLS estimates, Overall Period
Sectors Nº of markets Avg. Mark-up Avg. Bargaining Power
Overall economy 163 26.9 16.2
Manufacturing 70 26.4 17.4
Non-manufacturing 93 27.3 15.2
Tradable 113 26.6 16.6
Non-tradable 50 27.6 15.1
Source: Author’s calculations
Moreover, an average mark-up of 26.4 p.p. for Manufacturing and one of 27.3 p.p. for Non-manufacturing, compare to 24.7 p.p. and 29.5 p.p. found in Amador and Soares (2013), respectively.
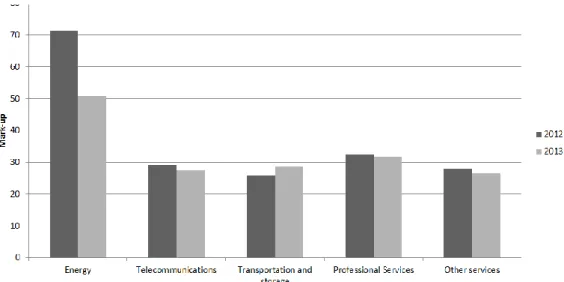
For the sake of simplicity, in the present paper, we proceed to a direct analysis of critical markets – defined as those being intervened by product market reforms with the goal of fostering competition. One of the most relevant areas was related with Energy Costs – in this regard, liberalization measures have been put trough to allow alternatives for the end consumer and push prices down. From Table 8, there is evidence of a significant decrease in the mark-up from 2012 to 2013, which signals stronger competition. Regarding costs of professional and other services, there is evidence of a slight decrease. In perspective, reforms taken in these areas are expected to take more time to accrue effects.
24
Table 8 – Selected Sectors, Comparison 2012-2013
Source: Author’s calculations
Comparing overall mark-ups of five relevant areas for 2012 and 2013, one can note positive improvements. From Figure 7, it is clear that only the mark-up for Transportation and Storage increased from one year to the other. The generic trend seems to be diminishing mark-ups, which indicate higher competition.
Source: Author’s calculations
7. Concluding remarks
Concluding, the continuous monitoring of deviations from the perfect competition paradigm within markets is of extreme policy relevance, particularly in the case of underperforming economies. The methodology used in this paper proves to be practical and well customized for the available microeconomic data.
Area
2012 2013 Change
Mark-up B. Power Mark-up B. Power Mark-up B. Power
Energy Costs 71.2 33.5 50.8 13.6 -20.5 -19.9
Cost of professional services 32.5 20.1 31.9 19.1 -0.6 -1.0
Cost of other services 28.0 15.5 26.7 18.8 -1.3 3.4
25
Lastly, from now on, an easier and faster monitoring of market-level mark-ups is possible thanks to the reduction of the entry costs associated with the estimation of price-cost margins.
8. References
Amador and Soares. 2013. Competition in the portuguese economy:estimated price-cost margins
under imperfect labour markets. Working Papers.
Blanchard and Giavazzi. 2003. Macroeconomic effects of regulation and deregulation in goods and
labor markets.
Oliveira Martins et al. 1996. Mark-up pricing - market structure and business cycle. European Commission. 2014. Market Reforms at Work.
Amoroso et al. 2011. Firm level productivity under imperfect competition in ouput and labor markets. Estrada, Ángel. 2009. Mark-ups in the spanish economy: international comparison and recent
evolution.
Dobbelaere, Sabien. 2005. Joint Estimation of Price Cost Margins and Union Barg Power - Belgian
Manufacturing.
Konings and Vandenbussche. 2005. Antidumping protection and markups of domestic firms. Crépon et al. 2007. Price-cost margins and rent sharing: Evidence from a Panel of French
Manufacturing.
Everaert and Schule. 2006. Structural Reforms in the Euro Area: Economic Impact and Role of
Synchronization Across Markets and Countries.