RESEARCH ARTICLE
Assessing acoustic communication active space in the Lusitanian
toadfish
Daniel Alves1,*, M. Clara P. Amorim2and Paulo J. Fonseca1
ABSTRACT
The active space of a signal is an important concept in acoustic communication as it has implications for the function and evolution of acoustic signals. However, it remains mostly unknown for fish as it has been measured in only a restricted number of species. We combined physiological and sound propagation approaches to
estimate the communication range of the Lusitanian toadfish’s
(Halobatrachus didactylus) advertisement sound, the boatwhistle (BW). We recorded BWs at different distances from vocalizing fish
in a natural nesting site at ca. 2–3 m depth. We measured the
representation of these increasingly attenuated BWs in the auditory pathway through the auditory evoked potential (AEP) technique. These measurements point to a communication range of between 6 and 13 m, depending on the spectral characteristics of the BW. A similar communication range (ca. 8 m) was derived from comparing sound attenuation at selected frequencies with auditory sensitivity. This is one of the few studies to combine auditory measurements with sound propagation to estimate the active space of acoustic signals in fish. We emphasize the need in future studies for estimates of active space to take informational masking into account.
KEY WORDS: Information masking, Fish, Communication range, AEP technique, Auditory evoked potential, Boatwhistle
INTRODUCTION
Acoustic communication is a widespread phenomenon across vertebrates (Bradbury and Vehrencamp, 1998), as well as other taxa (e.g. insects; Hedwig, 2014) and it is used in a great variety of contexts such as advertisement, courtship, spawning, agonistic interactions, competitive feeding or disturbance (Bradbury and Vehrencamp, 1998; Hedwig, 2014). To be effective, acoustic signals produced by the sender must be correctly perceived by the receiver (Bradbury and Vehrencamp, 1998).
In some behavioural contexts, such as mate attraction, it is advantageous for the emitter to maximize its communication range, i.e. the area/volume around an individual where communication with conspecifics can occur (Clark et al., 2009). However, in close-range interactions, acoustic signals with decreased active space may also evolve (e.g. Reichard and Anderson, 2015). Independently of sound source characteristics (e.g. amplitude level), the communication range of an acoustic signal will be limited by the environmental sound propagation properties and ambient noise conditions that will act as an‘acoustic filter’ (Fine and Lenhardt,
1983). Therefore, the effective communication distance has important implications for the evolution and function of acoustically mediated behaviour (Bradbury and Vehrencamp, 1998). This parameter has been studied in a variety of terrestrial animals (e.g. insects – Kostarakos and Römer, 2010; anurans – Kuczynski et al., 2010; birds– Brenowitz, 1982; reptiles – Todd, 2007; mammals – de La Torre and Snowdon, 2002) but poorly addressed in aquatic animals such as fish (e.g. Radford et al., 2015). In general, underwater acoustic communication has received less attention than terrestrial acoustic communication, probably due to technical difficulties. Most studies on the communication range of aquatic animals have been carried out with cetaceans (e.g. Janik, 2000; Sirović et al., 2007; Tervo et al., 2012). Although teleost fish are considered the largest group of vocal vertebrates (Ladich, 2004), communication range estimation in this group is so far restricted to a small number of species in shallow water conditions (e.g. Fine and Lenhardt, 1983; Myrberg et al., 1986; Mann and Lobel, 1997; Lugli and Fine, 2003; Locascio and Mann, 2011; Ghahramani et al., 2014; Holt and Johnston, 2015; Radford et al., 2015). Sound propagation is reduced in shallow waters, where low frequency sounds, such as most fish vocalizations (Amorim, 2006), are strongly attenuated with distance (Bass and Clark, 2003; Mann, 2006). Depending on the species, estimated ranges vary from a few centimetres to tens of metres (Amorim et al., 2015).
The Lusitanian toadfish Halobatrachus didactylus (Bloch and Schneider 1801) is a member of the family Batrachoididae that inhabits coastal waters and estuaries (Roux, 1986). It is a benthic species with an unusually rich vocal repertoire (Amorim et al., 2008) that produces sounds in both reproductive and agonistic contexts (dos Santos et al., 2000; Vasconcelos et al., 2010). During the breeding season, males aggregate in nesting areas close to the substrate and produce advertisement calls– the boatwhistle (BW) – to attract mates (Jordão et al., 2012; Vasconcelos et al., 2012). The BW is the most commonly produced acoustic signal in this species throughout the year (Amorim et al., 2006, 2008, 2010). Halobatrachus didactylus has been used in both behavioural (e.g. Vasconcelos et al., 2010; Ramos et al., 2012; Conti et al., 2015) and physiological (e.g. Vasconcelos and Ladich, 2008; Vasconcelos et al., 2011a,b) studies, making it an excellent model species for the assessment of active space of acoustic signals in fish. Here, we aimed to estimate the communication range in the Lusitanian toadfish using complementary physiological and sound propagation approaches.
MATERIALS AND METHODS
Auditory evoked potential (AEP) technique Test subjects
Lusitanian toadfish were collected in the Tagus estuary (Portugal) from trawling by local fishermen during the months of December 2013 to February 2014. After collection, fish were transported to the laboratory at the University of Lisbon (Portugal), where they were kept in aerated 80 l stock tanks equipped with protein skimmers,
Received 18 November 2015; Accepted 4 February 2016 1
Departamento de Biologia Animal and cE3c - Centre for Ecology, Evolution and Environmental Changes, Faculdade de Ciências, Universidade de Lisboa, Lisbon 1749-016, Portugal.2MARE– Marine and Environmental Sciences Centre, ISPA-Instituto Universitário, Lisbon 1149-041, Portugal.
*Author for correspondence (dbalves@fc.ul.pt)
Journal
of
Experimental
under a 12 h:12 h light:dark cycle, and fed with shrimp once a week. Water temperature ranged between 15 and 17°C, falling within natural values. We used a total of 13 adult fish (8 males and 5 females), with an average standard length of 26.8 cm (range 16.3– 37.9 cm), and an average body mass of 590 g (range 110–1450 g). All experiments were performed in accordance with local regulations.
Measuring AEPs in response to conspecific sounds
Fish were anaesthetized in a 0.01% ethyl p-aminobenzoate (Alfa Aesar, Karlsruhe, Germany) saltwater bath and then immobilized by an intramuscular injection of gallamine triethiodide (10– 15 µg kg−1; Sigma-Aldrich, Saint-Louis, MO, USA). Test subjects were positioned just below the water surface, except for the uppermost part of the head where the recording electrode was placed, in the middle of a round plastic experimental tank (diameter 36 cm, water depth ca. 18 cm), with the otolithic endorgans kept at about 7 cm above the vibrating disc of the sound-generating device. The tank was placed on a vibration isolation table inside a Faraday cage. All recording and sound-generating equipment were kept outside the Faraday cage. Fish gills were perfused with saltwater through a T-split tube positioned in the mouth using a simple temperature-controlled (21±1°C) gravity-fed water system.
Acoustic stimuli (BWs), generated by a PC, were fed via the D/A output of an Edirol UA-25EX (Roland Corporation, Tokyo, Japan; 48 kHz, 16 bit), amplified (custom-built amplifier) and delivered, with alternated phase, through a custom-made underwater sound-generating device. This device, centred within the tank, was composed of an immersed Plexiglas disc (8 cm diameter, 8 mm thick) attached to a rod, which was driven by a damped mechanical wave driver (SF9324, PASCO, Roseville, CA, USA) kept below the experimental tank. Because the mechanical wave driver is uncoupled from the experimental tank, it does not transmit extraneous mechanical noise to it. The rod crossed the tank bottom through a water-restraining flexible device, which not only prevented water drainage but also kept the rod vertically aligned.
Before each experiment, auditory stimuli were calibrated using a precision hydrophone (8104 Bruël & Kjaer, Naerum, Denmark; sensitivity−205 dB re. 1 V µPa−1) with its acoustic centre located 7 cm above the disc, the same position occupied by the fish’s hearing organs during the recordings. The hydrophone was connected to a sound level meter (Mediator, 2238, Bruël & Kjaer) and the acoustic signal was digitized (Edirol UA-25EX, Roland Corporation; 48 kHz, 16 bit) and then monitored by a laptop running Adobe Audition 3.0 (Adobe Systems Inc., CA, USA). This allowed us to verify, and if needed to adjust, the amplitudes of the auditory stimuli.
The recording electrode was pressed against the skin of the fish’s head directly above the hindbrain, while the ground electrode was placed between the eyes. The AEPs were amplified (Grass CP511, Grass Instruments, USA; gain 20,000×, high pass 10 Hz, low pass 1000 Hz), digitized with the A/D input of the same Edirol device (48 kHz sampling frequency) and recorded with the same PC running Adobe Audition 3.0. The auditory stimuli and the AEP recordings were continuously monitored with an oscilloscope.
Sound stimuli
We made synchronous recordings of BWs produced by breeding territorial males in the natural nesting habitat (Air Force Base 6, Montijo, Portugal; 38°42′ N, 8°58′ W). BWs were registered at different distances from the sound-producing fish (0.1, 2.5, 5, 7.5, 10, 12.5 and 15 m; hydrophones kept at 0.1 m above the substrate).
These recordings were made with equalized hydrophones (High Tech 94 SSQ, High Tech Inc., Gulfport, MS, USA; frequency response: 30 Hz to 6 kHz ±1 dB; voltage sensitivity:−165 dB re. 1 VμPa−1) connected to a multichannel recording device (M-Audio Fast Track Ultra 8R, M-Audio, Irwindale, CA, USA; 8 kHz, 16 bit) controlled by a laptop computer running Adobe Audition 3.0. All BWs were recorded with water levels ranging from 2.2 to 2.6 m. The recording obtained at 0.1 m was adjusted to a playback amplitude of 140 dB sound pressure level (SPL; re, 1 µPa), corresponding to the amplitude of BWs produced by a vocalizing nesting male (Vasconcelos and Ladich, 2008). The sounds recorded at the other distances were modified by the same factor in order to preserve the amplitude gradient measured in the nesting habitat with distance. These BWs were then played back to the subject fish and the AEP responses recorded. Each stimulus was presented 500 times at opposite polarities, with intervals between presentations equal to 50% of the stimulus duration.
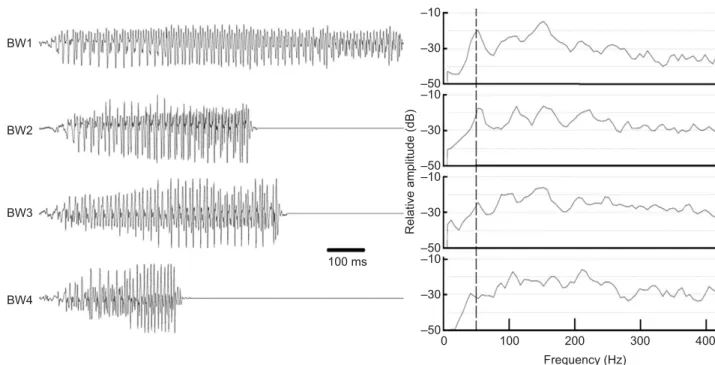
To represent the variability of the Lusitanian toadfish BW (Amorim and Vasconcelos, 2008), four different BWs were used as stimuli (Fig. 1), differing in duration (418–1006 ms) and dominant frequency [ca. 50–150 Hz; fast Fourier transform (FFT) 8192 points, Hamming window]. Each experimental subject was tested with two different BWs.
Amplitude modulation representation
We used the protocol described in Vasconcelos et al. (2011a) to estimate the maximum distance at which each fish correctly represented the features of a BW. In brief, we compared the envelope (amplitude modulation) of the BW recorded at 0.1 m with the envelope of the AEP responses to the same BW recorded at various distances (both positive and negative envelopes). Stimuli and response envelopes were extracted with a moving average (7 ms) of maximum amplitude values of a waveform. The variations of envelopes of stimulus and AEP response were compared using Pearson’s correlation. Response thresholds were estimated with Pearson’s correlations between the envelopes of the stimulus BW and the AEP response to silence in all the experimental trials (hereafter called the threshold criteria). The threshold was defined as the average plus twice the standard deviation of the values of these correlation coefficients. The longest distance at which the Pearson’s correlation coefficient between the envelopes of BW and respective averaged AEP was above threshold was considered the maximum distance at which the BW was correctly perceived.
Signal averaging was performed with custom-written software (P.J.F. and M. Vieira). This software is available from the authors. The Pearson’s correlation analysis was performed with Statistica 12.0 (StatSoft, Inc., USA).
Sound propagation
To measure sound attenuation in the natural breeding habitat, we compared recordings of BWs of nesting fish registered at 0.1 m with simultaneous recordings of the same BWs obtained at different distances (see above).
We further compared played back sounds recorded with a hydrophone (High Tech 94 SSQ) positioned at doubling distances (0.5, 1, 2, 4, 8, 16 m) from an underwater speaker (Clark AQ339, Lubell Labs, Whitehall, OH, USA), using as a reference the recording of a similar hydrophone kept at 0.1 m from the speaker. These measurements were conducted at Air Force Base 6 (Montijo, Portugal) with a 2- and 5-m-high water column. The sea had very small waves on an almost windless day. The sounds, fed to the loudspeaker through an amplifier (Blaupunkt GTA 260, Hildesheim,
Journal
of
Experimental
Germany), were produced with a multifunction I/O USB device (NI USB– 6521, National Instruments, Austin, TX, USA) controlled by software custom-written (P.J.F.) in LabView (v8.2, National Instruments), and consisted of frequency sweeps (0.01 to 1000 Hz) with a 500 ms duration, repeated 25 times with 100 ms pauses. The output of both the reference and testing hydrophones was simultaneously recorded with the same multifunction board.
Comparisons of the reference sound with attenuated sounds were made by computing with the same LabView software the averaged transfer function spectra and the coherence function of the distant hydrophone relative to the reference hydrophone. The sound sampling was delayed relative to the recording of the hydrophone close to the speaker to take into account the sound propagation delay from the speaker to the distant hydrophone. The hydrophone recordings were calibrated by comparison with a Bruël & Kjaer type 8104 hydrophone conditioned by a Sound Level Meter (Mediator 2238) with a linear frequency weighting and set on fast measuring mode. The coherence function is a normalized measure of the degree of causality (or degree of relationship) between two signals (here, the voltage signals measured by both hydrophones) and varies between 0 and 1. High values indicate that the recorded sound is highly related to the stimulus sound. We only considered data with coherence values above 0.9. Hence, we selected 120, 240 and 540 Hz as these are multiples of 60 Hz, a common fundamental frequency in this species (Vasconcelos et al., 2010). Notice that we excluded 120 Hz at 2 m depth and 16 m distance, and 540 Hz at 5 m depth and 16 m distance because they did not meet the coherence value criterion. Moreover, we could not measure the attenuation around the fundamental frequency because the loudspeaker was not able to transmit such frequencies with enough power.
RESULTS
BW propagation loss
The BWs (BW1–4) recorded in shallow waters of the natural toadfish breeding habitat suffered strong attenuation with distance
(Figs 2 and 3A). When compared with the measurements of the reference hydrophone (0.1 m), the attenuation averaged 17 dB in the first 2.5 m. An additional 7 dB attenuation was found 5 m away from the vocal fish, and the progressive loss of sound energy was to about −35 dB at a distance of 15 m. From 5 m onward, the attenuation was almost constant, with an average of 2.1–2.7 dB per 2.5 m. As expected, the attenuation varied throughout the frequency range of the BW, with lower frequencies exhibiting a stronger attenuation with increasing distance (Fig. 3B,C). As different fish produce BWs with different spectral energy distributions (BW1–4; Fig. 1), they suffered different attenuations. BW1 and BW2 were more severely attenuated than BW3 and BW4 (cf. Fig. 2), as the 100 ms 0 100 200 300 400 Frequency (Hz) –10 –30 –50 –10 –30 –50 –10 –30 –50 –10 –30 –50 Relative amplitude (dB) BW1 BW2 BW3 BW4
Fig. 1. Oscillograms and power spectra for the four boatwhistles (BWs) that were used as stimuli. The boatwhistles were recorded in the field 0.1 m away from the vocal male. Power spectra [fast Fourier transform (FFT), 8192 points, Hamming window] are shown as relative amplitude. The dashed line highlights the typical fundamental frequency of the BWs.
Relative amplitude (dB) 0 –5 –10 –15 –20 –25 –30 –35 –40 –45 0 2 4 6 8 10 12 14 16 Distance (m) BW1 BW2 BW3 BW4
Fig. 2. Relative amplitude of each of the four BWs used in this study as a function of the distance from the sound-producing fish in the natural habitat. Amplitudes (total root mean square power) are shown relative to the intensity registered at 0.1 m from the vocal male. The line indicates the mean. See Materials and methods for recording conditions.
Journal
of
Experimental
former BWs presented stronger lower frequency components than the latter (note differences in the fundamental frequency around 50 Hz; Fig. 1), which attenuate faster in shallow waters.
Single frequency propagation
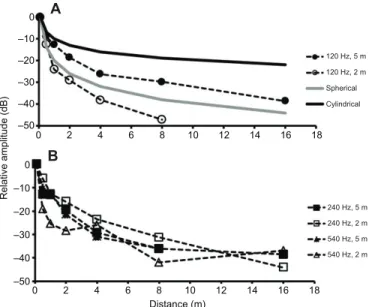
We measured the attenuation close to the substrate of selected frequencies corresponding to the first and third harmonics of the BWs in the same toadfish breeding habitat and at different water-column heights. The use of single frequencies allows the reduction of confounding effects caused by non-linearities of the loudspeakers, and also the detection of possible anomalies in the sound propagation caused, for instance, by acoustic interactions or filter properties of the environment (e.g. effect of substrate and surface). Fig. 4 depicts the propagation loss for sound at three different frequencies (120, 240 and 540 Hz). At 2 m depth, these measurements exhibit stronger attenuation than BWs produced by a vocalizing fish (cf. Fig. 2). For example, while BWs attenuated 15–19 dB and 30–38 dB at 2 and 15 m from the source, respectively, these frequencies decreased 15–29 dB and 37– 44 dB, at 2 and 16 m, respectively. Propagation at 120 Hz was strongly affected by depth; attenuation was greater at 2 m than at 5 m depth for 120 Hz at all tested distances (e.g. 13 dB versus 29 dB at 1 m distance; 26 dB versus 38 dB at 4 m distance; Fig. 4A). While the 540 Hz tone seemed to follow this trend (although the pattern was less obvious than with 120 Hz), this seemed to be reversed for the 240 Hz tone up to 10–12 m from the source (Fig. 4B). At the distance corresponding to the average communication range (8 m), the attenuation varied between 30 and 45 dB. In addition to these
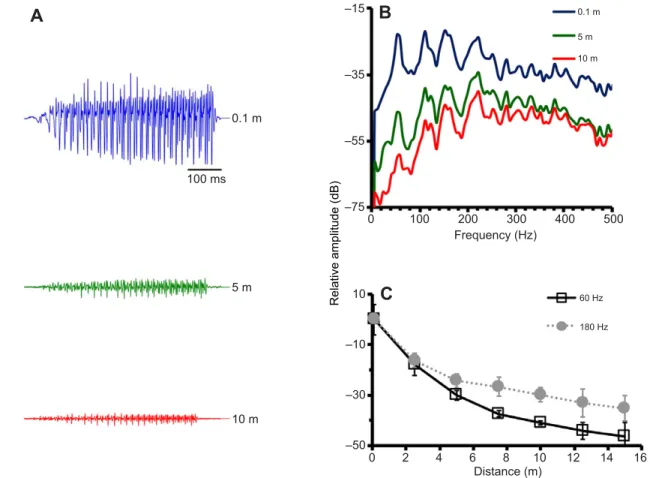
selected frequencies, we investigated the propagation loss of the fundamental and the third harmonic of the BWs used in our study (Fig. 3C). Attenuation for 60 and 180 Hz followed a similar pattern to that for 120 and 240 Hz and at ca. 8 m (7.5 m) the average attenuation was comparable, varying between 27 and 37 dB.
In general, propagation loss fell between the ranges predicted by spherical and cylindrical propagation models. The only exception was the 120 Hz tone with the lower 2 m water column, which attenuated stronger than the predictions of the spherical propagation model (Fig. 4A).
AEP response to natural sounds
To estimate the distance at which the receiver’s auditory pathway can represent a BW, we compared the envelopes of the AEP responses with the envelope of the stimulus BW recorded at 0.1 m from the vocal fish, using both the upper and lower AEP envelopes for the Pearson’s correlation. Fig. 5 shows an example of AEP responses to a BW (BW2) recorded at different distances from the source and the corresponding averaged AEP. Additionally, Fig. 5A depicts the positive amplitude envelopes for the more intense sound and its corresponding AEP.
Amplitude fluctuations of BWs recorded at 0.1 m from the fish were well represented in the AEP response (Fig. 5A). The responses to the 5 m-attenuated stimuli (Fig. 5B) showed lower amplitude as expected (compare the amplitude scales in Fig. 5). Nevertheless, amplitude fluctuations were still partly preserved. The AEP response to the same BW recorded at 10 m (Fig. 5C) no longer represented the envelope of the original sound.
A
B
C
0.1 m 5 m 10 m 100 ms 0.1 m 5 m 10 m 60 Hz 180 Hz 0 2 4 6 8 10 12 14 16 Distance (m) 0 100 200 300 400 500 Frequency (Hz) –15 –35 –55 –75 10 –10 –30 –50 Relative amplitude (dB)Fig. 3. Representation of attenuation of BWs in the natural environment. (A) Oscillograms of BW2 recorded at different distances from the vocal fish. (B) Power spectra (FFT, 8192 points, Hamming window) obtained for BW2 at the same distances as in A. (C) Average propagation loss at 60 and 180 Hz of the BWs used in our study for all recorded distances. Values are relative to the intensity registered at 0.1 m from the vocal male (error bars represent s.d.).
Journal
of
Experimental
Table 1 shows an estimation based on threshold criteria of the maximum distance at which the amplitude fluctuations of each BW were still represented in the AEPs and thus probably perceived by each fish. The mean maximum distance varied between 6.4 m (BW2) and 13.2 m (BW4). Table 1 also shows differences in putative detection distances for the four BWs.
DISCUSSION
In this study, we estimated the communication range of the Lusitanian toadfish advertisement BW, the most commonly produced sound in this species (Amorim et al., 2006, 2008). We used two different methods to provide an estimate for the communication range of the BW: a sound-propagation experiment in the natural environment and a physiological evaluation of hearing ability for BWs recorded in the field.
BW propagation in the natural environment
BWs suffered strong attenuation with distance in the natural toadfish breeding habitat as expected for shallow water. Low-frequency sounds with wavelengths longer than the height of the water column are strongly attenuated in natural environments (Bass and Clark, 2003; Mann, 2006). Because BWs have fundamental frequencies of ca. 50–60 Hz (sound wavelength λ≈25–30 m), water depth at our breeding study site (<5 m) will impact sound propagation. Indeed, frequency components corresponding to a wavelength approximately four times longer than the water depth are below the cut-off frequency dictated by the high-pass filter properties of the medium and their propagation will be strongly hampered (Mann, 2006).
In addition, the radiation pattern of the sound source should also influence sound attenuation. For example, the sound-producing swimbladder in the oyster toadfish, Opsanus tau, was described as a complex mixed-sound radiator with monopole, dipole and quadrupole components (Fine et al., 2001). The acoustic near-field of such a source (usually up to λ/2π metres) can be quite complex with acceleration, velocity, net fluid displacement and sound pressure decreasing faster than expected for a geometric
spreading model (6 dB per doubling distance, which is the attenuation in the far-field; Bass and Clark, 2003). Although the swimbladder of the Lusitanian toadfish presents a different morphology, a complex radiation pattern should also be expected. This may explain why the attenuation of the BWs in the natural environment was very high close to the sound-producing fish, with a steep slope in the first few metres. At greater distances, the attenuation was lower and became more uniform (Fig. 2).
Amorim and Vasconcelos (2008) reported an attenuation of 21 dB from 0.5 to 4 m for BWs emitted from a speaker. Although the depth was not mentioned, these values are in accordance with our findings. Other Batrachoidids present similar attenuation sounds in the natural environment. For example, in the plainfin midshipman, Porichthys notatus, the advertisement hum attenuated
0 –10 –20 –30 –40 –50 0 –10 –20 –30 –40 –50 0 2 4 6 8 10 12 14 16 18 0 2 4 6 8 10 12 14 16 18 Distance (m) 120 Hz, 5 m 120 Hz, 2 m Spherical Cylindrical 240 Hz, 5 m 240 Hz, 2 m 540 Hz, 5 m 540 Hz, 2 m A B Relative amplitude (dB)
Fig. 4. Propagation loss of selected frequencies at a breeding site of Lusitanian toadfish (Tagus estuary) at different water-column heights (2 and 5 m). Frequencies: 120 Hz (A); 240 and 540 Hz (B). Amplitudes are shown relative to the intensity registered 0.1 m away from the loudspeaker.
A
B
C
100 ms 10 µv 0.5 µv 0.5 µvFig. 5. Example oscillograms of stimuli and respective auditory evoked potential responses, as well as the amplitude modulations (envelopes) obtained in each case for a fish responding to BW2. Stimuli (upper traces) recorded at 0.1 m (A), 5 m (B) and 10 m (C) together with the respective auditory evoked potentials (AEPs; lower traces). To estimate the distance at which the receiver’s auditory pathway can represent a BW, we compared the envelopes of the AEP responses with the envelope of the stimulus BW recorded at 0.1 m from the vocal fish, using both the upper and lower envelopes for the Pearson’s correlation. Although only the upper trace is depicted, both the upper and lower envelopes were used. Note that the scale bars to the right of the oscillograms represent the same amplitude because the amplitude of the stimulus in A is much larger than that in the other panels.
Journal
of
Experimental
close to 20 dB from 0.5 to 3 m (5 m depth) from a vocal male (Bass and Clark, 2003). The advertisement BW in O. tau was reduced by 17 dB between 1 and 5 m distance (0.75–1.2 m depth) from the male (Fine and Lenhardt, 1983), while in the Gulf toadfish, Opsanus beta, it was attenuated by approximately 22 dB between 0.1 and 2.5 m distance (∼1 m depth) (Remage-Healey and Bass, 2005). For fish of other families, the attenuation described has been lower (e.g. 7–9 dB attenuation from 1 to 3 m from the vocal male, 1– 4 m depth, in the Hawaiian sergeant damselfish, Abudefduf abdominalis; Maruska et al., 2007), and the model for sound degradation in the black drum, Pogonias cromis (7 m depth), predicts much lower attenuations (Locascio and Mann, 2011).
Single frequency propagation
Water-column height had an important effect in the propagation of the selected frequencies as there were significant differences in sound attenuation at distances above 0.5 m between 2 and 5 m water depth (Fig. 2).
At 2 m depth, the 120 Hz tone (a frequency strongly represented in many BWs; see Fig. 1) had an amplitude loss around 45 dB 8 m away from the speaker (see Fig. 4). Considering a level of 140 dB re. 1 µPa at 0.1 m (Vasconcelos and Ladich, 2008), a loss of 45 dB would mean that the 120 Hz frequency is close to the hearing threshold for the BW of ca. 98 dB measured with the AEP technique (Vasconcelos et al., 2011a). Note that the attenuation for the 60 Hz component of the BW had a similar value (ca. 40 dB at a distance of 7.5 m; see Fig. 3C). Therefore, a receiver would have very little energy available to listen to a conspecific at around 8 m distance.
The remaining studied frequencies, while still within the hearing range of this species (Vasconcelos et al., 2011b), have a smaller contribution for the overall BW energy (Fig. 1). These frequencies were also attenuated at 8 m from the speaker to amplitude values that were close to the 98 dB hearing threshold (Vasconcelos et al., 2011a). Thus, 8 m seems to be a reasonable approximation for the maximum communication range estimated with this method.
The propagation of almost all the selected frequencies fell between a spherical and a cylindrical propagation model (Fig. 4; for a review of these models, see Bass and Clark, 2003; Mann, 2006). However, the attenuation of the 120 Hz tone with a 2 m water column was even greater than for the spherical propagation model. Using eqn 8 in Mann (2006) with the velocity for sound propagation in a sandy substrate (1600 m s−1), we obtain a cut-off frequency of 539 Hz for a 2 m water column and a cut-off frequency of 216 Hz for a 5 m column. As 120 Hz is below these cut-off frequencies, as well as most BW energy, this probably contributes to further limit its propagation. This intense attenuation of low-frequency sounds in the breeding environment should restrain the communication range
in this habitat. Moreover, propagation of these frequencies in such shallow waters is a very complex phenomenon where reflection and refraction play an important role (Bass and Clark, 2003; Mann, 2006). However, these factors are hard to model because they generate very complex sound fields and the properties of the substrate have also to be taken into account. All these factors may explain why the models do not accurately account for our propagation data. These factors could also be a possible explanation for the fact that the 240 Hz tone suffered less attenuation with a 2 m than with a 5 m water column (Fig. 4).
In summary, the water-column height seems to play a very important role in shaping the communication range in this species, as expected. Although we did not register or test the propagation of BWs at 5 m or deeper waters, we expect that at these depths the attenuation of low frequencies should be less intense (Fig. 4) and, because the BWs have more energy at low frequencies (Fig. 1), the structure of the BWs should be maintained at larger distances. Congruently, tide level has been shown to influence the number of BWs produced by nesting males and the characteristics of these BWs. Males calling from nests in the upper infralitoral zone exhibited a marked circatidal rhythm, with a higher BW production in the high tide (Amorim et al., 2011). These changes in vocal behaviour probably reflect a strategy to minimize vocal activity costs, i.e. the relationship between the vocal effort and communication range.
AEP response to natural sounds
Our results indicate that the BWs can be detected up to a distance of 6–13 m (Table 1). This difference seems to depend mostly on the spectral content of the sound and not on redundancy conferred by longer duration. BW2 and BW3 have similar durations but differ by about 4 m in maximum detection distance, while BW1 and BW2 present similar maximum detection distances but have a 300 ms duration difference. However, spectral characteristics affect sound attenuation (see above) and hence its detection by fish. BWs with more energy in the lower frequency components (BW1 and BW2) propagated less and presented shorter detection distances as estimated by AEPs (7 and 6 m) than BWs (BW3 and BW4) with more energy at higher frequencies (10 and 13 m). The expected communication ranges for the different BWs estimated with AEPs are in agreement with the estimations using sound propagation methods. These distances are slightly longer than the ones reported for other Batrachoidids such as P. notatus (Ibara et al., 1983) and O. tau (Fine and Lenhardt, 1983). However, both of these studies were conducted with lower water-column heights. Communication range estimations in fish of other families have varied from tens of centimetres in the Padanian goby, Padogobius bonelli (Lugli and Fine, 2003), to tens of metres in Pogonias cromis (Locascio and Mann, 2011). Direct comparisons should be made with caution as
Table 1. Estimated maximum distance at which the fish is able to correctly encode the amplitude modulations of the stimulus boatwhistle
BW1 BW2 BW3 BW4
Fish Detection distance (m) Fish Detection distance (m) Fish Detection distance (m) Fish Detection distance (m)
2 7.5 2 10 1 12.5 1 15 6 10 3 7.5 4 7.5 3 7.5 7 5 5 5 6 10 4 12.5 8 5 8 5 9 10 5 15 10 10 9 7.5 10 12.5 7 15 11 5 11 5 12 10 12 15 13 5 13 12.5
Mean 7.1 Mean 6.4 Mean 10.4 Mean 13.2
Fish are grouped by the different boatwhistles (BWs) used as a stimulus (see Materials and methods).
Journal
of
Experimental
differences in the environmental conditions of the experiments, such as water-column height or distance from the emitter fish to the substrate, will influence these estimations.
The present study points to the Lusitanian toadfish communication range being more limited by audition than affected by the background noise in the studied habitat. Most experimental fish stopped perceiving the BWs correctly at distances where the amplitudes registered were well above the hearing threshold described for this species. Using the attenuation values in Fig. 2, at 10 m from the sound-producing fish, the BW would have an amplitude close to 110 dB, considering a source level of 140 dB re. 1 µPa at 10 cm (Vasconcelos and Ladich, 2008). This value is over 10 dB above the described threshold for this species (ca. 98 dB) (Vasconcelos et al., 2011a). This contrasts with what Locascio and Mann (2011) have reported for P. cromis. In their work, they compared the propagation of calls in the natural environment with the hearing capabilities of one fish. They concluded that the limiting factor for communication is environmental noise because environmental noise is higher than the hearing threshold. Most other studies that have estimated the acoustic communication range of fish have either determined the maximum distance for signals to become indistinguishable from the background noise (Fine and Lenhardt, 1983; Mann and Lobel, 1997; Lugli and Fine, 2003) or assumed that the limiting factor for the communication range is environmental noise (Radford et al., 2015). Notably, thresholds in our study are not based on the presence of a biological response in the auditory pathway but on a correct representation of the acoustic signal envelope. Therefore, we are testing informational masking of acoustic signals and not energetic masking (Clark et al., 2009). Signal degradation should make signals lose their informational content before its energy is undetectable from background noise. Therefore, animals may have trouble retrieving information from acoustic signals in the environment at the communication ranges estimated through energetic masking that characterize many studies.
Demonstration of the communication distance at which fish are capable of extracting relevant information from conspecific sounds is probably only possible with behavioural experiments. To the best of our knowledge, there are no studies that measure the communication range in the field based on information criteria. For instance, Myrberg et al. (1986) report that females are attracted to playbacks of male sounds up to 10 m away from the speaker and that they show preference for the sound of a larger male. However, because no other sounds were tested, it remains to be clarified whether the phonotaxis range described was due to information extraction from the sound or simply triggered by cues such as frequency or energy.
In summary, we show that the communication range of the Lusitanian toadfish advertisement BW varies on average between 6 and 13 m, an estimation that is corroborated by comparing the attenuation of selected frequencies measured in the natural habitat with the hearing sensitivity of the fish. We highlight the importance of estimating communication active space by taking into account the perception of the information content in acoustic signals and not just energy detection.
Acknowledgements
We thank Air Force Base No. 6 of Montijo (Portugal) for allowing us to conduct sound recordings of toadfish adults in their military establishment. We would also like to thank Andreia Ramos for her help with the fieldwork and Manuel Vieira for help with the averaging software.
Competing interests
The authors declare no competing or financial interests.
Author contributions
D.A. conceived the experimental design, carried out the AEP experiments and analysed their results, and drafted the article. M.C.P.A. helped design the experiments, supervised the experimental work and critically reviewed the article. P.J.F. conceived the experimental design, supervised the experimental work, carried out the sound propagation experiments and analysed their results, and critically reviewed the manuscript.
Funding
This study was funded by the Science and Technology Foundation, Portugal [grant SFRH/BD/48015/2008 to D.A. and pluriannual programme UI&D 331/94 and UI&D 329, and the strategic projects UID/MAR/04292/2013 and UID/BIA/00329/2013 granted to MARE (M.C.P.A.) and to cE3c (P.J.F.)].
Data availability
Custom-written software (P.J.F. and M. Vieira) for signal averaging is available on request from the authors.
References
Amorim, M. C. P. (2006). Diversity of sound production in fish. In Communication in Fishes, Vol. I (ed. F. Ladich, S. P. Collin, P. Moller and B. G. Kapoor), pp. 71-105. Enfield: Science Publishers.
Amorim, M. C. P. and Vasconcelos, R. O. (2008). Variability in the mating calls of the Lusitanian toadfish Halobatrachus dydactilus: cues for potential individual recognition. J. Fish Biol. 73, 1267-1283.
Amorim, M. C. P., Vasconcelos, R. O., Marques, J. F. and Almada, F. (2006). Seasonal variation of sound production in the Lusitanian toadfish Halobatrachus didactylus. J. Fish Biol. 69, 1892-1899.
Amorim, M. C. P., Simões, J. M. and Fonseca, P. J. (2008). Acoustic communication in the Lusitanian toadfish, Halobatrachus didactylus: evidence for an unusual large vocal repertoire. J. Mar. Biol. Assoc. UK 88, 1069-1073. Amorim, M. C. P., Simões, J. M., Fonseca, P. J. and Almada, V. C. (2010).
Patterns of shelter usage and social aggregation by the vocal Lusitanian toadfish. Mar. Biol. 157, 495-503.
Amorim, M. C. P., Simões, J. M., Almada, V. C. and Fonseca, P. J. (2011). Stereotypy and variation of the mating call in the Lusitanian toadfish, Halobatrachus didactylus. Behav. Ecol. Sociobiol. 65, 707-716.
Amorim, M. C. P., Vasconcelos, R. O. and Fonseca, P. J. (2015). Fish sounds and mate choice. In Sound Communication in Fishes (ed. F. Ladich), pp. 1-33. Wien: Springer-Verlag.
Bass, A. H. and Clark, C. W. (2003). The physical acoustics of underwater sound communication. In Springer Handbook of Auditory Research (ed. A. M. Simmons, A. N. Popper and R. R. Fay), pp. 15-64. New York: Springer-Verlag Inc. Bradbury, J. W. and Vehrencamp, S. L. (1998). Principles of Animal
Communication. Sunderland: Sinauer Associates.
Brenowitz, E. A. (1982). The active space of red-winged blackbird song. J. Comp. Physiol. A 147, 511-522.
Clark, C. W., Ellison, W. T., Southall, B. L., Hatch, L., Van Parijs, S. M., Frankel, A. and Ponirakis, D. (2009). Acoustic masking in marine ecosystems: intuitions, analysis, and implication. Mar. Ecol. Prog. Ser. 395, 201-222.
Conti, C., Fonseca, P. J., Picciulin, M. and Amorim, M. C. P. (2015). How effective are acoustic signals in territorial defence in the Lusitanian toadfish? J. Exp. Biol. 218, 893-898.
de la Torre, S. and Snowdon, C. T. (2002). Environmental correlates of vocal communication of wild pygmy marmosets, Cebuella pygmaea. Anim. Behav. 63, 847-856.
dos Santos, M. E., Modesto, T., Matos, R. J., Grober, M. S., Oliverira, R. F. and Canário, A. (2000). Sound production by the Lusitanian toad fish, Halobatrachus didactylus. Bioacoustics 10, 309-321.
Fine, M. L. and Lenhardt, M. L. (1983). Shallow-water propagation of the toadfish mating call. Comp. Biochem. Physiol. A Mol. Integr. Physiol. 76, 225-231. Fine, M. L., Malloy, K. L., King, C., Mitchell, S. L. and Cameron, T. M. (2001).
Movement and sound generation by the toadfish swimbladder. J. Comp. Physiol. A Sens. Neural. Behav. Physiol. 187, 371-379.
Ghahramani, Z. N., Mohajer, Y. and Fine, M. L. (2014). Developmental variation in sound production in water and air in the blue catfish Ictalurus furcatus. J. Exp. Biol. 217, 4244-4251.
Hedwig, B. (ed.) (2014). Insect Hearing and Acoustic Communication. Berlin: Springer-Verlag.
Holt, D. E. and Johnston, C. E. (2015). Traffic noise masks acoustic signals of freshwater stream fish. Biol. Conser. 187, 27-33.
Ibara, R. M., Penny, L. T., Ebeling, A. W., Van Dykhuizen, G. and Cailiet, G. (1983). The mating call of the plainfin midshipman fish, Porichthys notatus. In Predators and Prey in Fishes (ed. D. L. Noakes, D. G. Linquist, G. S. Helfman and J. A. Ward), pp. 205-212. Dordrecht: Dr W Junk publishers.
Janik, V. M. (2000). Source levels and the estimated active space of bottlenose dolphin (Tursiops truncatus) whistles in the Moray Firth, Scotland. J. Comp.
Physiol. A 186, 673-680.
Journal
of
Experimental
Jordão, J. M., Fonseca, P. J. and Amorim, M. C. P. (2012). Chorusing behaviour in the Lusitanian Toadfish: should I match my neighbours’ calling rate? Ethology 118, 885-895.
Kostarakos, K. and Rö mer, H. (2010). Sound transmission and directional hearing in field crickets: Neurophysiological studies outdoors. J. Comp. Physiol. A 196, 669-681.
Kuczynski, M. C., Vélez, A., Schwartz, J. J. and Bee, M. A. (2010). Sound transmission and the recognition of temporally degraded sexual advertisement signals in Cope’s gray treefrog (Hyla chrysoscelis). J. Exp. Biol. 213, 2840-2850. Ladich, F. (2004). Sound production and acoustic communication. In The Senses of Fish: Adaptations for the Reception of Natural Stimuli (ed. G. von der Emde, J. Mogdans and B. G. Kapoor), pp. 210-230. Dordrecht: Kluwer.
Locascio, J. V. and Mann, D. A. (2011). Localization and source level estimates of black drum (Pogonias cromis) calls. J. Acoust. Soc. Am. 130, 1868-1879. Lugli, M. and Fine, M. L. (2003). Acoustic communication in two freshwater gobies:
ambient noise and short-range propagation in shallow streams. J. Acoust. Soc. Am. 114, 512-521.
Mann, D. A. (2006). Propagation of fish sounds. In Communication in Fishes, Vol. I (ed. F. Ladich, S. P. Collin, P. Moller and B. G. Kapoor), pp. 107-120. Enfield: Science publishers.
Mann, D. A. and Lobel, P. S. (1997). Propagation of damselfish (Pomacentridae) courtship sounds. J. Acoust. Soc. Am. 101, 3783-3791.
Maruska, K. P., Boyle, K. S., Dewan, L. R. and Tricas, T. C. (2007). Sound production and spectral hearing sensitivity in the Hawaiian sergeant damselfish, Abudefduf abdominalis. J. Exp. Biol. 210, 3990-4004.
Myrberg, A. A., Mohler, M. and Catala, J. D. (1986). Sound production by males of a coral reef fish (Pomacentrus partitus): its significance to females. Anim. Behav. 34, 913-923.
Radford, C. A., Ghazali, S., Jeffs, A. G. and Montgomery, J. C. (2015). Vocalisations of the bigeye Pempheris adspersa: characteristics, source level and active space. J. Exp. Biol. 218, 940-948.
Ramos, A., Fonseca, P. J., Modesto, T., Almada, V. C. and Amorim, M. C. P. (2012). Alloparental behavior in the highly vocal Lusitanian toadfish. J. Exp. Mar. Biol. Ecol. 434-435, 58-62.
Reichard, D. G. and Anderson, R. C. (2015). Why signal softly? The structure, function and evolutionary significance of low-amplitude signals. Anim. Behav. 105, 253-265.
Remage-Healey, L. and Bass, A. H. (2005). Rapid elevations in both steroid hormones and vocal signaling during playback challenge: a field experiment in Gulf toadfish. Horm. Behav. 47, 297-305.
Roux, C. (1986). Batrachoididae. In Fishes of the Northeastern Atlantic and the Mediterranean, Vol. III (ed. P. J. P. Whitehead, M. L. Bauchot, J. C. Hureau, J. Nielsen and E. Tortonese), pp. 1360-1361. Paris: Unesco.
Sirović, A., Hildebrand, J. A. and Wiggins, S. M. (2007). Blue and fin whale call source levels and propagation range in the Southern Ocean. J. Acoust. Soc. Am. 122, 1208-1215.
Tervo, O. M., Christoffersen, M. F., Simon, M., Miller, L. A., Jensen, F. H., Parks, S. E. and Madsen, P. T. (2012). High source levels and small active space of high-pitched song in bowhead whales (Balaena mysticetus). PLoS ONE 7, e52072. Todd, N. P. M. (2007). Estimated source intensity and active space of the American
alligator (Alligator Mississippiensis) vocal display. J. Acoust. Soc. Am. 122, 2906-2915.
Vasconcelos, R. O. and Ladich, F. (2008). Development of vocalization, auditory sensitivity and acoustic communication in the Lusitanian toadfish Halobatrachus didactylus. J. Exp. Biol. 211, 502-509.
Vasconcelos, R. O., Simões, J. M., Almada, V. C., Fonseca, P. J. and Amorim, M. C. P. (2010). Vocal behavior during territorial intrusions in the lusitanian toadfish: Boatwhistles also function as territorial“keep-out” signals. Ethology 116, 155-165.
Vasconcelos, R. O., Fonseca, P. J., Amorim, M. C. P. and Ladich, F. (2011a). Representation of complex vocalizations in the Lusitanian toadfish auditory system: evidence of fine temporal, frequency and amplitude discrimination. Proc. R. Soc. B Biol. Sci. 278, 826-834.
Vasconcelos, R. O., Sisneros, J. A., Amorim, M. C. P. and Fonseca, P. J. (2011b). Auditory saccular sensitivity of the vocal Lusitanian toadfish: low frequency tuning allows acoustic communication throughout the year. J. Comp. Physiol. A Neuroethol. Sens. Neural Behav. Physiol. 197, 903-913.
Vasconcelos, R. O., Carriço, R., Ramos, A., Modesto, T., Fonseca, P. J. and Amorim, M. C. P. (2012). Vocal behavior predicts reproductive success in a teleost fish. Behav. Ecol. 23, 375-383.