Characterization and expression of cytokinin signalling
genes in sulfur deficient grapevine (Vitis vinifera L.)
João Carlos Martins Fernandes
Dissertação para obtenção do Grau de Mestre em
Engenharia Agronómica
Orientador: Sara Barros Queiroz Amâncio Júri:
Presidente: Doutora Cristina Maria Moniz Simões de Oliveira, Professora Associada do Instituto Superior de Agronomia da Universidade Técnica de Lisboa
Vogais: Doutora Sara Barros Queiroz Amâncio, Professora Associada do Instituto Superior de Agronomia da Universidade Técnica de Lisboa
Doutora Maria Helena da Costa Ferreira Correia de Oliveira, Professora Associada do Instituto Superior de Agronomia da Universidade Técnica de Lisboa
Doutora Célia Maria Romba Rodrigues Miguel, Investigadora Auxiliar do Instituto de Tecnologia Química e Biológica
Agradecimentos
À Professora Doutora Sara Amâncio, pela sugestão do tema e orientação do trabalho, pela disponibilidade que sempre demonstrou, pela partilha de conhecimentos, pela sincera amizade um muito obrigado com o mais profundo reconhecimento.
À Engenheira Sílvia Tavares pela ajuda e orientação que me dispensou neste trabalho. À todos os colegas do Departamento de Botânica e Engenharia Biológica (DBEB/CBAA) pela ajuda dispensada em diversas situações, pela permanente disponibilidade e pela amizade de todos.
Ao estágio profissional concedido pelo IEFP, e ao projecto *POCTI/AGG/46607/2002* Sulfate assimilation and sulfur deficiency in grapevine (Vitis vinifera L.): a functional and molecular approach, aprovado pela FCT e POCTI, comparticipado pelo Fundo Comunitário Europeu FEDER que tornaram este trabalho possível.
Abstract
Sulfur (S) is an essential macronutrient for plant growth and development. In vitro grapevine
callus, cells and shoots in culture media in the absence of sulfur (-S) respond markedly with
a reduction of growth and shoot multiplication. This may result from an interference of -S with cytokinin signal pathway (CSP) or at shoot apical meristem (SAM) or axillary meristem (AM) identity level. Cytokinins are essential plant hormones that control various processes in plants. As in Arabidopsis, Vitis CSP is composed by receptors (HKs), phosphotransmitters (HPTs) and two types of response regulators (A-type and B-type RRs). Cells in -S in the presence of cytokinin show a downregulation of most CSP genes while -S without cytokinin leads to an upregulation of A-type RRs. CSP is not significantly affected by –S in in vitro shoots, so the multiplication inhibition can be caused by a downregulation of the expression of SAM and AM identity genes, respectively STM and LAS. In vitro conditions more similar to autotrophy as Temporary Immersion System, the scarce multiplication impairment must result from the reduction of B-type RRs transcription. As a whole the present work provides new insights on the crosstalk between –S and cytokinin signaling in in vitro grapevine model systems.
Resumo
O enxofre é um macronutriente essencial ao crescimento das plantas. Callus, células e “plantinhas” de videiras in vitro, quando colocadas na ausência de enxofre (-S), registaram uma redução da sua taxa de crescimento. Este fenómeno pode dever-se à interferência do –S na via de sinalização das citocininas (VSC) ou devido a uma alteração nos genes responsáveis pela identidade do meristema apical e axilar. A citocinina é uma hormona que controla vários fenómenos nas plantas. Tal como em Arabidopsis, a VSC em videira é constituída por receptores HKs, HPTs e dois tipos de RR (RR Tipo A e B). Células em –S e na presença de citocinina mostraram uma diminuição na transcrição dos gene da VSC, quando em meio sem citocinina os RR tipo A aumentam a sua expressão. Os genes VSC de “plantinhas” in vitro, não são significativamente afectados em –S, a inibição do crescimento pode dever-se à diminuição da transcrição dos genes de identidade do meristema apical e axilar, STM e LAS respectivamente. Em condições mais semelhantes ao autotrofismo, como em TIS, a redução no crescimento das plantas pode dever-se a uma diminuição da taxa de transcrição do RR tipo B. Este trabalho fornece novas perspectivas da relação entre o –S e a sinalização das citocininas em videira.
Palavras Chave: Enxofre, meristema apical, meristema axilar, via de sinalização das citocininas, videira.
Resumo alargado
O enxofre desempenha um papel fundamental nas plantas devido ao seu papel crucial no metabolismo. As plantas têm a capacidade de reduzir o SO42- a S2- que depois é assimilado sobre a forma de cisteína. A absorção a partir do solo é realizada por transporte activo usando dois tipos de transportadores, de alta ou baixa afinidade, sendo os transportadores de alta afinidade fortemente transcritos numa situação de carência de enxofre. A assimilação de enxofre inicia-se com a activação do sulfato, que é convertido em APS. Em seguida o APS é reduzido, numa reacção de dois passos, dando origem a S2-. Por fim a cisteína incorpora o S2- através da acção das enzimas SAT e OASTL. Recentemente todos estes genes foram também identificados em videira.
Videiras in vitro, num meio sem sulfato, apresentam uma redução no seu crescimento (branching). O peso fresco de callus sujeito à carência de sulfato sofreu uma redução acentuada em relação a cultura com sulfato. Durante as duas primeiras semanas a diferença entre as duas culturas não é significativa, só após a quarta semana as diferenças são significativas, com a diminuição do peso fresco na cultura sem sulfato. A taxa relativa de crescimento apresenta a mesma tendência. Os rebentos em caixa e em TIS apresentam a mesma tendência de diminuição do peso fresco e número de novos lançamentos, apesar do efeito de branching em TIS não ser tão acentuado. Este fenómeno pode dever-se a uma alteração da via do sinal das citocininas ou à alteração da expressão dos genes ligados à identidade do meristema.
A citocinina é uma importante hormona das plantas que controla vários aspectos do seu desenvolvimento como a divisão celular. A via do sinal das citocininas foi descoberta em várias espécies como Arabidopsis, milho e arroz. Em Arabidopsis o sinal desta hormona é transmitido pelo que é conhecido como “two-component system”. A hormona é percepcionado por receptores de membrana conhecidos como Histidina Cinase (HK), estes vão transferir um grupo fosfato ao componente seguinte da cadeia os Fosfotransmissores de Histidina (HPts), estes vão transferir novamente o grupo fosfato ao componente seguinte na via, os Reguladores de Resposta (RR) tipo-B, por sua vez estes actuam como factores de transcrição dos RR tipo-A que produzem uma determinada resposta à presença da citocinina. Em Arabidopsis existem 3 HKs, 5 HPts, 11 RRs tipo-B e 12 RR tipo-A. Com a descoberta do genoma da videira foi possível identificar os componentes da via de sinalização das citocininas. Na videira foram identificados 3 HKs (VvCyt1, VvCyt2 e VvCyt3), quatro HPts (VvHP1, VvHP2, VvHP3 e VvHP4), 4 RRs tipo-A (VvRRa1, VvRRa2, VvRRa3 e
VvRRa4) e 6 RRs tipo-B (VvRRb1, VvRRb2, VvRRb3, VvRRb4, VvRRb5 e VvRRb6). Através da análise filogenética podemos concluir que estes genes apresentam uma grande semelhança com os genes já descritos em outras espécies, tanto monocotiledónias como dicotiledónias, o que nos permite concluir que esta via foi conservada ao longo do período evolutivo das plantas.
A técnica de PCR em tempo real e largamente usada para estudar a expressão de genes em diferentes condições experimentais. Por isso escolhemos esta técnica para estudar o efeito da ausência de sulfato na via da sinalização da citocinina e nos genes ligados à identidade do meristema apical e axilar. Ao nível do receptor apenas os genes VvCyt1 e
VvCyt2 responderam, na ausência de sulfato VvCyt2 apresentou uma diminuição na
quantidade de transcrito. Na ausência de sulfato e citocinina, apenas VvCyt1 respondeu, também com uma redução da sua taxa de transcrição. No entanto a taxa de transcrição destes genes não foi alterada em plantas em meio gelificado (GM). Em células, os dois genes HPs (VvHP2 e VvHP3) foram afectados pela carência de enxofre, diminuindo a sua taxa de transcrição. Nas células sem enxofre e sem citocinina o nível transcrição também diminuiu, indicando que o efeito combinado é semelhante ao de ausência de enxofre. Em GM os HPs não foram afectados pela diminuição do sulfato. Em células em cultura a expressão dos genes VvRRa3 e VvRRa4 foi também afectada pela carência de sulfato, mas a sua expressão foi afectada diferencialmente dependendo da presença ou ausência de citocinina no meio. Na presença de citocinina a expressão de VvRRa4 diminuiu enquanto na ausência de citocinina o gene VvRRa3 aumentou a sua expressão. Este resultado aparentemente contraditório pode ser explicado pela capacidade dos RR funcionarem como reguladores positivos ou negativos do sinal da citocinina. Em células e em GM os RRs tipo B não foram afectados pela ausência de enxofre ou de citocinina no meio; apenas em plantas em Sistema de Imersão Temporária (TIS) estes foram afectados, o que indica que a condição mais próxima da autotrófia afecta a sua taxa de transcrição levando a uma diminuição do sinal das citocininas.
A ausência de enxofre do meio pode também afectar a proliferação de células ao nível do meristema apical e axilar. Em videira foram identificados 3 genes ligados a identidade do meristema apical (VvWus, VvCLV e VvSTM). Apenas VvSTM e afectado pela ausência de sulfato, sofrendo uma redução da taxa de transcrição. Em Arabidopsis o STM é responsável pela manutenção de um nicho de células indiferenciadas no meristema apical. Com a redução da transcrição a planta perde a capacidade de repor estas células, não ocorrendo a renovação do meristema apical. Ao nível do meristema axilar foram identificados 5 genes (VvBRC1, VvBRC2, VvLAS, VvRAX e VvREV). Em plantas em GM apenas VvBRC1,
VvBRC2 e VvLAS foram afectados pela diminuição de enxofre no meio, sofrendo uma redução da sua taxa de transcrição. Em Arabidopsis os genes BRC1 e BRC2 são responsáveis pela diminuição do número de lançamentos laterais logo se a sua taxa de transcrição diminui ocorre um aumento do número de lançamentos laterais. Em Arabidopsis, o gene LAS é necessário para a iniciação do meristema. Os resultados obtidos confirmaram que a diminuição da transcrição do gene VvLAS conduziu à incapacidade da planta de obter um meristema funcional, apesar da diminuição na transcrição dos genes VvBRC1 e
Index
1. Introduction 1
1.1. Sulfur 1
1.1.1 Sulfur nutrition and plant defense against pathogens 1 1.1.2. Sulfur in grapevine nutrition and health 2
1.2. Sulfate as the main sulfur source 3
1.2.1. Grapevine sulfate uptake and sulfate transporters 3
1.3. Sulfate assimilation 4
1.3.1. Regulation of sulfate assimilation by sulfur availability 5 1.3.2. Grapevine genes for sulfate assimilation enzymes 6 1.3.3. Expression of V. vinifera sulfur assimilation genes 6
1.4. Cytokinin 6
1.4.1. Signal perception and transduction 7
1.4.2. Cross-talk between mineral nutrition and cytokinin signalling 10
1.5. Shoot apical meristem (SAM) 12
1.5.1. Regulation of shoot apical meristem 13
1.5.2. Hormones and shoot apical meristem 15
1.6. Axillary meristem 16
1.7. Objectives 18
2. Material and methods 19
2.1. Plant material 19
2.1.1. Growth conditions of Vitis callus 19
2.1.2. Growth conditions of cell suspensions 20
2.1.3. Growth conditions of in vitro shoots 20
2.1.3.2. Temporary immersion system (TIS) 21
2.2. Determination of growth parameters 22
2.2.1. Biomass of callus and cells 22
2.2.2. Growth parameters of in vitro shoots 22
2.3. Total chlorophyll and chlorophyll a/b ratio 22
2.4. Sequence retrieval and database search 23
2.5. Gene expression 23
2.5.1. RNA extraction and cDNA preparation 23
2.5.2. Purification and sequencing of DNA fragments 26 2.5.3. Gene expression analysis by Real-Time PCR 26
2.6. Statistics 27
3. Results 28
3.1. Physiology of experimental systems under sulfate deficiency 28
3.1.1. Relative growth of Vitis callus 28
3.1.2. Growth of Vitis cells in cytokinin deficiency 30
3.1.3. Growth of in vitro shoots 30
3.1.3.1. In gel medium (GM) 30
3.1.3.1.1. Fresh Weight and Relative Growth Rate 30
3.1.3.1.2. Branching 31
3.1.3.1.3. Total chlorophyll and chlorophyll a/b ratio 32
3.1.3.2. In Temporary immersion system (TIS) 33
3.1.2.2.1. Branching 33
3.1.2.2.2. Total chlorophyll and chlorophyll a/b ratio 34 3.2. Identification and characterization of genes associated with cytokinin signalling 35
3.2.1. Cytokinin receptor (HK) 36
3.2.3. A-type response regulator (RRa) 37
3.2.4. B-type response regulator (RRb) 38
3.3. Analysis of RT-PCR products 39
3.3.1. Cytokinin signalling genes in Vitis cells 39 3.3.2. Cytokinin signalling and meristem identity genes in TIS plantlets 41 3.4. Expression levels of cytokinin signalling and apical and axillary genes: effect of –S
conditions 43
3.4.1. Vitis cells in the presence of cytokinin 43
3.4.2. Vitis cells in the absence of cytokinin 45
3.4.3. Vitis GM Shoots 48
3.4.4. Vitis TIS plantlets 50
4. Discussion 53
5. Conclusion 61
References 62
Table index
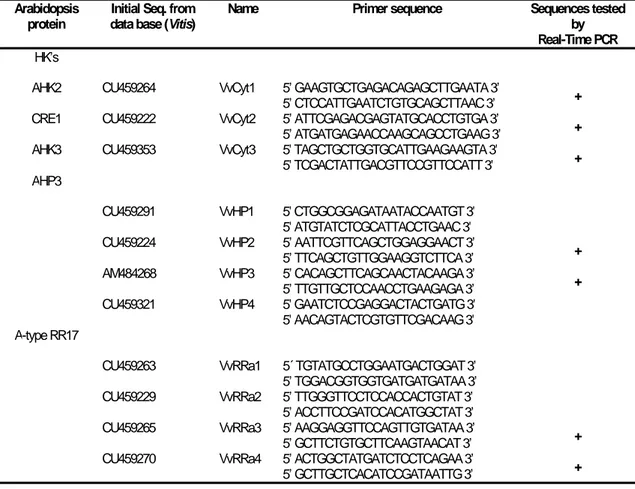
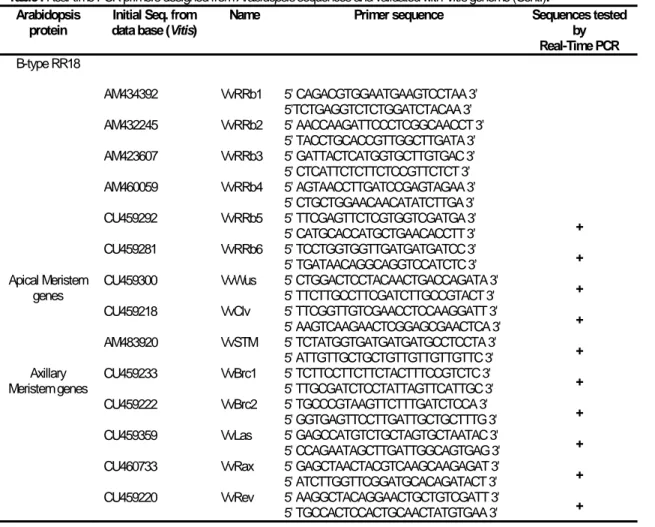
Table I Real-time PCR primers designed from Arabidopsis sequences and validated with
Vitisgenome. 24
Table II Dry weight/Fresh weight ratio of Vitis callus in +S and –S growing conditions. Vitis
callus were grown for 2, 4 and 6 weeks in modified MS medium with (+S) and without
Figures index
Fig. 1 Model for the cytokinin multistep two-component circuitry through histidine (H), and aspartate
(D) phosphorelay, involving histidine-kinase receptors (HK), phosphotransfer proteins (HPT), a “pseudo–HPT” with an asparagine (N) instead of the D, and A-type and B-type RRs (Müller
and Sheen, 2007). 8
Fig. 2 Structures of cytokinin receptors and other proteins of the cytokinin signalling pathway. Amino
acids that participate in the phosphorelay are circled. Other characteristic consensus motifs are also indicated. Abbreviations: aa, amino acids; AD, acidic domain; CHASE, cyclases/histidine kinases associated sensory extracellular; GARP, DNA-binding motif; HK, histidine kinase; LB, putative ligand binding domain; NLS, nuclear localisation signal; OD, output domain; RD, receiver domain; RLD, receiver-like domain; TM, transmembrane domain (Heyl and Schmülling, 2003). 10
Fig. 3 Histology of the shoot apical meristem (SAM). a) zones of SAM defined by cytoplasmic
densities and cell division rate: peripheral zone (PZ); central zone (CZ) and rib zone (RZ); b) SAM defined by different clonally distinct layers of cells: epidermal layer (L1); subepidermal layer (L2) and Corpus (L3) (Bowman and Eshed, 2000). 13
Fig. 4 Expression patterns of genes involved in maintaining the integrity of the central zone.
CLAVATA3 (CLV3), CLAVATA1 (CLV1) WUSCHEL (WUS) and FILAMENTOUS FLOWER
(FIL) (Bowman and Eshed, 2000). 15
Fig. 5 Vitis callus in MS -S and +S medium after the first week of the first growth cycle. 19
Fig. 6 Vitis cells growing for two weeks in a modified MS without sulfate (-S) or MS (+S) in liquid
medium 20
Fig. 7. Grapevine in vitro shoots in GM growing conditions. In vitro shoots were grown for 4 weeks in a
modified MS medium without sulfate (-S) or MS (+S). 21
Fig. 8. Temporary Immersion System (TIS). Grapevine in vitro shoots were grown for three weeks in a
modified MS medium without sulfate (-S) or MS (+S). 21
Fig. 9 Fresh weight of Vitis callus in deficient (–S) and replete (+S) conditions grown for 2, 4 and 6
weeks. Bars represent means of the FW of 4 Vitis callus taken randomly ± SD. --- represents the FW of callus at installation of each cycle. Different letters indicate significant differences at
Fig. 10. Relative Growth Rate (RGR) of Vitis callus in deficient (–S) and replete (+S) sulfate conditions grown for 2, 4 and 6 weeks. Bars represent means of 4 callus samples taken randomly ± SD. Different letters indicate significant differences at p<0.05. 29
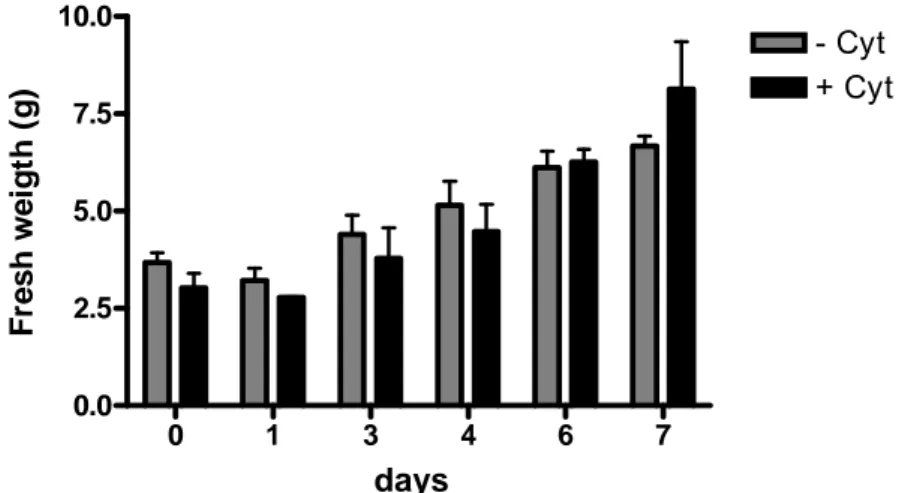
Fig. 11 Fresh weight of Vitis cells grown for 7 days in replete (+S) MS medium in the absence (-Cyt) or
in the presence (+Cyt) of cytokinin. Bars represent means of the FW taken randomly ± SD. 30
Fig. 12 Fresh weight of grapevine in vitro shoots in +S and –S growing conditions. In vitro shoots were
grown for 2, 4 and 6 weeks in modified MS medium without (-S) and with (+S) sulfur. Each bar is the mean of the FW of ten in vitro shoots ± SD. Different letters indicate significant
differences at p<0.05. 31
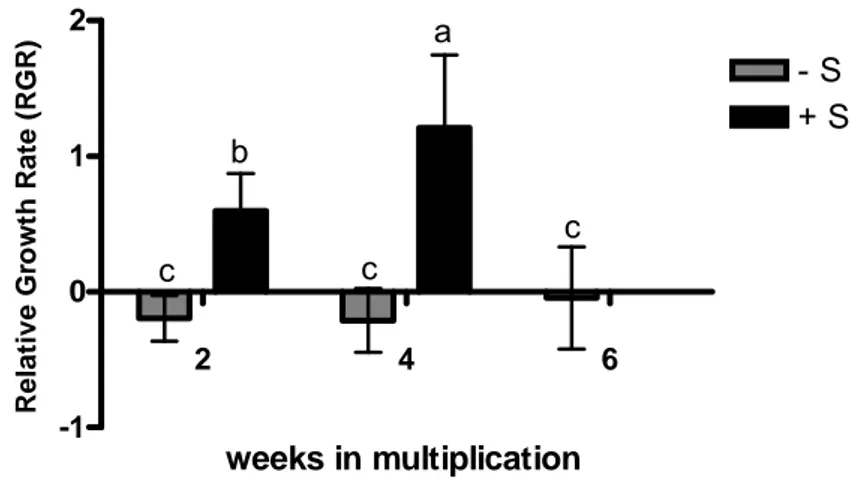
Fig. 13 Relative Growth Rate (RGR) of in vitro shoots in deficient (–S) and replete (+S) multiplication
conditions grown for 2, 4 and 6 weeks. Bars represent means of 40 (2nd week), 60 (4th week) and 20 (6th week) samples taken randomly ± SD. Different letters indicate significant
differences at p<0.05. 31
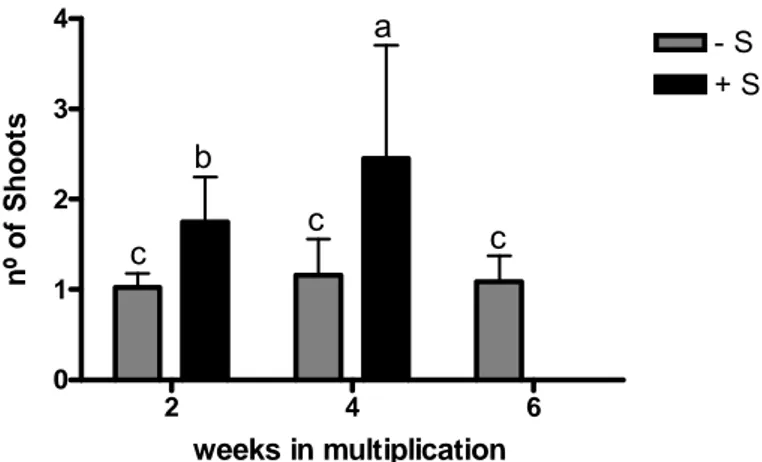
Fig. 14 Number of shoots produced by one single node of in vitro shoots grown for 2, 4 and 6 weeks
in deficient (–S) and replete (+S) multiplication conditions. Bars represent means of 40 (2nd
week), 60 (4th week) and 20 (6th week) samples taken randomly from two independent
experiments ± SD. Different letters indicate significant differences at p<0.05. 32
Fig. 15 Total chlorophyll (mg cm-2) in leaves of in vitro shoots grown for 2, 4 and 6 weeks in deficient
(–S) and replete (+S) multiplication conditions. Bars represent means of 10 samples taken randomly ± SD. Different letters indicate significant differences at p<0.05. 32
Fig. 16 Chlorophyll a/b ratio in leaves of in vitro shoots grown for 2, 4 and 6 weeks in deficient (–S)
and replete (+S) multiplication conditions. Bars represent means of 10 samples taken
randomly ± SD. 33
Fig. 17 Number of shoots produced by one single node of in vitro shoots grown for 0, 2 and 3 weeks
in deficient (–S) and replete (+S) multiplication conditions. Bars represent means of 30 (1st week), 6 (2nd week) and 15 (3rd week) samples taken randomly ± SD. Different letters indicate significant differences at p<0.05. 34
Fig. 18 V. vinifera shoots grown for two weeks in deficient (–S) and full (+S) sulfate conditions in TIS,
(n=15 shoots). 34
Fig. 19 Total chlorophyll (mg cm-2) in leaves of in vitro shoots in TIS grown for 3 weeks in sulfate
deficient (–S) and replete (+S) multiplication conditions ± SD. Different letters indicate significant differences at p<0.05. 35
Fig. 20 Ratio chlorophyll a/b in leaves of in vitro shoots grown for 3 weeks in sulfate deficient (-S) and replete (+S) multiplication conditions. Different letters indicate significant differences at p<0.05.
35
Fig. 21 Phylogenetic tree for HKs. The circled assignments correspond to sequences analyzed by real
time PCR for Vitis cells gene expression. The phylogenetic tree was constructed using the PHYLIP programs, PRODIST and NEIGHBOR (Felsenstein, 2005). 36
Fig. 22 Phylogenetic tree for HPs. The circled assignments correspond to sequences analyzed by real
time PCR for Vitis cells gene expression. The phylogenetic tree was constructed using the PHYLIP programs, PRODIST and NEIGHBOR (Felsenstein, 2005). 37
Fig. 23 Phylogenetic tree for RRa. The circled assignments correspond to sequences analyzed by
real time PCR for Vitis cells gene expression. The phylogenetic tree was constructed using the PHYLIP programs, PRODIST and NEIGHBOR (Felsenstein, 2005). 38
Fig. 24 Phylogenetic tree for RRb. The circled assignments correspond to sequences analyzed by real
time PCR for Vitis cells gene expression. The phylogenetic tree was constructed using the PHYLIP programs, PRODIST and NEIGHBOR (Felsenstein, 2005). 38
Fig. 25 PCR products from Vitis cells resolved on 1.5 % (W/V) agarose gel, 1) VvCyt1, 2) VvCyt2 and
3) VvCyt3. 39
Fig. 26 RR PCR products resolved on 1% (w/v) agarose gels. A) A-type RR and B) B-type RR. 1)
VvRRa1, 2) VvRRa2, 3) VvRRa3, 4) VvRRa4, 5) VvRRb1, 6) VvRRb2, 7) VvRRb3, 8)
VvRRb4, 9) VvRRb5, and 10) VvRRb6. 40
Fig. 27 HP PCR products resolved on 1% (w/v) agarose gels. 1) VvHP2, 2) VvHP3, 3) VvHP4. 40
Fig. 28 PCR products resolved on 1.5 % (W/V) agarose gel. A) Shoot and B) Root. 1) VvCyt1, 2)
VvCyt2, 3) VvCyt3, 4) VvHP1, 5) VvHP2, 6) VvHP3, 7) VvHP4, 8) VvRRa1, 9) VvRRa2, 10)
VvRRa3, 11) VvRRa4, 12) VvRRb1, 13) VvRRb2, 14) VvRRb3, 15) VvRRb4, 16) VvRRb5, 17)
VvRRb6. 41
Fig. 29 VvCyt2, apical meristem and axillary meristem PCR products resolved in 1 % (w/v) agarose
gels in Shoot (S) and root (R). A) apical meristem genes, B) axillary meristem genes. 1)
VvWUS S, 2) VvWUS R, 3) VvCLV S, 4)VvCLV R, 5) VvSTM S, 6) VvSTM R, 7) VvBRC1 S,
8) VvBRC2 S, 9) VvLAS S, 10)VvRAX S, 11) VvREV S. 42
Fig. 30 Expression levels of VvCyts genes as quantified by real time PCR at days 1, 4 and 7 of -S
Fig. 31 Expression levels of VvHPs genes as quantified by real time PCR at days 1, 4 and 7 of -S treatment in the presence of cytokinin. 44
Fig. 32 Expression levels levels of VvRRs genes as quantified by real time PCR at days 1, 4 and 7 of
-S treatment in the presence of cytokinin. 44
Fig. 33 Expression levels of Vitis apical meristem genes as quantified by real time PCR at days 1, 4
and 7 of -S treatment in the presence of cytokinin. 45
Fig. 34 Expression levels of VvCyts genes as quantified by real time PCR at days 1, 4 and 7 of -S
treatment in the absence of cytokinin. 46
Fig. 35 Expression levels of VvHPs genes as quantified by real time PCR at days 1, 4 and 7 of -S
treatment in the absence of cytokinin. 46
Fig. 36 Expression levels of VvRRs genes as quantified by real time PCR at days 1, 4 and 7 of -S
treatment in the absence of cytokinin. 47
Fig. 37 Expression levels of Vitis apical meristem genes as quantified by real time PCR at days 1, 4
and 7 of -S treatment in the absence of cytokinin. 47
Fig. 38 Expression levels of VvCyt genes as quantified by real time PCR in GM after 4 weeks -S
treatment. 48
Fig. 39 Expression levels of VvHP genes as quantified by real time PCR in GM after 4 weeks -S
treatment. 48
Fig. 40 Expression levels of VvRRs genes as quantified by real time PCR in GM after 4 weeks -S
treatment. 49
Fig. 41 Expression levels of Vitis apical meristem genes as quantified by real time PCR in GM after 4
weeks -S treatment. 49
Fig. 42 Expression levels of Vitis axillary meristem genes as quantified by real time PCR in GM after 4
weeks -S treatment. 50
Fig. 43 Expression levels of VvCyt genes in TIS plantlets under +S and of -S treatment for two weeks
as quantified by real time PCR. 50
Fig. 44 Expression levels of VvHP genes in TIS plantlets under +S and of -S treatment for two weeks
as quantified by real time PCR. 51
Fig. 45 Expression levels of VvRR genes in TIS plantlets under +S and of -S treatment for two weeks
Fig. 46 Expression levels of Vitis apical meristem genes in TIS plantlets under +S and of -S treatment for two weeks as quantified by real time PCR. 52
Fig. 47 Expression levels of Vitis axillary meristem genes in TIS plantlets under +S and of -S
Abbreviations List
Act Actine
AM Axillary meristem
APS Adenosine 5’-phosphosulfate BA 6-benzylaminopurine
BRC BRANCHED
cDNA complementary DNA
CHASE Cyclases/histidine kinases associated sensory extracellular Chla Chlorophyll a
Chlb Chlorophyll b
CLV CLAVATA
CT Threshold cycle
CTAB Hexadecyltrimethylammonium bromide CZ Central zone
DMSO Dimetyl sulfoxide
EDTA Ethylenediamine tetraacetic acid GARP DNA-binding motif
GM Gel medium
GSH Reduced Glutathione HAST High-affinity sulfur transport
HK Histidine Kinase recepter HPt Histidine phosphotranfer protein IPT7 ISOPENTENYL TRANAFERASE 7 Km Michaelis-Menten constant KNOX1 KONTTED1-like homeobox
LAS LATERAL SUPRESSOR
LAST Low- affinity sulfur transport L1 Epidermal layer
L2 Subepidermal layer L3 Corpus
MS Murashige and Skoog medium NAA α-naphthaleneacetic acid OAS O-acetyl serine
OASTL O-acetyl-L-serine(thiol)-liase PVP-40T Polyvinylpyrrolidone PZ Peripheral zone
qrt RT-PCR Quantitative real-time PCR
RAX REGULATOR OF AXILLARY MERISTEMS
REV REVOLUTA/INTERFASCICULAR FIBERLESS
RGR Relative Growth Rate
RT-PCR reverse transcriptase polymerase chain reaction RR Response regulator protein
S Sulfur
SAM Shoot apical meristem SAT Serine acetyl transferase
STM SHOOT MERISTEMLESS
TAE Tris-acetate EDTA buffer TIS Temporary immersion system Tot Chl Total chlorophyll
VvBRC Vitis vinifera BRANCHED
VvClv Vitis vinifera CLAVATA
VvCyt Vitis vinifera cytokinin receptor
VvHP Vitis vinifera histidine phosphotransfer
VvLAS Vitis vinifera LATERAL SUPRESSOR
VvRAX Vitis vinifera REGULATOR OF AXILLARY MERISTEMS
VvREV Vitis vinifera REVOLUTA/INTERFASCICULAR FIBERLESS
VvRR Vitis vinifera response regulators
VvSTM Vitis vinifera SHOOT MERISTEMLESS
VvWUS Vitis vinifera WUSCHEL
WUS WUSCHEL
1. Introduction
1.1. Sulfur
Sulfur (S) is the 14th more abundant element on earth crust (Chalson et al., 1992), the 9th and least abundant essential macronutrient in plants (Saito, 2004). The inter-conversion of oxidized and reduced sulfur states, the biogeochemical sulfur cycle, depends mainly on microorganisms (Falkowski et al., 2008) and plants. The inorganic forms of S in soil consist mainly of sulfates (SO42-) (Mengel and Kirkby, 1978). Assimilatory reduction of sulfate ion integrates, together with O2 bioproduction, CO2 fixation, nitrate ion reduction and N2 fixation, the biological processes essential to aerobic life. In the reduced state, S is the key element of the amino acids cysteine and methionine (Xavier and LeGall, 2007). It is commonly accepted that the key function of sulfur is to provide disulfide bonds between amino acids within proteins. The thiol group of cysteine radical is fundamental for protein structure and function. Other thiol compounds more stable than cysteine, e.g. the tripeptide glutathione (GSH), concur to the cell redox regulation (Rouhier et al,. 2008). Plants, yeasts and some bacteria can reduce sulfur from the oxidation/reduction state of SO42- (+6) to the sulfide (S2-) state (-2).
Plants are able reduce SO42- to S2- and incorporate it into cysteine; then the greater part of sulfate taken up by plants is used for protein synthesis (Brunold, 1976). This explains the involvement of sulfur in most essential metabolic pathways and its key role in plant growth.
1.1.1. Sulfur nutrition and plant defense against pathogens
Plants do not accumulate or remobilize S-reserves (Mengel and Kirkby, 1978). In the past, the sulfur used by crop plants resulted from two sources: sulfur-containing fertilizers and/or sulfur in rainfall (Jolivet, 1993). Due to environmental policies both these sources were significantly reduced in the last 25 years: atmospheric sulfur deposition significantly decreased and many of the currently used mineral fertilizers lack sulfur (Blake-Kalff et al., 2000). Recent studies indicate that sulfur deficiency can be a limiting factor to crop yield and
quality (Saito, 2004; Hawkesford, 2005). Therefore, former research on plant adaptation to excessive inputs of sulfur due to aerial pollution moved now into the effects of S-deficiencies. It is demonstrated that sulfur nutrition exerts a positive influence of sulfur nutrition on plant health (Bloem et al., 2007). Elemental sulfur (S0) is probably the oldest pesticide, with references as old as 1000 BC (Williams and Cooper, 2004). Unexpectedly for eukaryotes, it was unraveled that some plant species produce S0 as a component of the defense system against vascular pathogens (Williams et al., 2002).
In the group of defense compounds are included several S-secondary plant metabolites (Hell and Kruse, 2007), namely glucosinolates and alliins (Schnug, 1997).
1.1.2. Sulfur in grapevine nutrition and health
References to sulfur use are found since ancient times, as in the Bible and in Greek and Roman literature. As early as more than 2000 years ago, Romans discovered the beneficial effects of sulfur as a potent agent against plant pathogens and refer the application of elemental sulfur in the vineyards (Rausch, 2007).
The effect of sulfur on plant growth, productivity and product quality mostly relates sulfur nutrition in interaction with nitrogen (Brunold, 1976; Byers et al., 1987; Schnug, 1997). In grapevine xylem sap while nitrate is the major anion sulfate, chloride and phosphate increase after N fertilizer treatments (Peuke, 2000). The protective effect of elemental S against grapevine pests and diseases has been mostly reported after foliar application although S-fertilization can substitute for fungicide application in crop protection from pest attack (Bloem
1.2. Sulfate as the main sulfur source
1.2.1. Grapevine sulfate uptake and sulfate transporters
Sulfate is acquired by plant roots from the soil by a multiphase rate mechanism (Clarkson et al. 1993). Two kinds of transporters mediate the initial uptake and the distribution of sulfate throughout the plant: one with low Km (10 μM) assuring a high-affinity sulfate transport (HAST), and another with much higher Km responsible for the low-affinity sulfate transport (LAST) (Amâncio et al., 2009).
The primary response of numerous plant systems under sulfur depletion is a clear upregulation (or derepression) of HAST, at the transcription level (Smith et al., 1995 1997, Leustek et al., 2000; Takahashi et al., 1997 2000; Shibagaki et al., 2002; Yoshimoto et al., 2002). The raise in the expression of sulfate transporter protein leads to an increase in uptake capacity (Hawkesford, 2000). Conversely, sulfate repletion leads to the down-regulation (or repression) of the transporters transcription (Maruyama-Nakashita et al., 2004). Apparently, the regulation imposed by sulfur-status at the molecular level is highly coordinated with the physiological responses, either in cells (Hatzfeld et al., 1998; Clarkson
et al., 1999) or at whole plant level (Clarkson et al., 1993; Smith et al., 1997).
The sulfate transporter sequences from different plant species, available in public databases, were organized into 5 groups based on the predicted protein sequences (Hawkesford, 2003). In Group 1 includes genes for HAST regulated by S external conditions. In Arabidopsis
thaliana genome, three different sulfate transporters were identified (Yoshimoto et al., 2003).
Previously to Vitis genome release, a homologous sequence from V. vinifera cv Touriga Nacional VvST (EF155630) was obtained by RT-PCR using degenerated primers (Tavares
et al., 2008). Through its protein (and nucleotide) sequence but also the molecular and
physiological data, VvST was assigned to sulfate transporter Group 1.
The grapevine genome release (Jaillon et al., 2007, Velasco et al., 2007) made it possible to identify nine protein sequences related to the sulfate transporter family. Phylogenetic analysis showed that these sequences can be assorted to three of the five sulfate transporter family groups (Amâncio et al., 2009).
The common characteristic among Group 2 sulfate transporters is its low affinity to sulfate, expressed mainly in vascular tissue of both root and shoots tissues. V. vinifera only has one isoform assigned to Group 2 (VvST2), that is expressed both in roots and isolated cells (Tavares et al., 2008).
Sulfate uptake by V. vinifera cells was significantly affected (Amâncio et al., 2009) under a time scale similar to that described previously for maize cells (Clarkson et al., 1999).In other systems like roots, after 15 days without S, the influx was twice the value of +S plants. The abundance of VvST mRNA matched the derepression of sulfate uptake capacity, suggesting a transcriptional regulation of the sulfate transport in response to S availability (Maruyama-Nakashita et al., 2004).
A large and diverse number of sulfate transporters isoforms has been assigned to Group 3 (Hawkesford and De Kok 2006). In Arabidopsis only one isoform is characterized to date, which, apparently, is not a functional transporter but can contribute to sulfate uptake when co-expressed with a Group 2 sulfate transporter (Kataoka et al., 2004). In V. vinifera genome six sequences fall to this group, confirming an apparent redundancy. Five out the six Group 3
V. vinifera sulfate transporters were expressed in roots and in culture cells, under a pattern
equivalent to other Group 3 sulfate transporters identified in other species (Amâncio et al., 2009).
1.3. Sulfate assimilation
The assimilation of sulfate is, with carbon fixation and nitrogen assimilation, one of the basic pathways used for the incorporation of inorganic elements into the organic molecules that drive cell metabolism. Up to 70% of the total sulfur content of plants is in the form of cysteine and methionine and this one’s mainly incorporated into proteins (Hankesford and De Kok, 2006). Plant SO42- assimilation involves three main steps: sulfate activation, sulfate reduction and sulfide assimilation and cysteine synthesis.
Sulfate (SO42-) is the most oxidative and thus stable form of sulfur present in the soil. Prior to reduction, sulfate is subjected to activation to adenosine 5’-phosphosulfate (5’-adenylylsulfate [APS]) for further conversion. Since the reaction equilibrium of ATP-S favours
the reverse reaction (ATP and SO42- formation) the activity of ATP-S depends on the consumption of APS in further reactions (Saito 2004).
The second step in sulfur assimilation is sulfate reduction. In plants, recent lines of evidence demonstrate that the two step-reduction of SO42- (S: +6) to S2- (S:-2) is carried out by GSH-APS reductase (two electrons) (GSH:GSH-APS sulforeductase,) and the plastid enzyme sulfite reductase (S2-: ferredoxin oxidoredutase, sulfite reductase, SIR) (Gutierrez-Marcos et al., 1996, 1997; Bick and Leustek 1998). The first reduction step is equivalent to the bacterial formation of free sulfite (SO32-) as a free intermediate. The reduction is completed by the production of sulphide S2- by the transfer of 6 electrons from reduced ferredoxin to sulfite to form sulphide (Amâncio et al., 2009).
Cysteine incorporates S2- by the activity of the complex serine acetyl transferase (SAT) and O-acetyl-serine sulfydrilase (O-acetyl–L-serine(thiol)-liase, OASTL). The level of free cysteine in plants is very low but the flux can be quite high (Höfgen and Hess 2007). The only direct carbon/nitrogen precursor for cysteine is O-acetyl serine (OAS), which results from the acetylation of serine by SAT. This substrate incorporates S2- into cysteine in a reaction catalysed by OASTL (Droux et al., 1998).
1.3.1. Regulation of sulfate assimilation by sulfur availability
Removal of S supply cause an increase in the protein activity or mRNA pools of some enzymes responsible for the uptake and the assimilatory pathway, such increase is observed after several days in whole plants (Hell et al., 1997; Buchner et al., 2004) or several hours in cell suspensions (Hatzfeld et al., 1998). Following re-supply of SO42- all fall in parallel with cysteine and GSH increase. In most plant systems analyzed so far, sulfate, cysteine, and GSH are described as negative regulators and OAS as positive regulator of sulfur genome (Droux, 2004). GSH-APS reductase is thought to be a prime regulation point of the pathway (Vauclare et al., 2002), since its activity and RNA increase concomitantly with S starvation and with stresses that increase the demand for GSH and then for cysteine (Amâncio et al., 2009).
1.3.2.
Grapevine genes for sulfate assimilation enzymes
Partial sequences of V. vinifera genes encoding for APR, SAT and OASTL were identified. They were cloned and deposited at GenBank, respectively (EU275236), (EU275238) and (EU275237) (Amâncio et al., 2009). Subsequently to grapevine genome sequencing (Jaillon
et al., 2007; Velasco et al., 2007), sequences of genes for putative isoforms of sulfate
assimilation enzymes were identified in databases.
For APS two isoforms were identified in V. Vinifera genome, VvATPS-1 and VvATPS-2. Unlike A. thaliana where 4 different APSR isoforms were described, only one isoform is present in grapevine, VvAPSR. As in Arabidopsis one sole isoform of sulfite reductase is present in Vitis, VvSIR (Amâncio et al., 2009).
1.3.3.
Expression of V. vinifera sulfur assimilation genes
The analysis of the expression of genes for sulfate metabolism enzymes in response to sulfate depletion in grapevine isolated cells, but also in roots and leaves, showed that the relative abundance of VvATP-S1, VvSr and particularly VvAPR, are up-regulated in the three systems (Amâncio et al., 2009), confirming the crucial role of APR in sulfur metabolism pathway (Vauclare et al., 2002).
1.4. Cytokinin
Cytokinins are essential plant hormones that control various aspects of plant growth and development such as cell division, shoot formation, senescence and chloroplast development (Ito and Kurata, 2006). Cytokinins were discovered during the 1950s due to their ability to induce plant cell division (Miller et al., 1955). The most abundant cytokinins are adenine derivatives substituted at the N6-position with an isoprenoid side chain (Heyl et al., 2006). Conclusions about the biological functions of cytokinins have mainly been derived from studies on the consequences of exogenous cytokinin application or endogenously
enhanced cytokinin levels (Klee and Lanahan, 1995). The previously widely accepted idea that cytokinin was synthesized only in root tips, is now overturned. This hormone has coordinated function as long-distance messenger as well as local signalling; cytokinin is synthesized and act at various sites in a plant body (Sakakibara, 2006). In the control of outgrowth and dormancy of axillary buds, the mutual regulation of auxin, ABA, and cytokinin has been proposed to play a central role (Shimizu-Sato and Mori, 2001). Although an antagonistic role of auxin and cytokinin in the regulation of axillary bud outgrowth has been postulated for a considerable time, little is known. Recent studies revealed that one role of apex-derived auxin in apical dominance is to repress cytokinin biosynthesis in the nodes and that after decapitation cytokinins are locally synthesized in the stem rather than being transported to the stem from the roots (Tanaka et al., 2006).
Recent studies, carried out by Hwang and Sheen (2001), revealed genes implicated in the mechanism of cytokinin perception and signalling in Arabidopsis (Heyl and Scholuling, 2003). Signal transduction systems function as intracellular information-processing pathways that link external stimuli to specific adaptive responses (West and Stock, 2001). The signalling system, besides the membrane bound receptor kinase, which senses the signal and autophosphorylates, consists of phosphotransmitter protein and a response regulator, which upon phosphorylation, activates the transcription of its target genes or initiates another output reaction (West and Stock, 2001).
1.4.1. Signal perception and transduction
In bacteria, phosphorylation on a nitrogen atom of a histidine (His) residue and on an acyl group of an aspartate (Asp) residue is predominantly used to transmit the cytokinin signalling (Kakimoto, 2003; Klumpp and Krieglstein, 2002). The mode of signalling that uses this type of phosphorylation has been referred to as the “two-component system”. The signalling pathways, referred as “two-component system” are structured around two conserved proteins: a histidine protein kinase (HK) and a response regulator protein (RR) that are phosphorylated. Phosphotransfer from HK to RR results in the activation of the later and generation of the output response of the signalling pathway (West and Stock, 2001).
A more complex version of this two-component phosphotransfer scheme includes the His-Asp-His-Asp phosphorelay. This phosphorelay involves multiple phosphotranfer steps and often more than two proteins (Perraud et al., 1999), as verified by Arabidopsis and grapevine (this research). In this system, in addition to HK and RR, also consists in a histidine phosphotransfer protein (HPt), which mediates the signal between the HK and RR (Suzuki et al., 2000).
Three Arabidopsis HK genes (AHK4/CRE1, AHK2 and AHK3) (Hwang and Sheen, 2001), three maize HK genes (ZmHK1, ZmHK2 and ZmHZ3a) (Asakura et al., 2003) and five HK in rice (OHK1, OHK2, OHK3, OHK4 and OHK5) (Ito and Kurata, 2006) were described. The identification of orthologs for cytokinin signalling components in other plant species suggests evolutionary conservation of this pathway (Müller and Sheen, 2007). In Arabidipsis, the three cytokinin receptor genes differ in their expression location: CRE1/AHK4 is mainly expressed in the roots whereas AHK2 and AHK3 are expressed in all major organs.
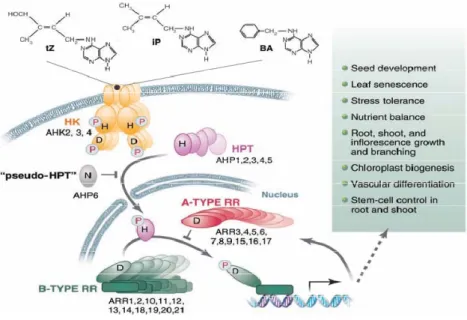
The analysis of Arabidopsis signalling pathway resulted in a model that distinguishes four major steps: (i) cytokinin sensing and initiation of signalling by receptor HKs; (ii) phosphoryl group transfer to HPts and their translocation to the nucleus; (iii) phosphotransfer to nuclear B-type RRs, which activate transcription; and (iv) negative feedback through cytokinin-inducible A-type RRs, which are the products of early cytokinin target genes (Fig. 1) (Müller and Sheen, 2007).
Fig. 1 Model for the cytokinin multistep two-component circuitry through histidine (H), and aspartate (D) phosphorelay, involving histidine-kinase receptors (HK), phosphotransfer proteins (HPT), a “pseudo–HPT” with an asparagine (N) instead of the D, and A-type and B-type RRs (Müller and Sheen, 2007).
The large majority of HKs are membrane-bound, homodimeric proteins with an amino-terminal periplasmic sensing domain that is coupled to a C-amino-terminal cytoplasmic kinase domain (Fig. 2) (West and Stock, 2001). All HKs share a domain in the predicted extracytoplasmic region, designated CHASE, which is the putative recognition site for cytokinin (Ueguchi et al., 2001; Du et al., 2007).
The triple mutant for these three HK genes showed various cytokinin-related development defects and no cytokinin response, but is not lethal (Higuchi et al., 2004). This suggests that either cytokinin is not essential to Arabidopsis growth or another unknown signalling pathway of cytokinin may exist and support the cytokinin-dependent growth of Arabidopsis (Ito and Kurata, 2006).
The HPts perceive a phosphate group from HKs and translocate the phosphate from cytoplasm to the nucleus where it is transferred to RRs. In Arabidopsis, AHPs are predominantly located in the cytoplasm and only a minor proportion in the nucleus (Tanaka
et al., 2004). Importantly, it has been shown that upon induction by cytokinin some AHPs
(AHP1 and AHP2) localize specifically and transiently to the nucleus, indicating it as cytoplasmic-nuclear shuttles, so HPts serves as a crucial intermediate in a His-to-Asp phosphorelay pathway by acquiring and transferring a phosphoryl group from and to a receiver (Suzuki et al., 2000). Recent findings have added some twists to the pathway. Aside from its kinase function, a cytokinin receptor was found to exhibit phosphatase activity that removes phosphoryl groups from AHPs when no cytokinin is bound. Many prokaryote HKs associated with phosphorelay systems that need to be shut off quickly have phosphatase activity. In Arabidopis, the HK phosphatase activity may ensure that, in the absence of cytokinin, the pathway is quickly and completely inactivated (Mähönen et al., 2006).
The RRs are classified in two groups: A-type RR and B-type RR. The B-type RRs have a phosphorelatable receiver domain at their N-terminus and a GARP DNA-binding domain in the midpoint of the sequence; when phosphorylated the activated B-type RRs induce or repress the expression of target genes (Hwang and Sheen, 2001; Sakai et al., 2001). B-type ARRs were found in de nucleus and the structural analysis confirmed they bind to DNA. The predicted secondary structure of the binding domain, a helix-turn-helix motif similar to homeobox proteins, recognizes the major groove of DNA (Hosoda et al., 2002). The DNA motif optimal for binding is 5′-(A/G)GAT(T/C)-3′ with the GAT motif, in the middle, is of special importance (Sakai et al., 2000; Lohrmann et al., 2001; Hosoda et al., 2002). 5′-AGATT-3′ was found to be optimal for ARR1, ARR2 and ARR10 (Sakai et al., 2000; Hosoda
Unlike the expression pattern of A-type ARR genes, the steady-state levels of B-type ARR transcripts are apparently not affected by the application of cytokinin or other plant hormones (Fig. 2).
The A-type RRs have the receiver domain but lack the GARP domain (Fig. 2). Expression of A-type RRs is induced by cytokinin, and the induction is mediated by B-type RRs (D’Agostino
et al., 2000). A-type RRs display properties of cytokinin primary-response genes: the
elevation of the steady-state level of transcript occurs within 10 min of exogenous cytokinin application, the rapid induction is specific for cytokinin (D’Agostino et al., 2000).
1.4.2. Cross-talk between mineral nutrition and cytokinin signalling
As referred above, the primary response of most plant systems under sulfur deficiency is a clear upregulation (or derepression) of sulfate transporters at the transcription level (Smith et al., 1995, 1997; Leustek et al., 2000; Takahashi et al., 1997, 2000; Shibagaki et al., 2002; Yoshimoto et al., 2002). Conversely, sulfate repletion leads to the down-regulation (or repression) of the transporters transcription (Maruyama-Nakashita et al., 2004).
Fig. 2 Structures of cytokinin receptors and other proteins of the cytokinin signalling pathway. Amino acids that participate in the phosphorelay are circled. Other characteristic consensus motifs are also indicated. Abbreviations: aa, amino acids; AD, acidic domain; CHASE, cyclases/histidine kinases associated sensory extracellular; GARP, DNA-binding motif; HK, histidine kinase; LB, putative ligand binding domain; NLS, nuclear localisation signal; OD, output domain; RD, receiver domain; RLD, receiver-like domain; TM, transmembrane domain (Heyl and Schmülling, 2003).
It was verified in Arabidopsis that cytokinin down-regulates the expression of a HAST gene and the sulfate uptake which are induced by sulfur limitation and repressed by the presence of a sulfur source. Maruyama-Nakashita et al. (2004), proposed that cytokinin could act as a negative regulator of sulfur acquisition, suggesting the existence of at least two independent modes of regulation for sulfate acquisition, one induced by sulfate depletion and one dependent on cytokinin.
More convincing evidence for the involvement of hormone signalling components in –S response came from the genetic study of the cytokinin receptor mutant cre1 (Maruyama-Nakashita et al., 2004). The potential role of cytokinin in –S response was suggested by a study in which the –S activated expression of the subunit of seed storage protein β-conglycinin show to be promoted by cytokinin (Ohkama et al., 2002). On the other hand the mutation in CRE1 reduced the cytokinin suppression of both the SULTR 1;2 expression and S uptake. This demonstrates that cytokinin perception plays a negative role at least in regard to sulfate transport (Dan et al., 2007).
However, when zeatin was applied to sulfur-sufficient Arabidopsis an accumulation of sulfate transporter and APS reductase transcripts was observed (Ohkama et al., 2002), pointing to a positive regulation by exogenous cytokinin on the expression of sulfate-responsive genes. If cytokinins do, in fact, are the sole mediators of sulfur starvation signal to regulate the expression of sulfur responsive genes, its concentration in –S tissues was expected to increase. However, in leaf tissues, cytokinin concentration did not increase significantly after two days of sulfate starvation suggesting that it is unlikely that, at least in leaves, cytokinins mediate directly sulfur-deficiency (Ohkama et al., 2002).
Other macronutrients, e.g. phosphate (P), may respond to the application of cytokinin. It has been shown that exogenous application of cytokinin represses the induction of many P starvation-responsive genes in Arabidopsis (Martin et al., 2000) and this effect is attenuated in cre1 mutants, implicating cytokinin in the negative regulation of P starvation responses (Franco-Zorrilla et al., 2002).
1.5. Shoot apical meristem (SAM)
Post-embryonic development in higher plants is characterized by the reiterative formation of lateral organs from the flanks of the apical meristems (Steeves and Sussex, 1989). The shoot apical meristem (SAM), initially formed during embryogenesis, is located at the shoot apex and leaves, stems and axillary meristems are produced from its derivative cells (Shani
et al., 2006). The SAM contains a population of pluripotent stem cells, with three primary
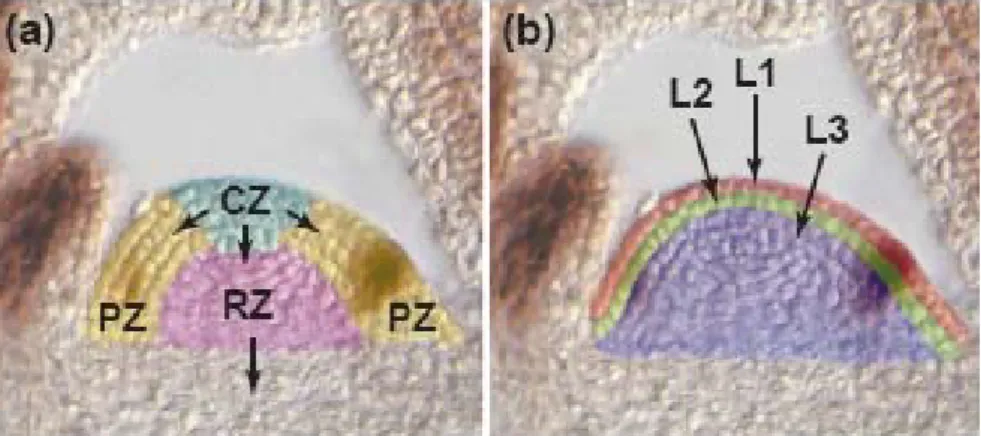
functions: lateral organs, such as leaves, are produced from the peripheral regions of SAM; the basal region cells contribute to the formation of the shoot axis; and the stem cells of SAM must replenish those regions from which cells have been recruited and maintain the pool of stem cells required for further growth (Lenhard and Laux, 1999; Bowman and Eshed, 2000). The shoot apical meristem can be divided into different histological zones. This division is based in two different classifications, one based in histological analyses of shoot apical meristem (Lenhard and Laux, 1999) and the other based in the clonally distinct layers of cells in the zone of the shoot apical meristem (Satina et al., 1940). Based in the first classification, three distinct zones of SAM are defined by cytoplasmatic densities and cell division rate: the peripheral zone (PZ), the central zone (CZ) and the rib zone (RZ) (Shani et al., 2006). Lateral organs are produced from cells recruited from PZ. The CZ, at the summit of the SAM, contains self-maintaining, slowly dividing cells, which provides initials for the PZ (Shani et al., 2006). The shoot axis tissue is derived from cells recruited from the RZ. The CZ acts as a reservoir of stem cells, which replenish both the peripheral and rib zone, as well as maintaining the integrity of the central zone (Fig. 3 a) (Bowman and Eshed, 2000).
The SAM is also composed of clonally distinct layers of cells (Satina et al., 1940). The fact that the peripheral and central zone, as well as the lateral organs produced, contain cells from the three clonally distinct layers indicates that communication between cell layers is required to coordinate developmental processes. For example, leaves in most eudicot species are composed of derivatives from the epidermal layer (L1), the subepidermal layer (L2) and corpus (L3) (Fig. 3 b) (Satina et al., 1941; Bowman and Eshed, 2000). One of the earliest markers of leaf initiation from the PZ is the periclinal cell divisions in specific regions in L2. Cells in L1 and L3 adjust their growth accordingly, with the entire region acting coordinately to produce a leaf primordium (Bowman and Eshed, 2000).
Since 1957, after the work of Skoog and Miller, that the role of phytohormones in controlling the SAM differentiation is suggested. However, the pleiotropic nature of hormone action has made it difficult to understand exactly how hormones act to pattern development (Hay et al., 2004). To this contributes the different effect of hormones depending on their concentration (Skoog and Miller, 1957) and may have opposite effects on the same process in different species (Grant et al., 1994). However, hormones such as auxin and cytokinin appear to display dynamic concentration gradients in SAM and in other plant tissues (Shani et al., 2006). Recent molecular and imaging studies unraveled information on the endogenous spatial and temporal distribution of plant hormones.
1.5.1.
Regulation of shoot apical meristem
Plant development depends on the continuous activity of meristem to produce organs throughout plants life. In the past decade, the genetic dissection of plant hormone biosynthesis and signalling pathways has offered new opportunities for studying the role of hormones (Hay et al., 2004). Several groups of transcription factors have been shown to take part in SAM differentiation. KNOTTED1-like homeobox (KNOX1) proteins are expressed in specific patterns in the SAM of different plant species (Shani et al., 2006). The control of hormone biosynthesis by the KNOX class of transcription factors has recently emerged as an example of perhaps unexpected interactions between hormones and developmental genes (Sakamoto et al., 2001; Hay et al., 2002; Hay et al., 2004).
Fig 3 Histology of the shoot apical meristem (SAM). a) zones of SAM defined by cytoplasmic densities and cell division rate: peripheral zone (PZ); central zone (CZ) and rib zone (RZ); b) SAM defined by different clonally distinct layers of cells: epidermal layer (L1); subepidermal layer (L2) and Corpus (L3) (Bowman and Eshed, 2000).
KNOTTED1 defines the first homeobox gene family to be isolated in plants (Vollbrecht et al., 1991).The Arabidopsis class 1 KNOX gene subfamily comprises SHOOT MERISTEMLESS
(STM),KNAT1/BREVIPEDICELLUS (BP), KNAT2 and KNAT6 (Lincoln et al., 1994; Dockx et
al., 1995; Long et al., 1996; Semiarti et al., 2001; Dean et al., 2004; Scofield et al., 2007). The gene STM is required for the initiation and maintenance of the shoot apical meristem in
Arabidopsis. One of theearliest indicators of a switch in fate from indeterminate meristem to
determinate leaf primordium is the down-regulation ofKNOX1 genes orthologous to STM in the incipientprimordia (Uchida et al., 2007). Embryos homozygous for strong loss-of-function mutations in the STM form cotyledons and other embryonic structures but fail to establish a population of self-renewing stem cells (Long et al., 1996). Another early gene expressed is
WUSCHEL (WUS), whose expression, in mature shoot apical meristem, is limited to a small
group of cells underneath the outer three layers (L3). The WUS expression pattern gradually becomes limited to deeper regions of the shoot apical meristem, since it is required to produce the stem cell maintenance signal (Mar Castellano and Sablowski, 2005).
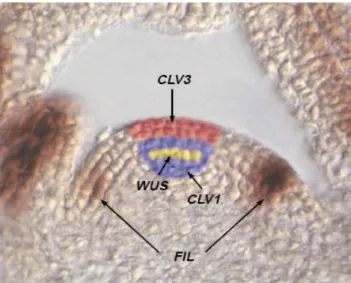
WUS expression is under negative control by the CLAVATA genes (CLV1, CLV2 and CLV3), which encode components of a presumed receptor-kinase signal transduction pathway (Fletcher et al., 1999; Lenhard et al., 2002). Stem cells express CLV3, and signalling of CLV3 through the CLV1/CLV2 receptor complex restricts WUS activity. Homeostasis of the stem cell population may be achieved through feedback regulation, whereby changes in stem cell number result in corresponding changes in CLV3 expression levels, and adjustment of WUS expression via the CLV signal transduction pathway. It was found that the expression of CLV3 depends only of WUS function in the embryonic shoot meristem. At later developmental stages, WUS promotes the level of CLV3 expression, together with STM. Within a meristem, competence to respond to WUS activity by expressing CLV3 is restricted to the meristem apex (Brand et al., 2000). In clv mutants, the SAM enlarges progressively by the accumulation of stem cells (Fletcher et al., 1999; Lenhard et al., 2002) and this enlargement appears to be a consequence of ectopic WUS expression in more apical and lateral cells in clv mutant SAMs (Schoof et al., 2000). This has led to a model in which stem cell maintenance is regulated by a negative feedback loop mediated by the WUS and CLV3 genes, with the organizing centre signalling to the apical neighbours to specify them as stem cells, which in turn signal back to restrict the size of the organizing centre (Brand et al., 2000; Schoof et al., 2000; Lenhard et al., 2002). In summary, the earliest acting genes (WUS and STM), are required for the establishment or maintenance of stem cell fate or alternatively, the repression of differentiation, whereas later expressed genes might be
involved in regulating the size of the central zone (CLV1) (Bowman and Eshed, 2000) (Fig. 4).
1.5.2
Hormones and shoot apical meristem
Recent studies have revealed the relationships between genes for transcription factors and a variety of hormones like cytokinin, gibberellins and auxin in the shoot apical meristem (Shani
et al., 2006).
Cytokinin positively regulates cell division (Skoog and Miller, 1957; Riou-Khamlichi et al., 1999). Recent advances in understanding the cytokinin-signal cascade in Arabidopsis enabled an assessment of the role of cytokinin in SAM function. This analysis focused on the triple mutant for the genes encoding cytokinin receptors (AHK2, AHK3 and AHK4/CRE1) (Riefler et al., 2006). This mutant displayed pleitropic phenotypes including a dramatic reduction in meristem size (Shani et al., 2006).
The involvement of KNOX1 proteins and cytokinin in the response of SAM has been suggested by Hay et al. (2004). Two studies provided direct molecular evidence for the positive regulation of cytokinin biosynthesis by KNOX1 proteins in Arabidopsis. Ectopic activation of several KNOX1 proteins, including STM, in transgenic Arabidopsis plants result in a rapid increase in the expression of the cytokinin biosynthesis gene ISOPENTENYL
TRANSFERASE 7 (IPT7) (Jasinski et al., 2005; Yanai et al., 2005).
Fig. 4 Expression patterns of genes involved in maintaining the integrity of the central zone. CLAVATA3 (CLV3),
Arabidopsis type-A response regulators (RRs) are cytokinin-induced negative regulators of cytokinin signal (Ferreira and Kieber, 2005). Overexpression of a constitutively active form of ARR7 caused variable phenotypic aberrations, the most severe of which was the early meristem determination, similar to that of wus mutants (Leibfried et al., 2005). Conversely, STM activation results in an increase in ARR5 expression (Jasinski et al., 2005; Yanai et al., 2005). Although these results appear contradictory, the induction of ARR5 by STM is a consequence of its effect on cytokinin accumulation and the direct effect of WUS. The repression of ARRs by WUS thus balances its induction by cytokinin and allows differential cytokinin responses in specific regions of the meristem (Shani et al., 2006).
1.6. Axillary meristem
After germination, the shoot apical meristem generates the main shoot, leaf primordia and new meristems (Aguilar-Martinez et al., 2007). In the axil of each leaf, at the base of the leaf petiole, one or more secondary axillary meristem can form (Ongaro and Leyser, 2008). New shoot meristems formed in the axils of the leaves are established at the time of leaf primordial initiation or later in the development from groups of cells that retain meristematic potential (Schmitz and Theres, 2005; Aguilar-Martinez et al., 2007). There are two theories about the initiation of axillary meristem. The detached meristem hypothesis proposes that axillary meristem is derived directly from cells of the SAM, which never lose their meristematic identity (Garrison, 1955; Leyser, 2003). The alternative model proposes that axillary meristem initiate de novo from cells in the leaf axil (Snow and Snow, 1942; Leyser, 2003). These two models have persisted because axillary meristem origin appears to be species dependent. In potato, at the time of leaf inception, meristematic cells are observed at the base of each leaf on the flanks of the primary shoot apical meristem (McDaniel and Poethig, 1988; Leyser, 2003). By contrast, in Arabidopsis, axillary meristems are not visible until long after leaf initiation (Gribic and Bleecker, 2000; Leyser, 2003).
During vegetative development, axillary meristems are initiated in an acropetal order, first in the axils of mature leaves distant from the shoot apex and later in younger leaves. Genes such as LATERAL SUPPRESSOR (LAS) (Greb et al., 2003) or REGULATOR OF AXILLARY
MERISTEMS (RAX) (Keller et al., 2006; Muller et al., 2006) are necessary during axillary
meristem initiation to maintain the meristematic potential of leaves and to allow the organization of a stem cell niche (Aguilar-Martinez et al., 2007). Other gene also involved in
early stages of axillary meristem is REVOLUTA/INTERFASCICULAR FIBERLESS1 (REV/IFL1) (Talbert et al., 1995).
Branching patterns depend on a key development decision: whether axillary buds grow out to give a branch or whether they remain small and dormant in the axils of the leaves. This decision is reversibly controlled by developmental and environmental stimuli (Horvath et al., 2003). These environmental signals are likely to be relayed through the action of plant hormones. Of particular importance are auxin and cytokinin, as well as a new carotenoid-derived hormone (Simons et al., 2007; Ongaro and Leyser, 2008).
Auxin was the first hormone linked to the regulation of shoot branching. It is known that the apex of the plant inhibits axillary bud outgrowth (Ongaro and Leyser, 2008). In pioneer experiments conducted by Thimann and Skoog (1934), they showed that auxin applied to the top of a decapitated plant mimics the effect of the removed apex, preventing bud outgrowth. Long-rang signalling promoting bud arrest is controlled both by auxin produced in the shoot apex and transported basipetally and by a novel carotenoid synthesized in the root and transported acropetally (Dun et al., 2006; Aguilar-Martinez et al., 2007). Mutations in the
MORE AXILLARY GROUTH (MAX) genes, which control’s the synthesis and activity of the
carotenoid-derived hormone in Arabidopsis cause an excess of branch outgrowth (Booker et al., 2004, 2005).
Another hormone that is involved in shoot branching is cytokinin. In contrast to the indirect inhibitory action of auxin, cytokinin directly promotes bud growth (Ongaro and Leyser, 2008). Cytokinin levels increase in buds as they activate (Emery et al., 1998; Ongaro and Leyser, 2008).
Genes promoting local bud arrest within the bud have been described in monocots. They are
teosinte branched1 (tb 1) from maize (Doebley et al., 1997) and its rice ortholog, Os tb1 (Hu
et al., 2003; Takeda et al., 2003). These genes are expressed in axillary meristem and buds
where they suppress growth (Hubbard et al., 2002; Takeda et al., 2003). In 2007 Aguilar-Martinez et al. described BRANCHED1 (BRC1) and BRANCHED2 (BRC2) as the most closely related to tb 1 in Arabidopsis, and showed that both genes play a central role in the control of axillary bud development.
1.7. Objectives
Previous works in our group put in evidence that in vitro grapevine shoots respond markedly when transferred from full nutrition medium to sulfate starvation. Responses were measured at the sulfate uptake and metabolism level and noticed as qualitative traits, namely the reversion of apical dominance inhibition triggered by routinely added cytokinin. Those traits were noticed as growth impairment and branching inhibition.
One explanation for such symptoms is the interference of sulfur deficiency with cytokinin signal pathway genes or with the expression of transcription factors acting at SAM or AM level. Therefore, and to elucidate those hypothesis, the crosstalk between cytokinin signalling and sulfur status deserved further investigation.
In the present work, Vitis experimental systems, namely callus, isolated cells and in vitro shoots, were used to assess the effects of sulfur deficiency through the analysis of growth parameters. As a second approach, taking advantage of Vitis genome sequencing, we performed a database search of genes associated to the cytokinin signal pathway and genes related with SAM and AM identity.
Finally, the expression of the former genes was analysed by quantitative real time PCR in the different biological systems under sulfur sufficient and deficient conditions.
The discussion of the results obtained so far allowed fostering tentative, certainly far from definitive, conclusions.
2. Material and methods
2.1. Plant material
Callus, cell suspensions and in vitro shoots of Vitis vinifera var. Touriga Nacional were used
in all experiments.
2.1.1. Growth conditions of Vitis callus
Callus of Vitis vinifera cv Touriga Nacional material was maintained in the dark at 25ºC, as
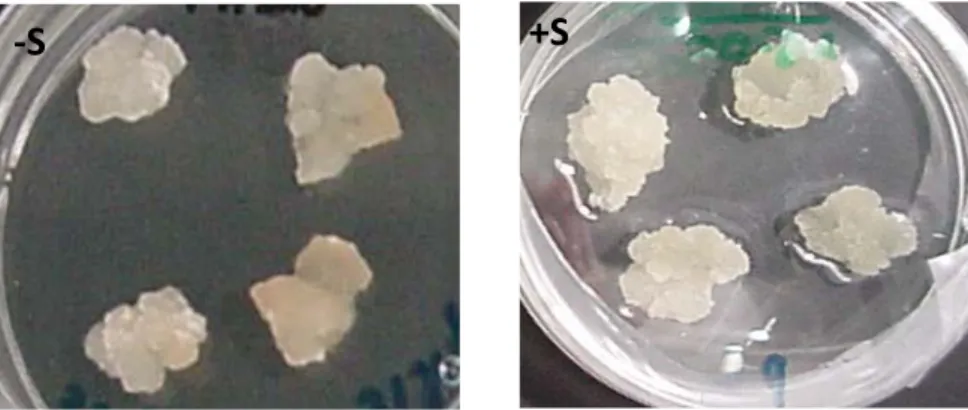
described in Jackson et al. (2001). Circa 5 g callus tissue were used as initial explant to prepare 4 callus pieces distributed in petri dishes with medium containing MS basal salts supplemented with 2.5 µM 2,4-D (2,4-dichlorophenoxy-acetic acid); 1 µM kinetin; 5 g l-1 PVP-40T; 20 g l-1, sucrose; 2 g/l Gelrite at pH 5.7. The cultures growing in the dark, at 25 ºC, were sub-cultured every two weeks. Two sulfate treatments were applied: full sulfate (+S) and sulfate deprivation (-S). Commercial MS (Duchefa Biochemie, Haarlem, NL) (1.5 mM sulfate) (Murashige and Skoog, 1962) was used for +S experiments while a modified MS medium where sulfates were substituted for chlorates was considered –S. In the second sub-culture the callus in +S treatment were sub-culture to +S medium and –S treatment for –S medium. During the three culture cycles of two weeks, at least 4 samples per treatment were collected in each sub-culture (Fig. 5).
Fig. 5 Vitis callus in MS -S and +S medium after the first week of the first growth cycle.
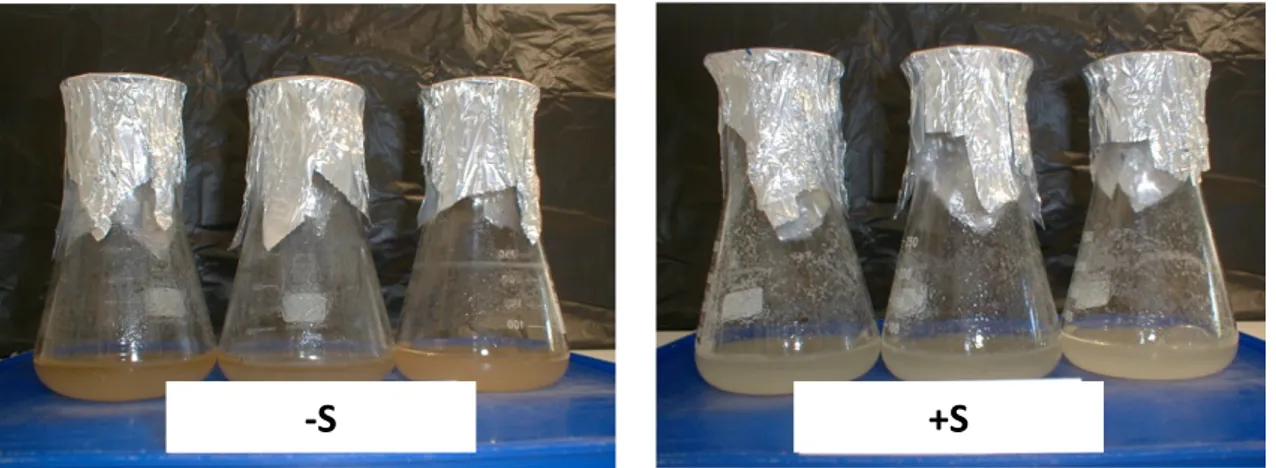
2.1.2. Growth conditions of cell suspensions
Cell suspensions were obtained by adapting to liquid culture, Vitis vinifera callus material maintained obtained as described in 2.1.1.. Ca 4 g callus tissue was dispersed in 50 ml of liquid MS medium (as in 2.1.1.) in 250 ml flasks. The cultures growing in a rotary shaker at 100 rpm, in the dark, at 25 ºC were sub-cultured weekly by diluting 25 ml culture into 25 ml of fresh medium. After two cycles in +S conditions two sulfate treatments were applied: full sulfate (+S) and sulfate deprivation (-S). During the 7 days culture cycle, samples of at least three flasks per treatment were collected by filtration in day 1, 4 and 7 (Fig. 6).
The growth condition for cells without cytokinin were the same as previously described, the only change was the withdrawal of cytokinin from the medium.
2.1.3. Growth conditions of in vitro shoots
2.1.3.1. Gel medium (GM)
In vitro shoots of Vitis vinifera L., var. Touriga Nacional were used as explants for in vitro
multiplication as described in Neves et al. (1998). Explants were sub-cultured every four weeks into MS basal medium supplemented with 0.5 µM α-naphthaleneacetic acid (NAA), 5.0 µM 6-benzylaminopurine (BA), 30 g L–1 sucrose, pH 5.8, and 2 g L–1 Gelrite. Cultures of 5 explants in 250 mL Magenta vessels (Sigma-Aldrich St. Louis, MO) were maintained in a growth chamber under light from cool-white fluorescent lamps with 16/8h photoperiod at 50 ±
Fig. 6 Vitis cells growing for two weeks in a modified MS without sulfate (-S) or MS (+S) in liquid medium.