Vol.58, n.5: pp. 765-772, September-October 2015 http://dx.doi.org/10.1590/S1516-89132015050197
ISSN 1516-8913 Printed in Brazil
BRAZILIAN ARCHIVES OF BIOLOGY AND TECHNOLOGY
A N I N T E R N A T I O N A L J O U R N A L
Molecular Insights into the Genetic Diversity of
Garcinia
cambogia
Germplasm Accessions
Tharachand C
1, Immanuel Selvaraj C
1*and Abraham Z
21
Plant BiotechnologyDivision; School of Biosciences and Technology; VIT University; Vellore - India. 2National Bureau of Plant Genetic Resources Regional Station; Thrissur, Kerala - India.
ABSTRACT
In this work, the genetic relationship among twelve Garcinia cambogia (Gaertn.) Desr. accessions were evaluated using Random Amplified Polymorphic DNA markers. The samples were part of the germplasm collected and maintained at NBPGR Regional station, Thrissur, India. Out of thirty RAPD primers used for screening, seven primers produced a total of 128 polymorphic markers in twelve accessions. The Polymorphic Information Content (PIC) ranged from 0.28 (OPA18) to 0.37 (OPA9) and Marker Index (MI) ranged between 3.61 (OPA12) and 5.93
(OPA3) among the primers used. Jaccard’s coefficient of genetic similarity ranged between 0.07 and 0.64. The
dendrogram constructed based on the similarity matrix generated from the molecular and morphological data showed the genetic relationship among the sampled accessions. Mantel matrix test showed a positive correlation (r = 0.49) between the cluster analysis of RAPD data and morphological data. The clustering pattern in the molecular dendrogram and Principle Coordinate Analysis (PCoA) showed that the genotypes were diverse, which was in congruence with the similarity index values and morphological dendrogram. High frequency of similarity values in the range of 0.11 to 0.17 suggested the existence of high genetic diversity among the accessions. The high level of genetic diversity among the studied accessions of G.cambogia was also supported by the large variation in the morphological characters observed in the flowers, leaves, fruits and seeds of these sampled accessions. This is the first report for the molecular based genetic diversity studies for these accessions.
Key words:Garcinia cambogia, Genetic diversity, Germplasm, Jaccard’s coefficient, Malabar tamarind
*Author for correspondence: [email protected]
INTRODUCTION
The genus Garcinia L. belongs to the family
Clusiaceae (Guttiferae). This family consists of approximately 200 species throughout the world, among which 36 species occur in India. The Western Ghats region is considered as a secondary center of origin for Garcinia species, where six species are endemic (Abraham et al. 2006). The species G. gummi-gutta is reported to maintain the forest ecosystem stability in central Western Ghats. Several studies have compared the species diversity in the forests. G. gummi-gutta with the
2014). These trees can grow up to the height of 20 meters. There is a wide variability in the branching pattern and crown of the tree and extensive variation in fruit and seed characters (Abraham et al 2006). The medicinal properties of the plant have been studied extensively. It acts as hydragogue, diuretic, anthelmintic, antiseptic, antibacterial, antioxidant, hypolipidemic and weight reducing agent (Shara et al. 2004; Mathew et al. 2011a; Mathew et al. 2011b; Shivakumar et al. 2013). Malabar tamarind contains various biologically important compounds such as
xanthones, benzophenones and guttiferones
(Iinuma et al. 1998; Masullo et al. 2010). Fruit rind is the most extensively studied part of the plant. However, the information on the genetic diversity of G. cambogia is very limited.
Molecular markers offer a great advantage over the morphological and biochemical markers in species identification, phylogenetic studies and in mapping the genetic linkage (Suh et al. 2011). Combined approach of both morphological and molecular markers was also carried out to identify and characterize the species. Different molecular markers have been used for the genetic diversity
studies in different Garcinia species. Molecular
investigations using Internal Transcribed Spacer (ITS) were carried out for identifying the origin of Mangosteen (Nazre 2014). Mansyah et al. (2013) evaluated the genetic diversity among and within G. mangostana L. (Mangosteen) trees and found that genetic variation occurred among the accessions of mangosteen and also among the progenies within one mother plant. In another
study, the genetic diversity in G. indica was
assessed by the morphological and molecular markers. The plants studied were collected from four different locations of Maharashtra state of India. They showed low diversity at both morphological as well as molecular levels (Thatte et al. 2012). Parthasarathy et al (2013) reported the reduced distribution and population size to
alarming levels in G. cambogia and emphasized
the necessity to characterize this species. They also reported about the threat to the species and the reasons for the genetic erosion of this resource. An intra- and inter-species genetic relationship study
was carried out among the species of Garcinia,
namely G. cambogia, G. cowa, G. hombroniana,
G. indica, G. mangostana and G. xanthochymus by using RAPD markers. The study reported high genetic diversity within G. cambogia species (Rao et al. 2003). The significance of the germplasm is
recognized only when it is characterized (Rao et
al. 2002). Hence, the characterization of G.
cambogia germplasm is necessary for its conservation and maintenance.
The plants used in this study for characterization of G. cambogia germplasm were part of the germplasm collected and maintained by Abraham et al (2006). Till date there are no reports based on the molecular markers for the genetic diversity for these sampled accessions. DNA based molecular markers are the good choice for genetic diversity studies, as they are not affected by environmental factors and can detect the variation at DNA level. Assessing the genetic variation between the accessions based on RAPD technique is accepted because of its high potential for detecting the polymorphism (Tingey and del Tufo 1993). The aim of the present study was to fingerprint and explore the genetic relationship among the accessions using RAPD molecular markers. The genetic relationship of the sampled germplasm was investigated based on UPGMA clustering and Principle co-ordinate analysis.
MATERIAL AND METHODS
Plant Materials
Twelve accessions collected from different
geographical localities of Kerala namely
Alapuzha, Ernakulam, Kottayam, and
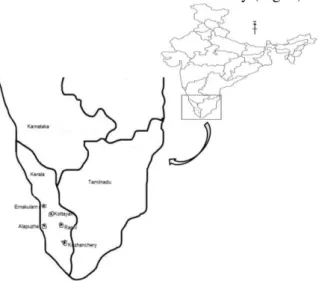
Pathanamthitta were used in this study (Fig. 1).
Figure 1 - Map showing different collection locations of G.cambogia accessions
Thrissur, India. The accessions IC 244098-1, IC 244098-2, IC 244098-3, and IC 244097-3 were collected from Kozhancherry of Pathanamthitta, IC 244099-1, IC 244099-3, IC 244100-1, IC
244100-2, IC 244100-3 from Ranny of
Pathanamthitta, IC 244101-3 from Changanasserry of Kottayam district, IC 244111-1 from Chengal of Ernakulam district and IC 277405-3 from Kurathikadu of Alappuzha district. Young leaves were collected from these accessions for DNA isolation.
DNA Isolation
Total genomic DNA was isolated from the leaves with few modifications to the standard protocol (Doyle 1990). DNA was treated with 3.0 µL of RNase A (20 µg/mL), incubated at 37°C for 30 min to remove RNA. The solution was subjected for proteinase K (50 µg/mL) treatment by incubating at 50°C for 20 min to remove the protein contaminants and stored at -20°C for further use. All the chemicals used in this method were of molecular biology grade purchased from Merck India Limited. The quality of the isolated DNA was checked by using 0.8% agarose gel in TBE buffer (89 mM Tris, 89 mM Boric acid, 2 mM EDTA) containing ethidiumbromide (10
μg/mL). Gels were photographed under UV light
using the gel documentation system (Medic care GELSTAN).
DNA Quantification
The concentration of the extracted DNA was estimated spectrophotometrically (Lasany UV-Visible double beam spectrophotometer) by measuring the absorbance at 260 nm. The purity of DNA samples was analyzed by taking the absorbance ratio of 260/280 nm.
PCR Amplification
PCR amplification was carried out to produce RAPD profiles with random decamer primers (Williams et al. 1990). PCR amplification was performed in 0.2 mL polypropylene PCR tubes
using thermal cycler (Applied Biosystems
Corporation, USA). Each tube contained 25 μL of
reaction mixture which includes 2.5 μL of 10 X
assay buffer (100 mM Tris–HCl; pH 8.3, 500 mM
KCl, 15 mM MgCl2), 100 mM of each dNTPs (dATP, dCTP, dGTP and dTTP), 10 pmol oligonucleotide primers (Sigma Aldrich., India), 1.0 unit of Taq DNA polymerase and 50 ng of template DNA. The amplification reaction was
programmed for 40 cycles as follows: initial denaturation at 93°C for 3 min, followed by 39 cycles each of 30 sec at 93°C (denaturation), 1 min at 47°C (annealing) and 1 min at 72°C (extension). The final step consisted of one cycle of 10 min at 72°C for complete polymerization. The PCR
products were mixed with 2.5 μL of 6X loading
dye (Merck India Ltd., India) and electrophoresed on 1.6% (w/v Gels were photographed under UV light using the gel documentation system (Medic care GELSTAN) and all the reactions were repeated twice to confirm the results.
Data Analysis
The bands, which were clear, unambiguous and reproducible, were scored. Each band was
considered as single locus and scored as ‘1’ and ‘0’ for the presence and the absence of band in
each accession, respectively. The size of the DNA bands was estimated by comparing with 100 bp DNA ladder (Merck India Pvt. Ltd). The Polymorphic Information Content (PIC) value and Marker Index (MI) for all the primers was calculated by using the formula given by De Riek et al. (2011) and Powell et al. (1996).
PIC = 1 – [f2 + (1-f)2] where f was the frequency of the marker.
The number of scored bands represented the number of alleles. PIC value of a marker helped in detecting the polymorphism within a population. The Marker index was calculated as the product of Polymorphic Information Content (PIC) and the number of polymorphic bands. Marker index calculated the overall utility of a marker system. The binary data for the scored primers was used to create the binary data matrix. The genetic relationship among the accessions was analyzed by using the software program Numerical Taxonomy and Multivariate Analysis System for PC (NTSYSpc, version 2.02e [Exeter software, E. Setauket, NY, USA]) (Rohlf 1998). The Similarity for Qualitative data (SIMQUAL) program was
used to calculate the Jaccard’s similarity
coefficient (Jaccard 1908). The phylogenetic tree
(dendrogram) was constructed based on
understand the genetic relationship among the accessions using EIGEN procedure in NTSYS. The coefficient of correlation between similarity matrix and cophenetic matrix was calculated to validate the clustering consistency.
RESULTS AND DISCUSSION
Thirty random decamer primers were used in this study. Out of thirty RAPD primers, seven primers were able to produce clear, unambiguous and reproducible bands. All these seven primers detected a total of 130 amplicons in twelve accessions, out of which 128 were polymorphic. The number of amplicons for each primer varied between 12 (OPA12) and 35 (OPA3) with an average of 18.5 amplicons per primer. The number of bands for each accession ranged from 2 to 11.
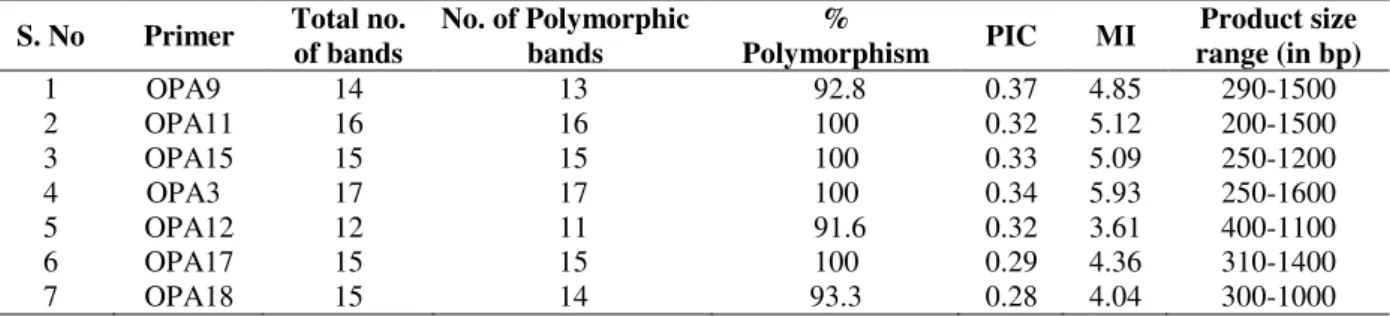
The size of the amplified products ranged between 200 and 1600 bp (Table 1). RAPD primer OPA3 produced maximum number of polymorphic bands (35). The polymorphism percentage across the primers ranged between 91.6 and 100 with an average of 97.7%. Only two RAPD primers, OPA9 and OPA12 showed less than 100% polymorphism. All the other five primers (OPA11, OPA15, OPA3, OPA17 and OPA18) showed 100% polymorphism. The PIC values ranged between 0.28 and 0.37 among the seven RAPD primers. The primer OPA9 showed the highest (0.37) and the primer OPA18 showed the lowest (0.28) PIC value. The marker index among the primers ranged between 3.61 and 5.93 with an average of 4.71. The highest (5.93) and lowest (3.61) MI values were shown by the primers OPA3 and OPA12, respectively.
Table 1- RAPD primers, Polymorphism Information Content (PIC), Marker Index (MI), and Product size obtained in this study.
S. No Primer Total no. of bands
No. of Polymorphic bands
%
Polymorphism PIC MI
Product size range (in bp)
1 OPA9 14 13 92.8 0.37 4.85 290-1500
2 OPA11 16 16 100 0.32 5.12 200-1500
3 OPA15 15 15 100 0.33 5.09 250-1200
4 OPA3 17 17 100 0.34 5.93 250-1600
5 OPA12 12 11 91.6 0.32 3.61 400-1100
6 OPA17 15 15 100 0.29 4.36 310-1400
7 OPA18 15 14 93.3 0.28 4.04 300-1000
The Jaccard’s coefficients of genetic similarity
among the accessions of G. cambogia ranged
between 0.07 and 0.64 (Table 2). The accessions
IC 244100-3 (Ranny) and IC 277405-3
(Kurathikadu) were closely related (64%
similarity) among the studied accessions;
accession IC 244098-1 collected from
Kozhanchery and the accession IC 244100-1 collected from Ranny were distantly (7%
similarity) related among the accessions.
Occurrence of more pair-wise similarity values in the range of 0.11 - 0.17 suggested the existence of high genetic diversity among the accessions studied. The high level of variation in genetic similarity among the accessions observed was probably due to the differences between individuals within the population and non-domesticated nature of the species. It has been reported that outcrossing is one of the factor to maintain high level of genetic diversity (Rao and Hodgkin 2002). Thatte et al. (2012) reported the
low levels of diversity in G. indica using
morphological and molecular markers (RAPD and ISSR). The highest diversity within that population was 19.93%. Ramage et al (2004) studied the
genetic diversity in G. mangostana L.
(Mangosteen) by Randomly Amplified DNA Fingerprinting (RAF) technique and found
extensive variation between G. mangostana
accessions.
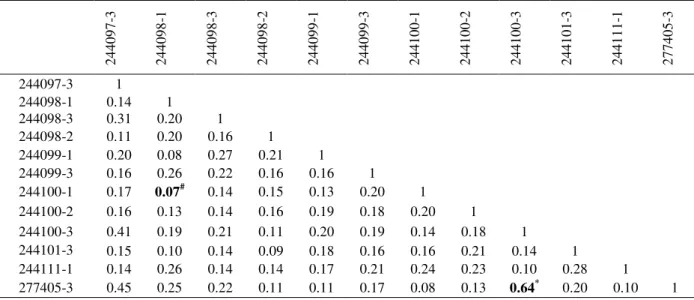
Table 2 - Jaccard’s coefficient of similarity between the twelve accessions of G. cambogia based on RAPD markers.
2
4
4
0
9
7
-3
2
4
4
0
9
8
-1
2
4
4
0
9
8
-3
2
4
4
0
9
8
-2
2
4
4
0
9
9
-1
2
4
4
0
9
9
-3
2
4
4
1
0
0
-1
2
4
4
1
0
0
-2
2
4
4
1
0
0
-3
2
4
4
1
0
1
-3
2
4
4
1
1
1
-1
2
7
7
4
0
5
-3
244097-3 1 244098-1 0.14 1
244098-3 0.31 0.20 1
244098-2 0.11 0.20 0.16 1
244099-1 0.20 0.08 0.27 0.21 1 244099-3 0.16 0.26 0.22 0.16 0.16 1
244100-1 0.17 0.07# 0.14 0.15 0.13 0.20 1
244100-2 0.16 0.13 0.14 0.16 0.19 0.18 0.20 1
244100-3 0.41 0.19 0.21 0.11 0.20 0.19 0.14 0.18 1
244101-3 0.15 0.10 0.14 0.09 0.18 0.16 0.16 0.21 0.14 1 244111-1 0.14 0.26 0.14 0.14 0.17 0.21 0.24 0.23 0.10 0.28 1 277405-3 0.45 0.25 0.22 0.11 0.11 0.17 0.08 0.13 0.64* 0.20 0.10 1 # - indicates the accessions are more genetically diverse; * - indicates the accessions are more similar
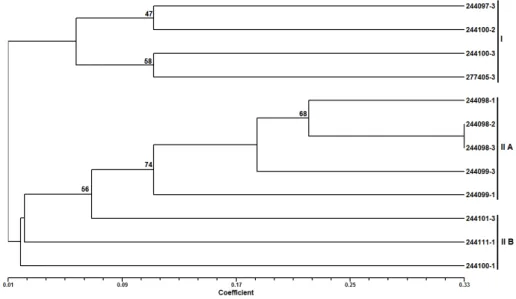
Figure 2 - Dendrogram representing the genetic diversity among the twelve accessions of G.cambogia
accessions based on UPGMA cluster analysis of DNA markers. Numbers at nodes represent the bootstrap values.
Cluster I was further divided into two sub-clusters IA and IB at a similarity index value of 0.18. In sub-cluster IA, the accessions IC 277405-3 (Kurathikadu) and IC 244100-3 (Ranny) were closely related with maximum similarity of 64%. The accession IC 244097-3 (Kozhanchery) was similar with IC 277405-3 (Kurathikadu) and IC 244100-3 (Ranny) with 42% similarity. In the same sub-cluster IA, the accessions IC 244098-3 (Kozhanchery) and IC 244099-1 (Ranny) were related to each other with similarity of 27%. These two accessions, IC 244098-3 (Kozhanchery) and IC 244099-1 (Ranny) were related to the
accessions IC 244097-3 (Kozhanchery), IC 244100-3 (Ranny) and IC 277405-3 (Kurathikadu) with similarity of 21%. The sub-cluster IB
contained the accessions IC 244098-1
(Kozhanchery) and IC 244099-3 (Ranny) with similarity of 27%.
three accessions of the cluster, i.e., IC 244100-2, IC 244101-3 and IC 244111-1. The separation of groups in the clusters was supported by the bootstrap analysis as represented with bootstrap values in Figure 2. Bootstrap value of 100 at the smaller node between the accessions IC 244100-3 and IC 277405-3 indicated that these two accessions clustered together and genetically similar. This was evident from the dendrogram, which showed the similarity of 64% between these two mentioned accessions. The branches of the dendrogram having low bootstrap values (<50) indicated the low robustness of those branches. The dendrogram obtained from the UPGMA clustering revealed that there was huge genetic variation among the accessions. This large genetic variation reflected the genetic diversity in the G. cambogia plantations from where these accessions were originated. The clustering pattern was interesting. In spite of the plants being collected from the same geographical location, they showed
large genetic variation. Interestingly, there was a common feature observed in all the accessions of cluster II. All the accessions grouped in the cluster II were of female plants with similarity ranging from 20 to 28%. However all of them were from different geographical locations. Similarly, sub-cluster IB contained both the male accessions from
two different geographical (Ranny and
Kozhancherry) locations of the same district
(Pathanamthitta). Statistically significant
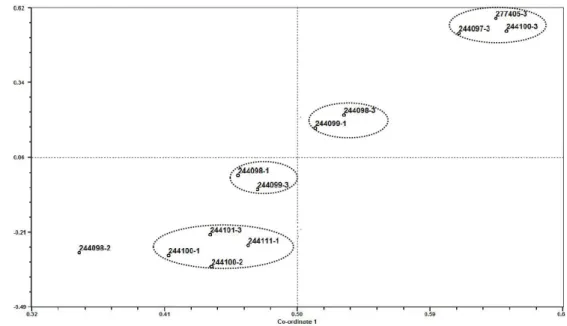
coefficient of cophenetic correlation between the similarity matrix and cophenetic matrix was 0.89, indicating the satisfactory clustering consistency. The Principle Coordinate Analysis (PCoA) plot generated by the RAPD primers is presented in Figure 3. Coordinates of the PCoA plot showed the relationship of the accessions. The first principle coordinate gave the direction of greatest variability and the second principle coordinate gave the direction of next greatest variability.
Figure 3 - Principle Coordinate Analysis (PCoA) plot of genetic diversity of G.cambogia accessions with RAPD markers.
These principle coordinates reduced the
dimensionality of representation. The first three principle coordinates in the analysis accounted for 52.23, 27.31 and 6.06% of the total variance, respectively. PCoA plot revealed that G. cambogia accessions could be divided into four groups with huge variance. This result was comparable to the genetic variation showed by UPGMA dendrogram. The analysis of the fruit and seed characters was carried out only for the trees of female accessions
because G.cambogia is a dioecious species. The
(2013) who reported the maximum diversity of G. cambogia from the populations of Kerala and the heterogeneity index within the species of G. cowa, G. gummi-gutta, G. indica and G. xanthochymus was between 0.81 and 0.82 and Rao et al. (2003) who reported the inter-species and intra-species
relationship among the Garcinia species, namely
G. cambogia, G. cowa, G. hombroniana, G. inidca, G. mangostana and G. xanthochymus based on genetic diversity studies. The high
molecular diversity within G. cambogia species
was observed.
Figure 4 - Dendrogram representing the genetic diversity among the twelve accessions of G.cambogia
accessions based on UPGMA cluster analysis of morphological traits. Numbers at nodes represent the bootstrap values.
CONCLUSION
The purpose of this study was to assess the genetic
diversity of G. cambogia accessions using RAPD
markers. A better understanding of genetic diversity and its distribution is necessary for its conservation. The study revealed high level of genetic diversity among the accessions collected from different geographical locations, which was evidenced by the variations observed in their
morphological characters. The accessions
belonging to the same geographical location also showed variation in the genetic diversity. The high level of genetic variation observed in these accessions could be due to outcrossing (the means
of pollination in G.cambogia could be insects),
which caused the gene flow within and between the populations. These results could be useful in
efficient management of G. cambogia germplasm
for their conservation and optimal utilization. Further studies using larger number of accessions from different geographical locations of India
could provide better understanding of the genetic diversity of G.cambogia.
ACKNOWLEDGEMENTS
Authors thank the management of VIT University for providing the necessary infrastructure to carry out this work, The Director, NBPGR, New Delhi for permitting to collect the samples in the germplasm and NBPGR Regional station, Thrissur for providing the germplasm samples.
REFERENCES
Abraham Z, Malik SK, Rao G, Narayanan SL, Biju S. Collection and Characterisation of Malabar Tamarind [Garcinia cambogia (Gaertn.) Desr.]. Genet Resour Crop Evol. 2006; 53(2): 401-406.
De Riek J, Calsyn E, Everaert I, Van Bockstaele E, De Loose M. AFLP based alternatives for the assessment of Distinctness, Uniformity and Stability of sugar beet varieties. Theor Appl Genet. 2001; 103:1254-1265.
Doyle JJ. Isolation of plant DNA from fresh tissue.
Focus. 1990; 12: 13-15.
Iinuma M, Ito T, Miyake R, Tosa H, Tanaka T, Chelladurai V. A xanthone from Garcinia cambogia.
Phytochem. 1998; 47(6): 1169-1170.
Jaccard P. Nouvelles recherches sur la distribution florale. Bull Soc Vaudoise Sci Natl. 1908; 44: 223– 270.
Mansyah E, Santoso PJ, Muas I, Sobir. Evaluation of Genetic Diversity among and within Mangosteen (Garcinia mangostana L.) Trees. IV International Symposium on Tropical and Subtropical Fruits, ISHS Acta Horticulturae 2013; 975: 73-80.
Masullo M, Bassarello C, Bifulco G, Piacente S. Polyisoprenylated benzophenone derivatives from the fruits of Garcinia cambogia and their absolute configuration by quantum chemical circular dichroism calculations. Tetrahedron. 2010; 66(1): 139-145.
Mathew G, Mathew B, Shaneeb M, Nyanthara B. Diuretic activity of leaves of Garcinia cambogia in rats. Indian J Pharm Sci. 2011a; 73(1): 228-230. Mathew GE, Mathew B, Sheneeb MM, Nyanthara,
Haribabu Y. Anthelmintic activity of leaves of
Garcinia cambogia. Int J Res Pharm Sci. 2011b; 2(1): 63-65.
Nagaraja BC, Raj MB, Kavitha A, Somashekar RK. Impact of rural community harvesting practices on plant biodiversity in Kudremukh National Park. India.
Int J Biodivers Sci Ecosystem Serv Manag. 2011; 7(1):69-74.
Nazre M. New evidence on the origin of mangosteen (Garcinia mangostana L.) based on morphology and ITS sequence. Genet Resour Crop Evol. 2014; 61: 1147-1158.
Parthasarathy U, Babu KN, Kumar RS, Ashis GR. Diversity of Indian Garcinia – a Medicinally Important Spice Crop in India. II International Symposium on Underutilized Plant Species: Crops for the Future - Beyond Food Security, ISHS Acta Horticulturae. 2013; 979: 467-476.
Pavlicek A, Hrda S, Flegr J. Free-Tree--freeware program for construction of phylogenetic trees on the basis of distance data and bootstrap/jackknife analysis of the tree robustness. Application in the RAPD analysis of genus Frenkelia. Folia Biol. 1999; 45(3): 97-99.
Powell W, Morgante M, Andre C, Hanafey M, Vogel J, Tingey S, Rafalski A. The comparison of RFLP, RAPD, AFLP and SSR (microsatellite) markers for germplasm analysis. Mol breed. 1996; 2: 225-238.
Rao VVP. Molecular characterization of Garcinia using RAPD Polymorphism. M Sc Dissertation, Acharya Nagarjuna University, 2003.
Ramage CM, Sando L, Peace CP, Carroll BJ, Drew RA. Genetic diversity revealed in the apomictic fruit species Garcinia mangostana L. (mangosteen).
Euphytica. 2004; 136: 1-10.
Rao VR, Hodgkin T. Genetic diversity and conservation and utilization of plant genetic resources. Plant Cell, Tissue and Organ Culture. 2002; 68(1): 1-19.
Rohlf FJ. NTSYS-PC, Numerical taxonomy and multivariate analysis system, version 2.02a. Exeter Publications, Setauket, New York; 1998.
Shara M, Ohia SE, Schmidt RE, Yasmin T, Zardetto-Smith A, Kincaid A, et al. Physico-chemical properties of a novel (-)-hydroxycitric acid extract and its effect on body weight, selected organ weights, hepatic lipid peroxidation and DNA fragmentation, hematology and clinical chemistry, and histopathological changes over a period of 90 days.
Mol Cell Biochem. 2004; 260: 171-186.
Shivakumar S, Sandhiya S, Subhasree N, Agrawal A, Dubey GP. In vitro assessment of antibacterial and antioxidant activities of fruit rind extracts of Garcinia cambogia. L. Int J Pharm Pharm Sci. 2013; 5(2): 254-257.
Sneath PHA, Sokal RR. Numerical taxonomy—the principles and practice of numerical classification. Freeman W H, San Francisco, 1973.
Suh JK, Hetterscheid W, Lee AK, Hong J, Roh MS. Identification and evaluation of Forsythia germplasm using molecular markers. Genet Resour Crop Evol.
2011; 58: 1225-1235.
Tharachand, Selvaraj I, Avadhani M. Medicinal properties of Malabar tamarind [Garcinia cambogia
(Gaertn.) DESR.]. Int J Pharm Sci Rev Res. 2013; 19(2): 101-107.
Thatte KS, Khandekar RG, Deodhar MA. Assessment of diversity in Garcinia indica (Dupetit-Thouars.) Choisy. using morphological and molecular markers.
Journal of tropical Agriculture. 2012; 50: 30-36. Tingey SV, del Tufo JP. Genetic Analysis with Random
Amplified Polymorphic DNA Markers. Plant Physiol. 1993; 101(2): 349-352.
Williams JG, Kubelik AR, Livak KJ, Rafalski JA, Tingey SV. DNA polymorphisms amplified by arbitrary primers are useful as genetic markers.
Nucleic Acids Res. 1990; 18(22): 6531-6535.